Building information modeling (BIM) is an indispensable tool for modern construction projects, offering a comprehensive and collaborative approach to design, construction, and facilities management. It empowers professionals like you to unlock the true potential of your data and extract valuable insights that fuel informed decision-making.
At our core, we understand the importance of maximizing the value of your data. With that in mind, we have meticulously crafted a cutting-edge workflow that seamlessly integrates SeveUp with Power BI, enabling you to effortlessly generate dynamic and visually captivating Power BI dashboards from your diverse data sources. This groundbreaking integration opens a world of possibilities, revolutionizing the way you analyze and leverage your BIM data.
But we don’t stop there. We strive to provide a holistic solution that simplifies your workflow and ensures your dashboards are always up to date, effortlessly accessible, and hassle-free to maintain.
What is Power BI and why is it relevant for data analysis and visualization?
Power BI, an innovative solution developed by Microsoft, serves as a robust business analytics tool that empowers users to effortlessly transform raw data into meaningful and actionable insights. With its wide array of features catered toward data analysis, visualization, and interactive reporting, Power BI has emerged as an invaluable asset for organizations spanning diverse industries.
At its core, Power BI seamlessly connects with multiple data sources, including databases, spreadsheets, and cloud services, consolidating them in a unified and coherent view. This unified data can then undergo a process of cleansing, transformation, and modeling, culminating in a meticulously structured dataset that is perfectly suited for in-depth analysis.
The true value of Power BI lies in its unparalleled ability to convert complex datasets into visually captivating and interactive reports and dashboards. Through its intuitive and user-friendly interface, Power BI lets users effortlessly create compelling visualizations, such as dynamic charts, insightful graphs, informative maps, and comprehensive tables. By harnessing these powerful visual representations, key insights and emerging trends can be effectively communicated, thus enabling data-driven decision-making at every level of the organization.
What are the benefits of integrating BIM data with Power BI for enhanced project insights?
Integrating BIM data with Power BI brings numerous benefits that enhance project insights and improve overall project management. Here are some key advantages:
Comprehensive Data Analysis : By integrating BIM data with Power BI, project stakeholders gain access to a wealth of information from various sources, including architectural models, construction schedules, cost estimates, and asset management data.
Real-time Visibility : The integration enables real-time data updates and synchronization between BIM and Power BI.
Interactive Dashboards and Visualizations : Power BI’s powerful visualization capabilities empower users to create interactive dashboards and visualizations that bring data to life for the community.
Improved Collaboration and Communication : Integrating BIM data with Power BI promotes collaboration and communication among project team members community.
Data-driven Decision-making : The integration of BIM data with Power BI paired with advanced analytics and visualizations allow stakeholders to identify trends, patterns, and correlations within their data.
Enhanced Project Efficiency : By leveraging BIM data in Power BI, project efficiency is significantly enhanced. Stakeholders can identify bottlenecks, optimize resource allocation, and monitor project progress in real-time.
How does the SeveUp app facilitate seamless integration between BIM and Power BI?
The SeveUp app plays a vital role in facilitating the seamless integration of BIM data and Power BI by streamlining the process of leveraging BIM data for enhanced insights. Here’s how the app achieves this:
Automated Data Extraction : SeveUp automates the extraction of BIM data from various sources, eliminating the need for manual data retrieval.
Data Transformation and Modelling : Once the BIM data is extracted, SeveUp enables efficient data transformation and modeling to prepare it for analysis in Power BI.
Real-time Data Synchronization : SeveUp establishes a dynamic connection between BIM data sources and Power BI. This connection allows for real-time data synchronization, ensuring that the dashboards and reports in Power BI always reflect the latest updates from the BIM data sources.
Template Depository : SeveUp goes beyond data integration by providing a template depository feature. This feature allows users to deposit their customized templates on the platform, directly linked to their BIM data in real time.
One-click Publishing : SeveUp simplifies the process of publishing dashboards and reports to Power BI. With a single click, users can effortlessly publish their BIM data dashboards, making them instantly available to the project team and stakeholders.
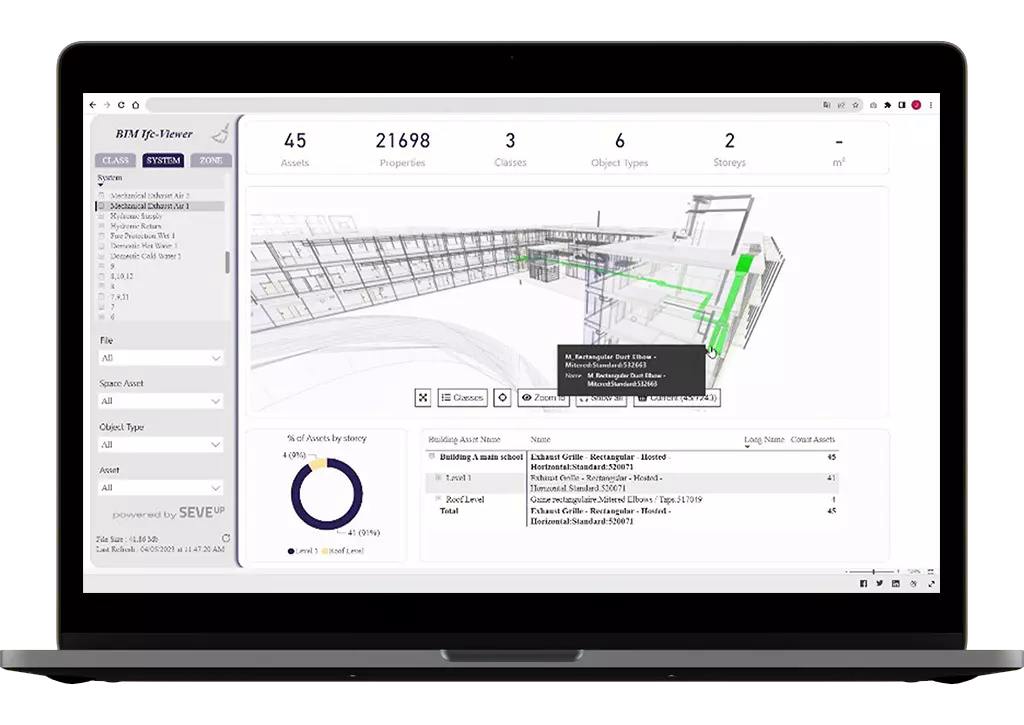
Unleashing the power of structured BIM data
Handling and analyzing extensive BIM data can be challenging, especially for big projects or multiple ongoing projects.
However, the integration of Power BI and SeveUp offers a solution that overcomes these obstacles and transforms structured BIM data into a valuable asset for informed decision-making.
BIM projects generate a vast amount of data from various sources, such as 3D models, cost estimates, construction schedules, and facilities management information. The sheer volume and complexity of this data make it challenging to effectively manage, analyze, and extract meaningful insights manually.
2. The value of structured data in decision-making:
Structured data provides a clear and organized representation of project information. When integrated with Power BI and processed using SeveUp, structured data becomes a valuable asset in driving informed decision-making.
Examples of data extracted and analyzed using Power BI and SeveUp:
Performance Metrics : Power BI and SeveUp can extract performance metrics from BIM data, such as construction progress, resource utilization, and quality assessments. These metrics can be visualized through interactive dashboards, allowing stakeholders to monitor project performance and identify areas for improvement.
Cost Analysis : BIM data integration with Power BI enables robust cost analysis by extracting data related to budget estimates, material quantities, and expenditures. This data can be analyzed to track project costs, identify cost-saving opportunities, and facilitate budget adjustments in real time.
Clash Detection and Coordination : Power BI, in conjunction with SeveUp, can analyze BIM data to identify clashes and coordination issues within 3D models. By visualizing clashes through interactive 3D representations, stakeholders can proactively resolve issues, minimize rework, and improve project coordination through the dashboard.
Facility Management Insights : BIM data includes valuable information for facilities management, such as equipment specifications, maintenance schedules, and energy usage.
Time and cost savings with Power BI and SeveUp
Power BI and SeveUp offer tangible time and cost savings for BIM projects. Through real-time data visualizations, proactive decision-making, and efficient resource allocation, these tools revolutionize project management. Let’s explore the specific ways in which this integration delivers time and cost savings:
Real-time Data Visualizations and Dashboards : Power BI and SeveUp enable the creation of dynamic and interactive dashboards that provide real-time insights into project performance. Instead of spending hours manually compiling and analyzing data, stakeholders can access visualizations that automatically update with the latest information.
Proactive Decision-making : The integration of Power BI and SeveUp empowers stakeholders to make proactive decisions based on real-time data. By visualizing key project metrics, performance indicators, and trends, decision-makers can identify potential issues early on and take corrective actions promptly.
Efficient Resource Allocation : Power BI and SeveUp facilitate efficient resource allocation by providing comprehensive visibility into project data.
Implementation and Best Practices
Integrating SeveUp’s BIM data with Power BI can be a game changer for your project insights. To ensure successful implementation, follow these step-by-step instructions and leverage best practices for optimized data analysis and visualization:
Install SeveUp : Begin by installing the SeveUp app on your system. Follow the provided instructions for installation and setup.
Connect Data Sources : Launch SeveUp and connect your BIM data sources. SeveUp will extract the relevant data automatically.
Data Transformation and Modelling : Use SeveUp to transform and model the extracted data, ensuring it aligns with Power BI requirements. Cleanse it, remove duplicates, and format it appropriately.d format it appropriately.
Publish Data to Power BI : Once the data is prepared, publish it to Power BI directly from SeveUp. Ensure that you have a Power BI account and the necessary permissions to publish it.
Design Dashboards and Visualizations : In Power BI, create interactive dashboards and visualizations to showcase your BIM data insights. Utilize Power BI’s rich set of visual elements, including charts, graphs, and maps, to represent your data effectively.
Set Up Real-time Synchronization : Use SeveUp to establish real-time synchronization between your BIM data sources and Power BI. This ensures that your dashboards and reports reflect the most up-to-date information.
Share and Collaborate : Share your Power BI dashboards with relevant stakeholders for collaboration and decision-making. Utilize Power BI’s sharing features to grant appropriate access levels and permissions.
Tips for optimized data analysis and visualization in Power BI:
Define Key Metrics : Identify the key metrics and performance indicators that align with your project objectives. Focus on actionable insights that drive decision-making and improve project outcomes.
Utilize Filters and Slicers : Implement filters and slicers in your Power BI dashboards to allow users to interactively explore the data. This empowers stakeholders to drill down into specific aspects and gain deeper insights.
Leverage Custom Visuals : Explore Power BI’s marketplace for custom visuals that can enhance your data analysis and visualization. Custom visuals provide additional ways to present complex information and engage users.
Consider Data Refresh Schedules : Determine the appropriate data refresh schedules based on the frequency of updates in your BIM data sources. Balance the need for real-time insights with the system resources required for frequent data refreshes.
Potential Challenges and Considerations :
Data Compatibility : Ensure that your BIM data sources are compatible with SeveUp and Power BI to facilitate seamless integration. Verify the data formats, supported file types, and compatibility requirements of both platforms.
Data Quality and Consistency : Address data quality issues, such as missing or inaccurate data, before integrating with Power BI. Inconsistent data across sources can impact the accuracy and reliability of insights.
User Training and Adoption : Invest in user training to maximize the benefits of the integration. Familiarize stakeholders with the functionalities of SeveUp and Power BI to encourage adoption and utilization of the tools.
Data Security and Access Control : Implement appropriate security measures to protect your BIM data and ensure that access to Power BI dashboards is granted to authorized individuals only. Consider data governance policies and comply with industry standards and regulations.
Use SeveUp App and Power BI to save time and money
The integration of SeveUp and Power BI creates a multitude of benefits for BIM projects and revolutionizes the way data is analyzed and visualized. This powerful combination empowers project stakeholders to unlock the true potential of their BIM data, resulting in enhanced project outcomes, time savings, and cost efficiencies.
SeveUp simplifies the integration process by seamlessly connecting BIM data with Power BI. It offers automated data extraction, transformation, and real-time synchronization, eliminating the need for manual data handling.
Through this seamless integration, dynamic dashboards and visualizations are created, providing stakeholders with real-time insights. Armed with accurate and up-to-date information, stakeholders can make proactive decisions with confidence.
SeveUp App Users Testimonials
SeveUp helped us to capitalize on the data contained in the BIM models by allowing us to transcribe BIM data in the form of KPIs. In accordance with the methods and business processes of our teams and our partners, we could deploy a BIM approach focused on value creation.
Anne Sophie Duroy Vermare
BIM Manager, Icade
I’m a BIM manager, and SeveUp lets me create dashboards tailored to my needs and those of my clients. They now have instant access to the information they need, knowing that their schedule and BIM requirements are being followed. It frees up more time to advise my clients and attracting more key Acoustic.
Maxime Sagnier
Head of operations, Im-Pact
We conducted proof of concept with SeveUp. Our goal was to regularly monitor and update our digital assets in response to the key needs of our asset managers and operators. Thanks to the SeveUp team’s support and expertise, we were able to quickly set up dashboards that let us visualize relevant indicators from our BIM data.