Trusted by companies
all over the world:
Firstly, begin by signing into your SeveUp App account. Subsequently, select the “Create Dashboard” feature to initiate the Power BI BIM dashboard creation automation.
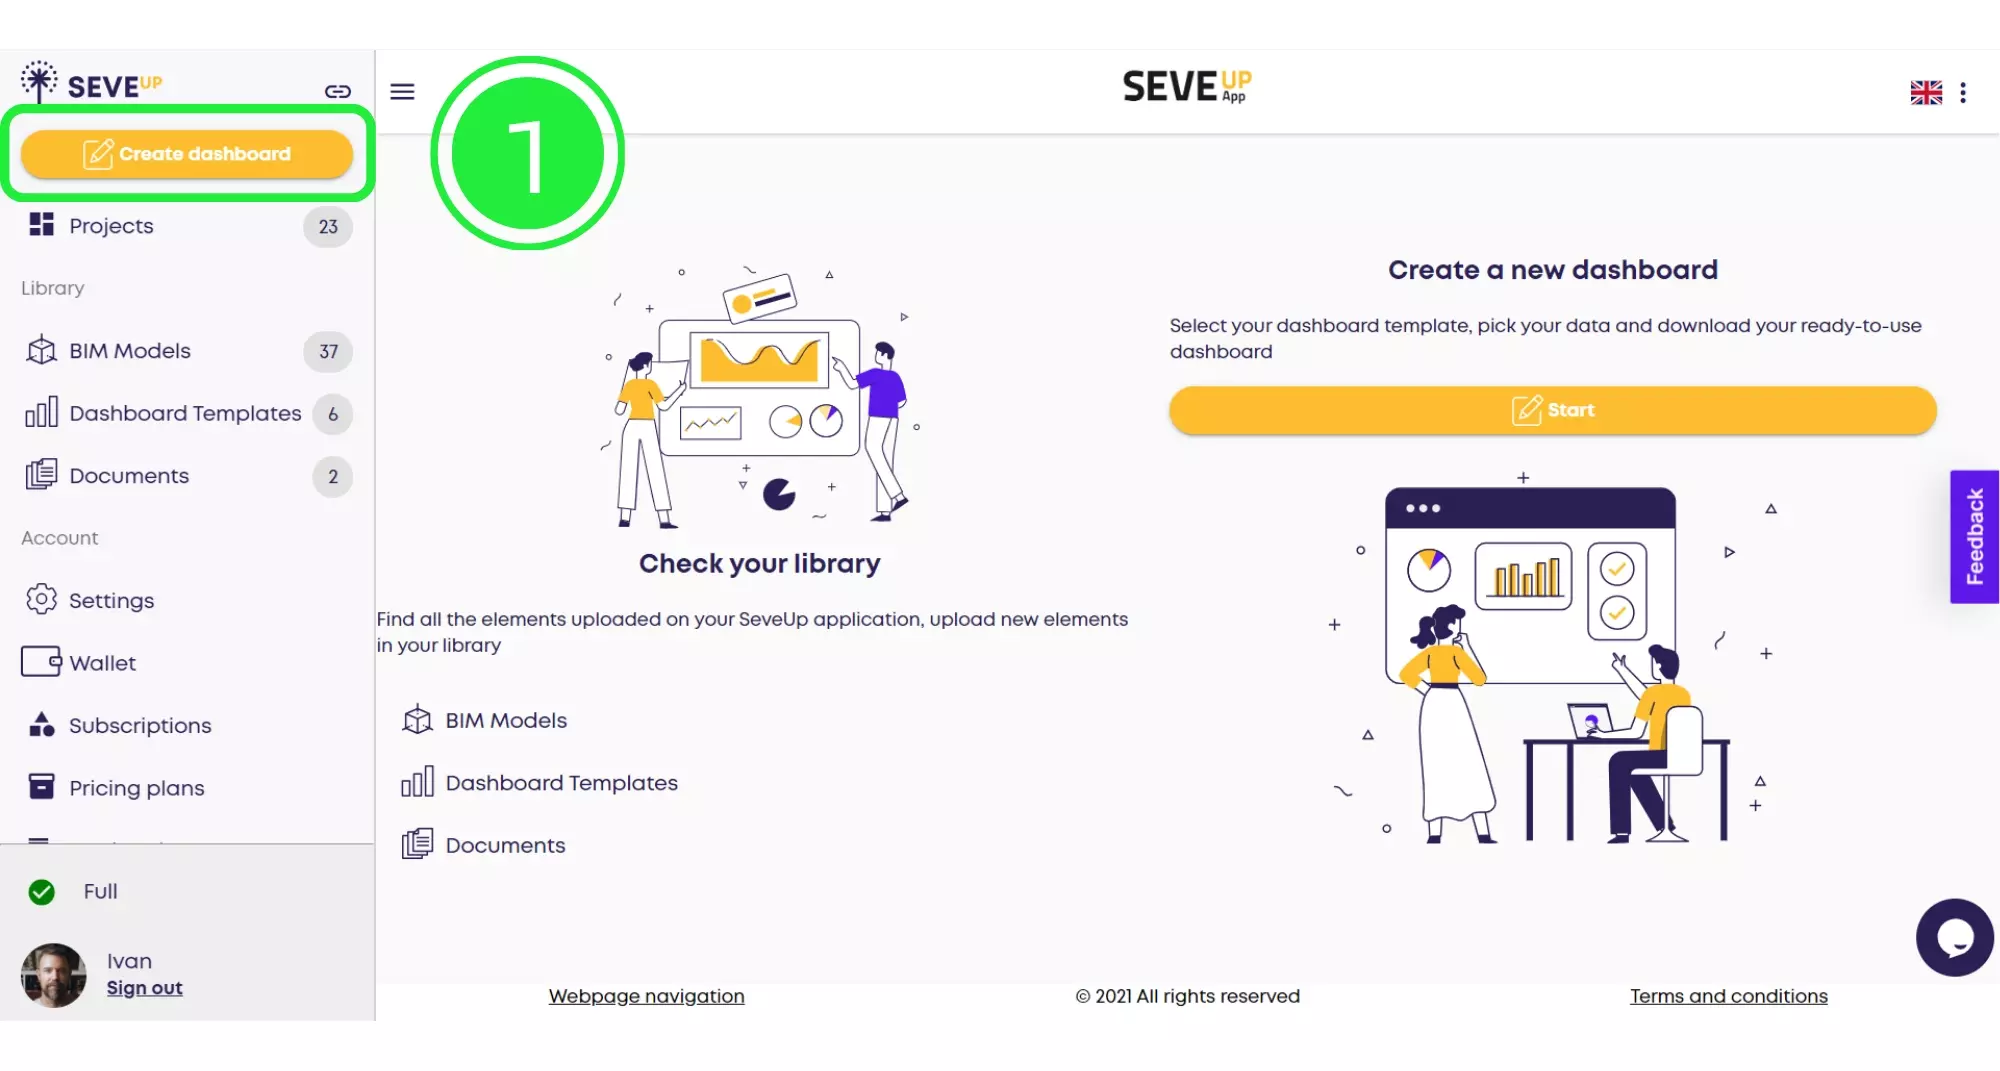
Next, locate and press the “Start” button within the tutorial page. This action engages the dashboard wizard, which is a crucial step for your new BIM Model Visualization.
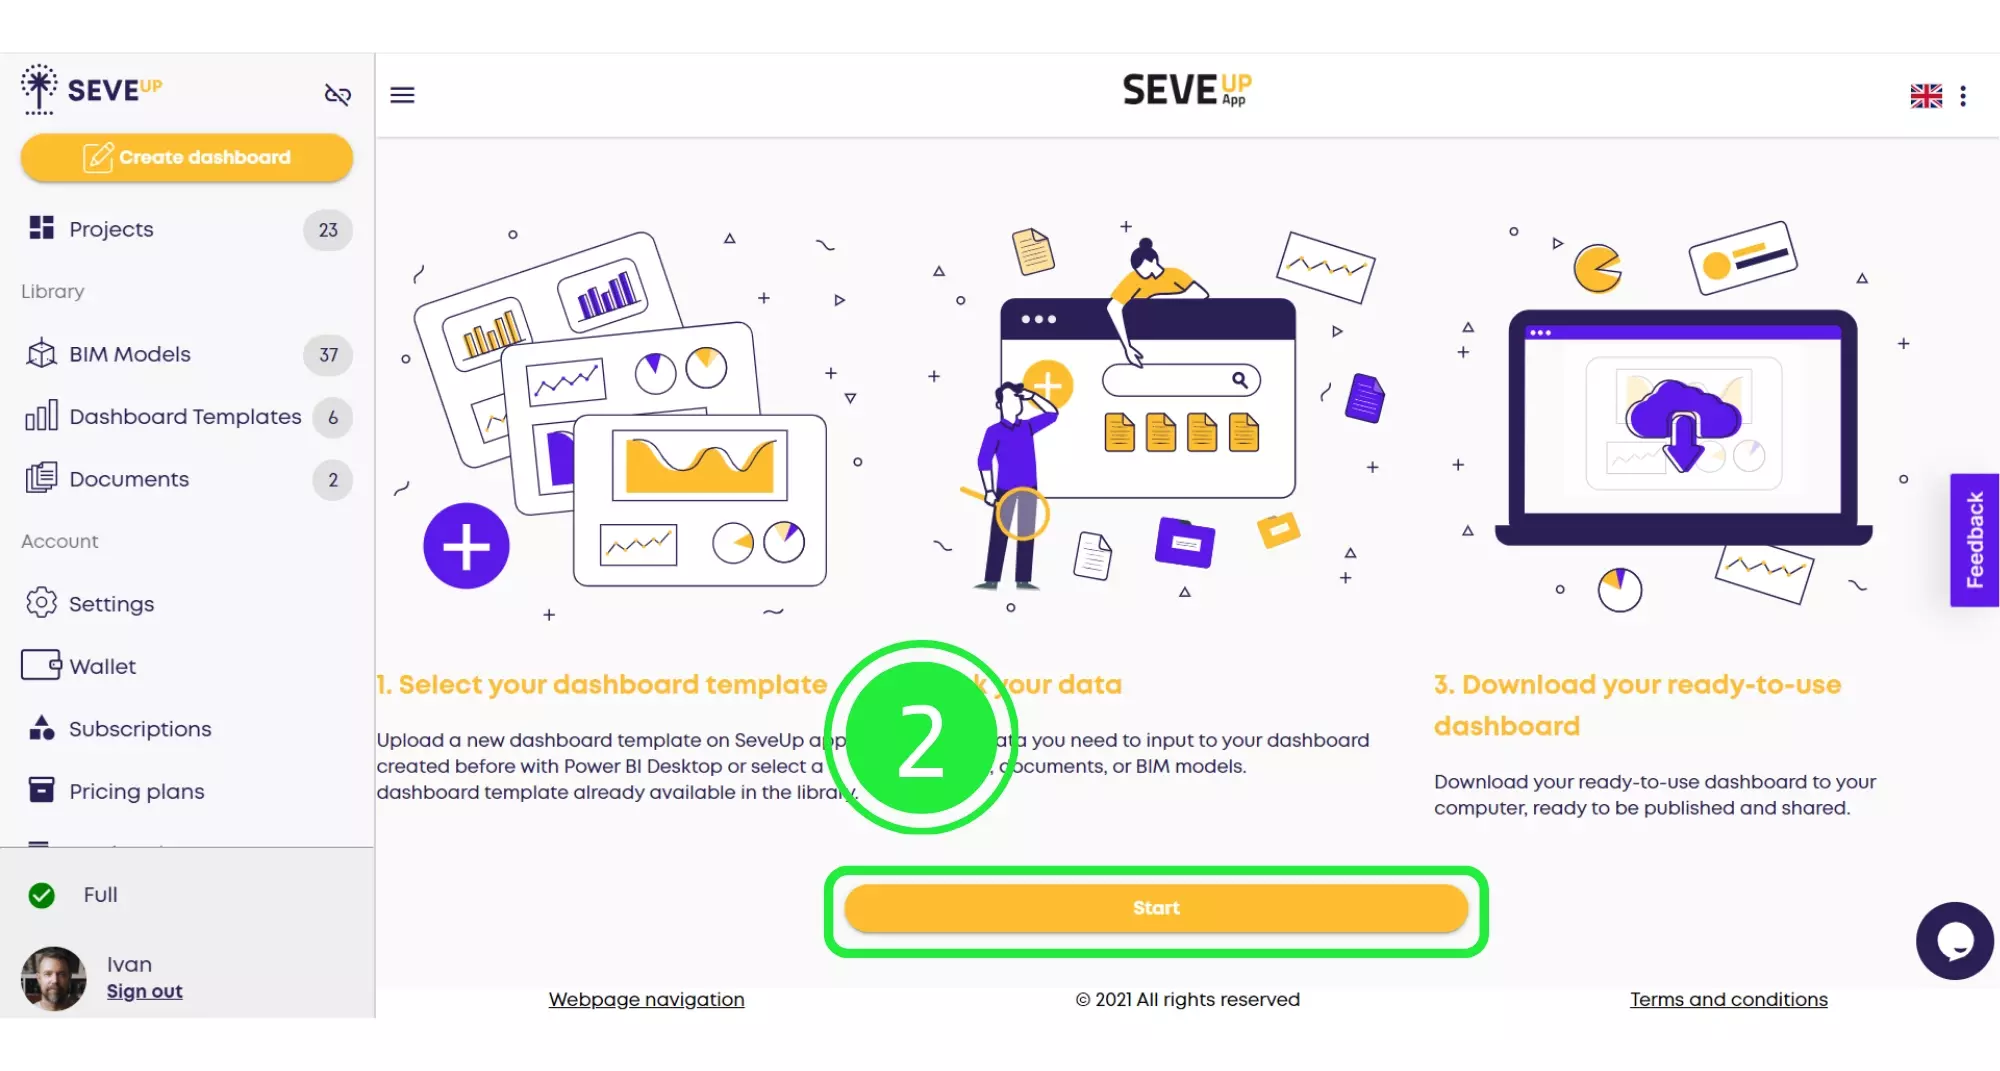
Furthermore, click on the “Select Project” to progress through the SeveUp App Integration steps in your dashboard setup, ensuring a seamless transition to the next phase.
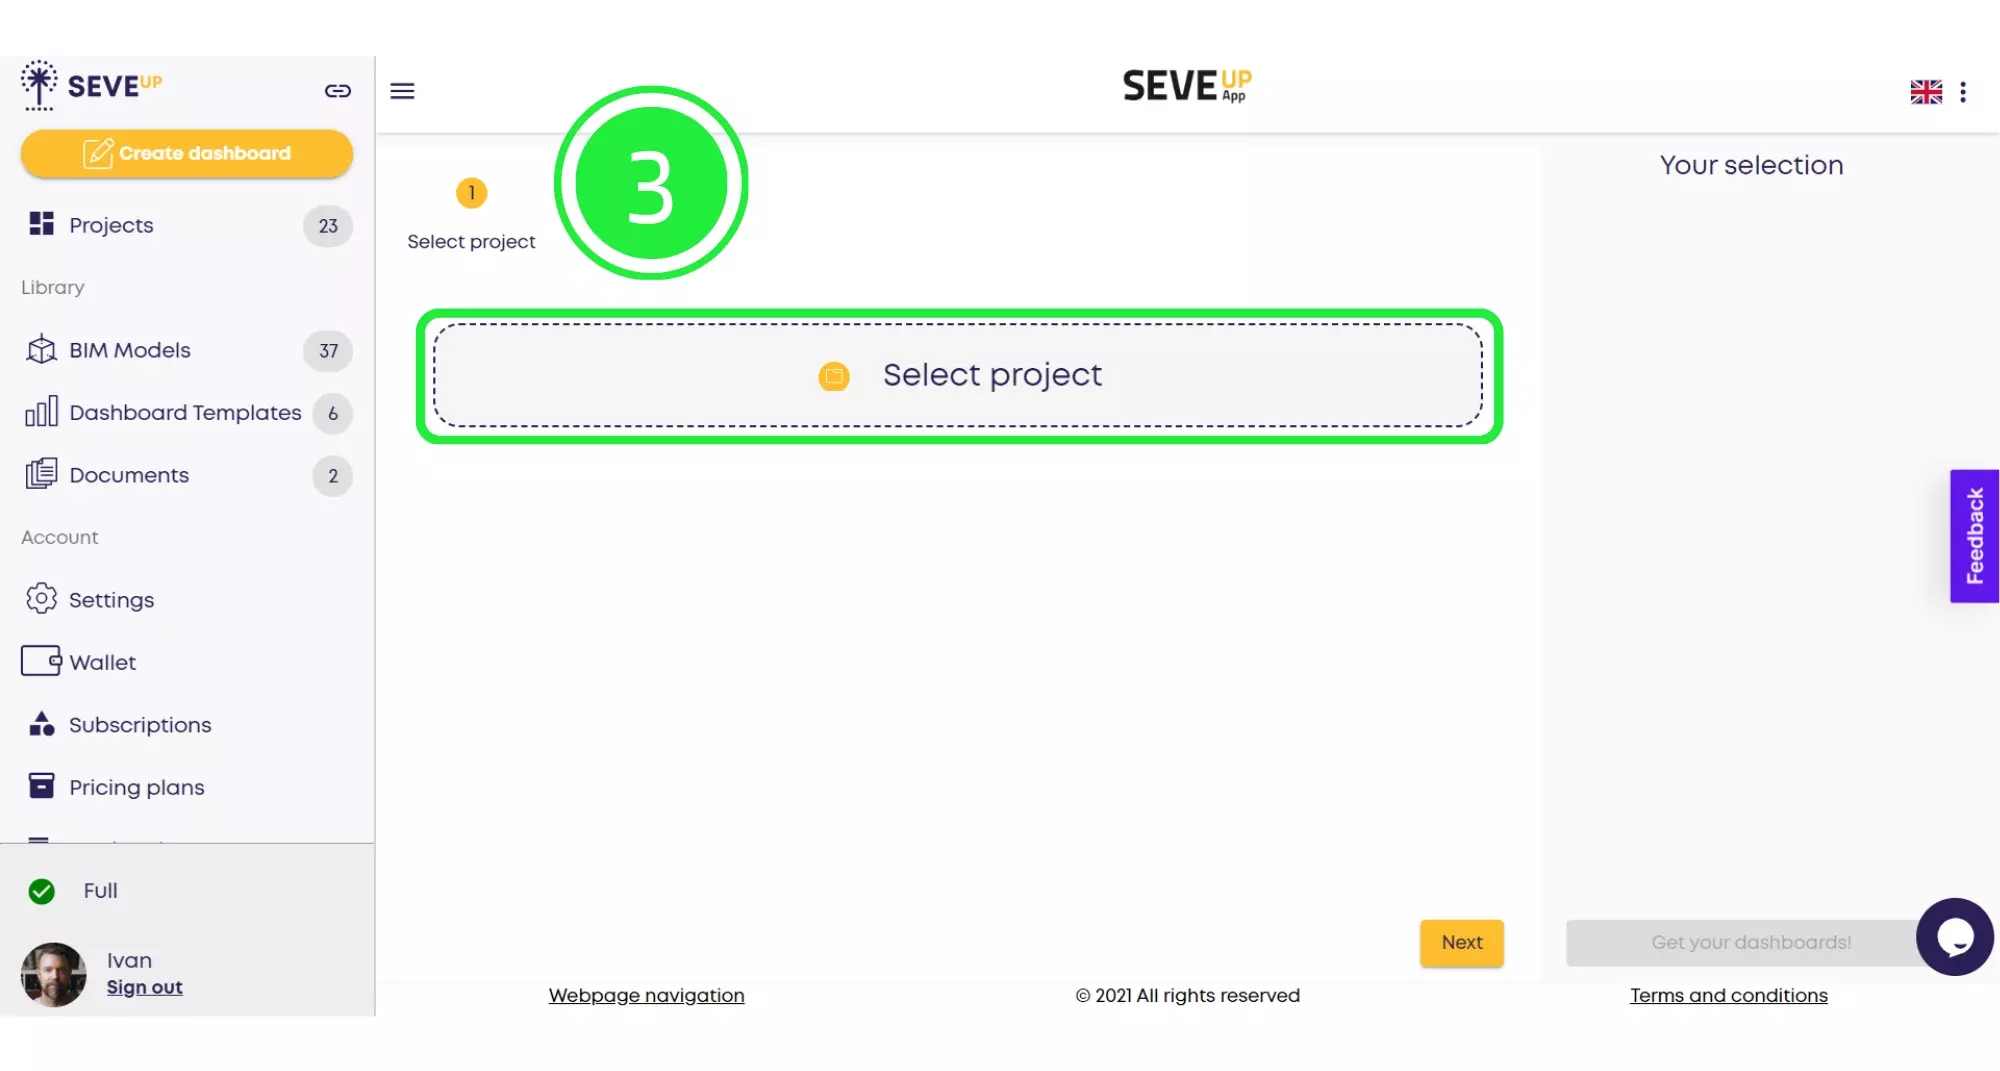
Moreover, through the popup, select “Select Existing Project”. This allows you to incorporate an existing project into your Dashboard Template Selection process, streamlining the setup.
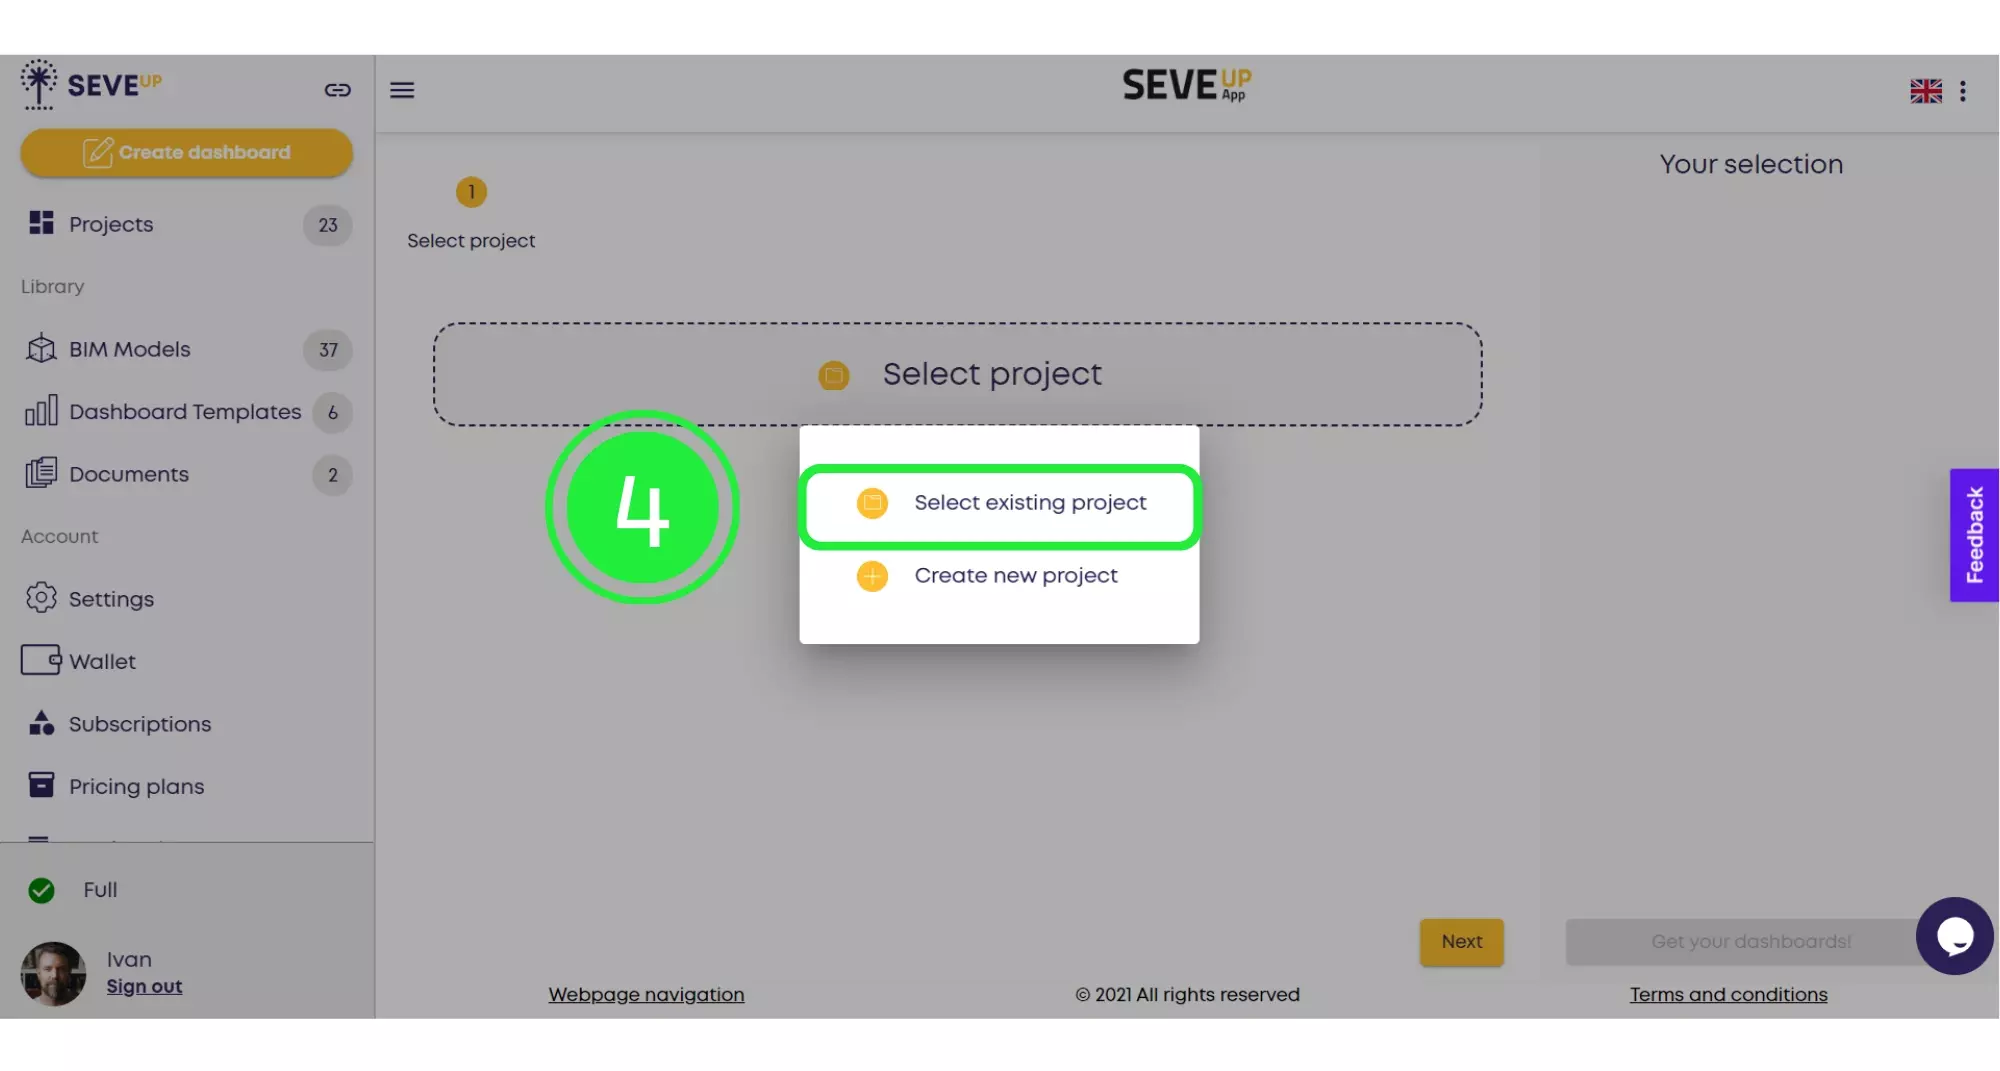
Additionally, highlight and confirm your project choice. This step is integral to the Project Management Automation within SeveUp’s dashboard creation, marking a pivotal moment in the setup.
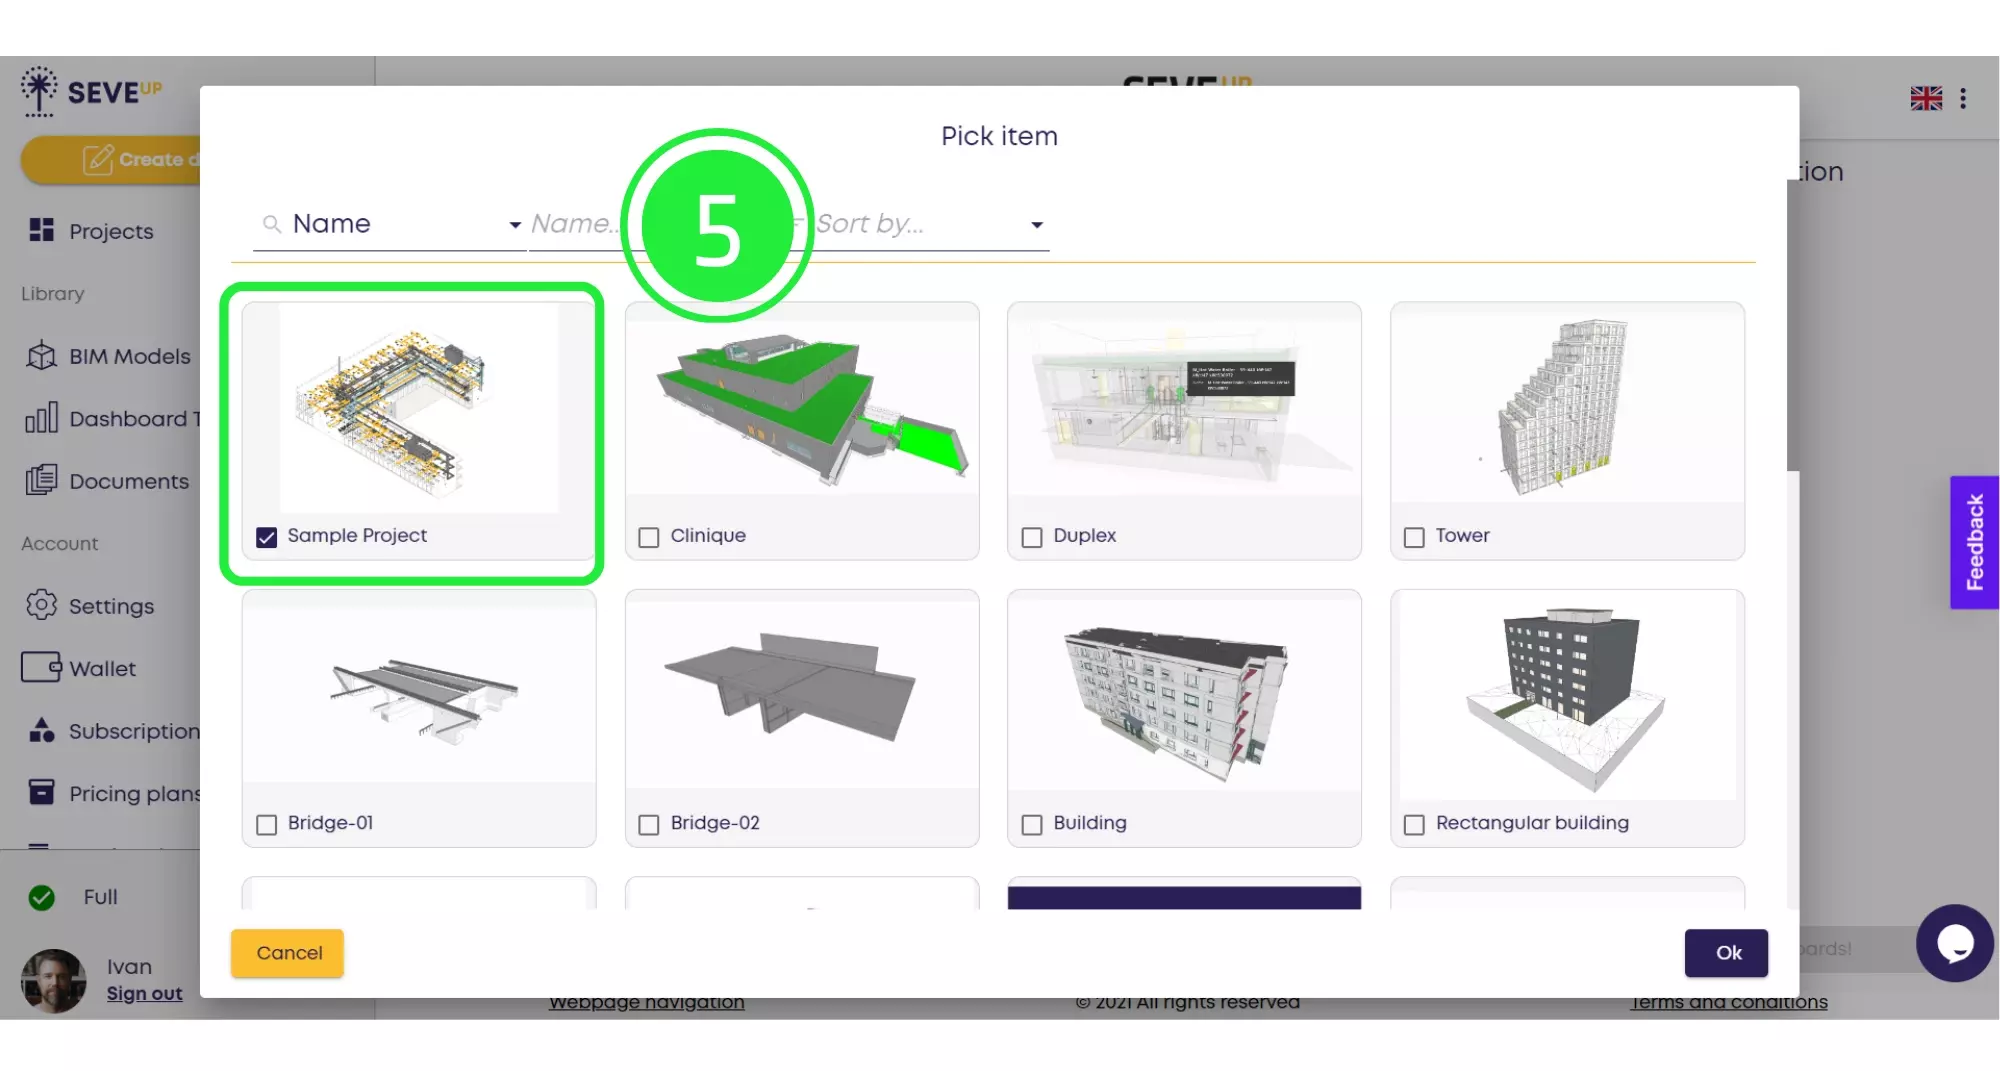
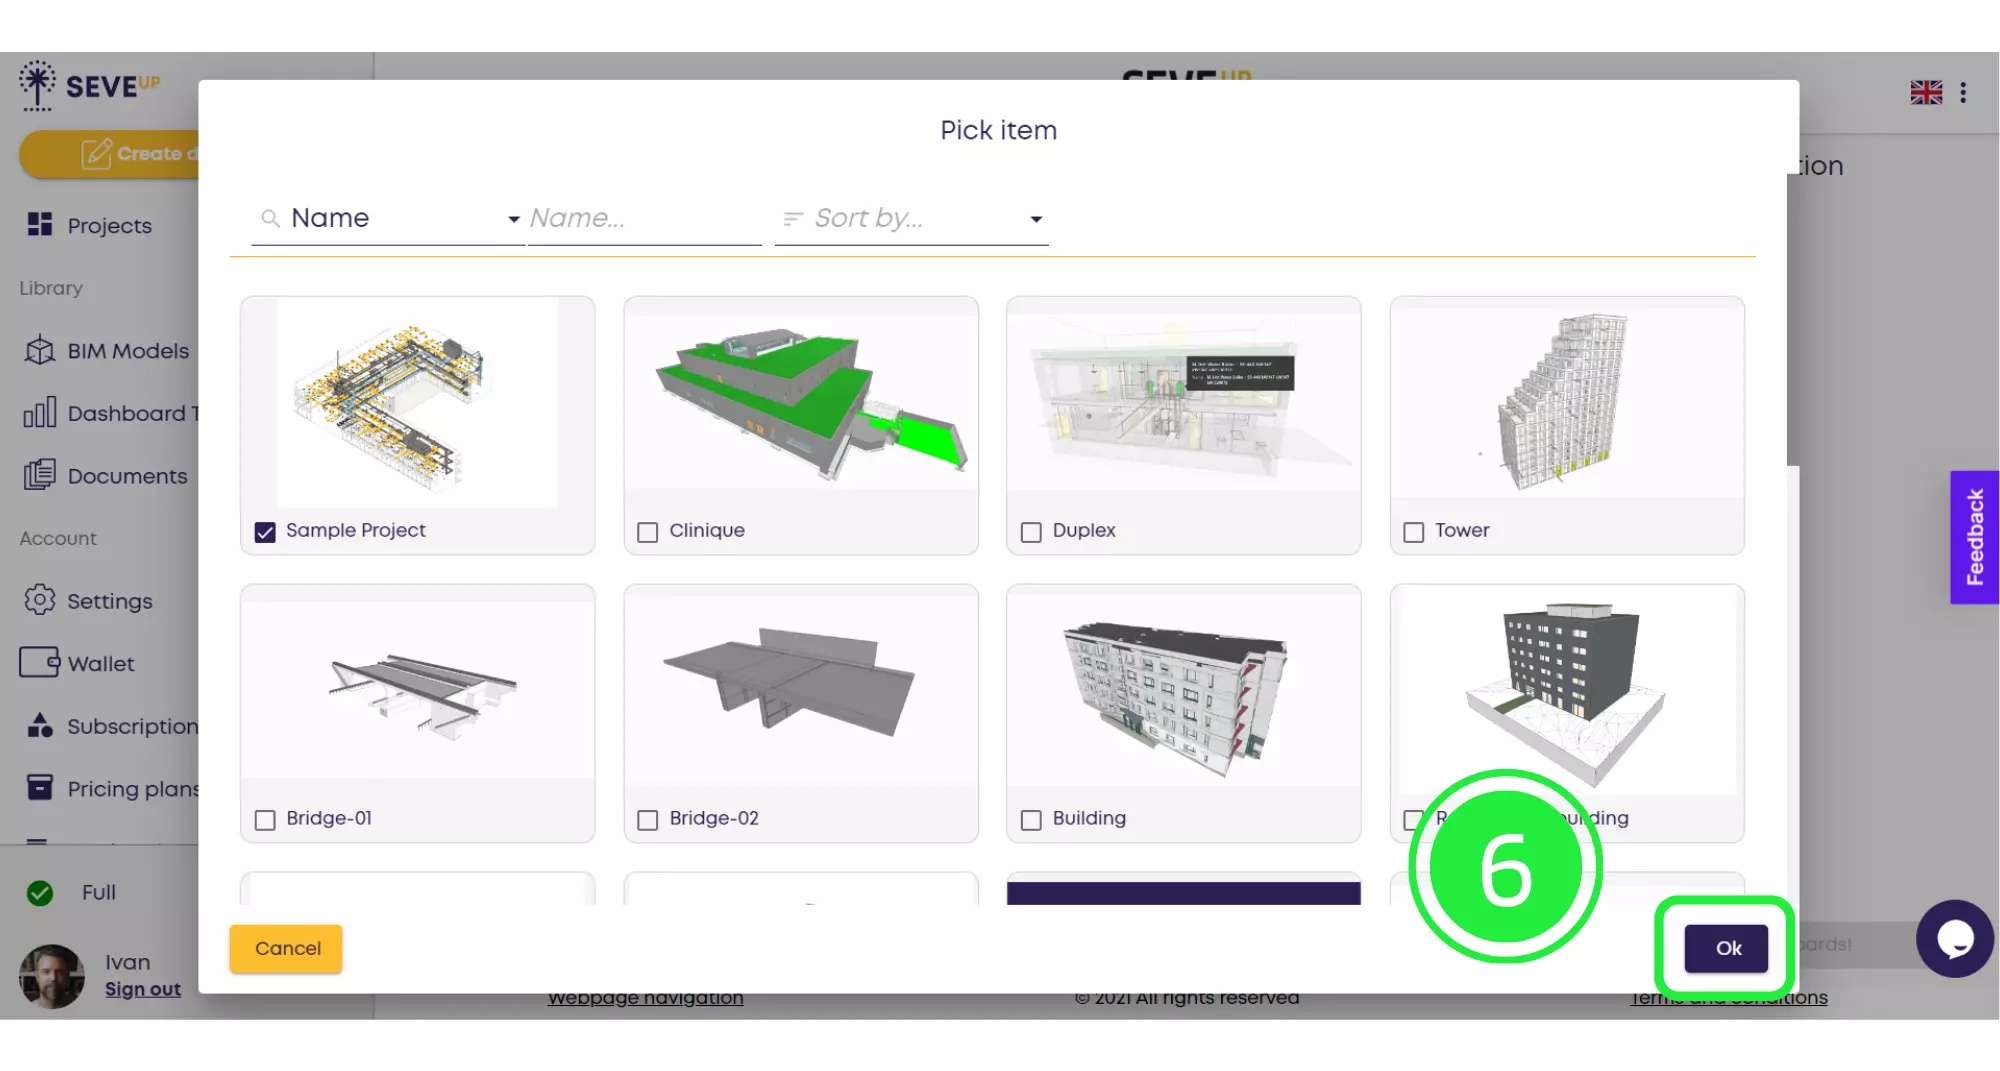
Then, click “OK” to finalize your project’s inclusion. This action is a cornerstone in the Data Visualization in Construction through the SeveUp dashboard, ensuring your project is correctly set up for visualization.
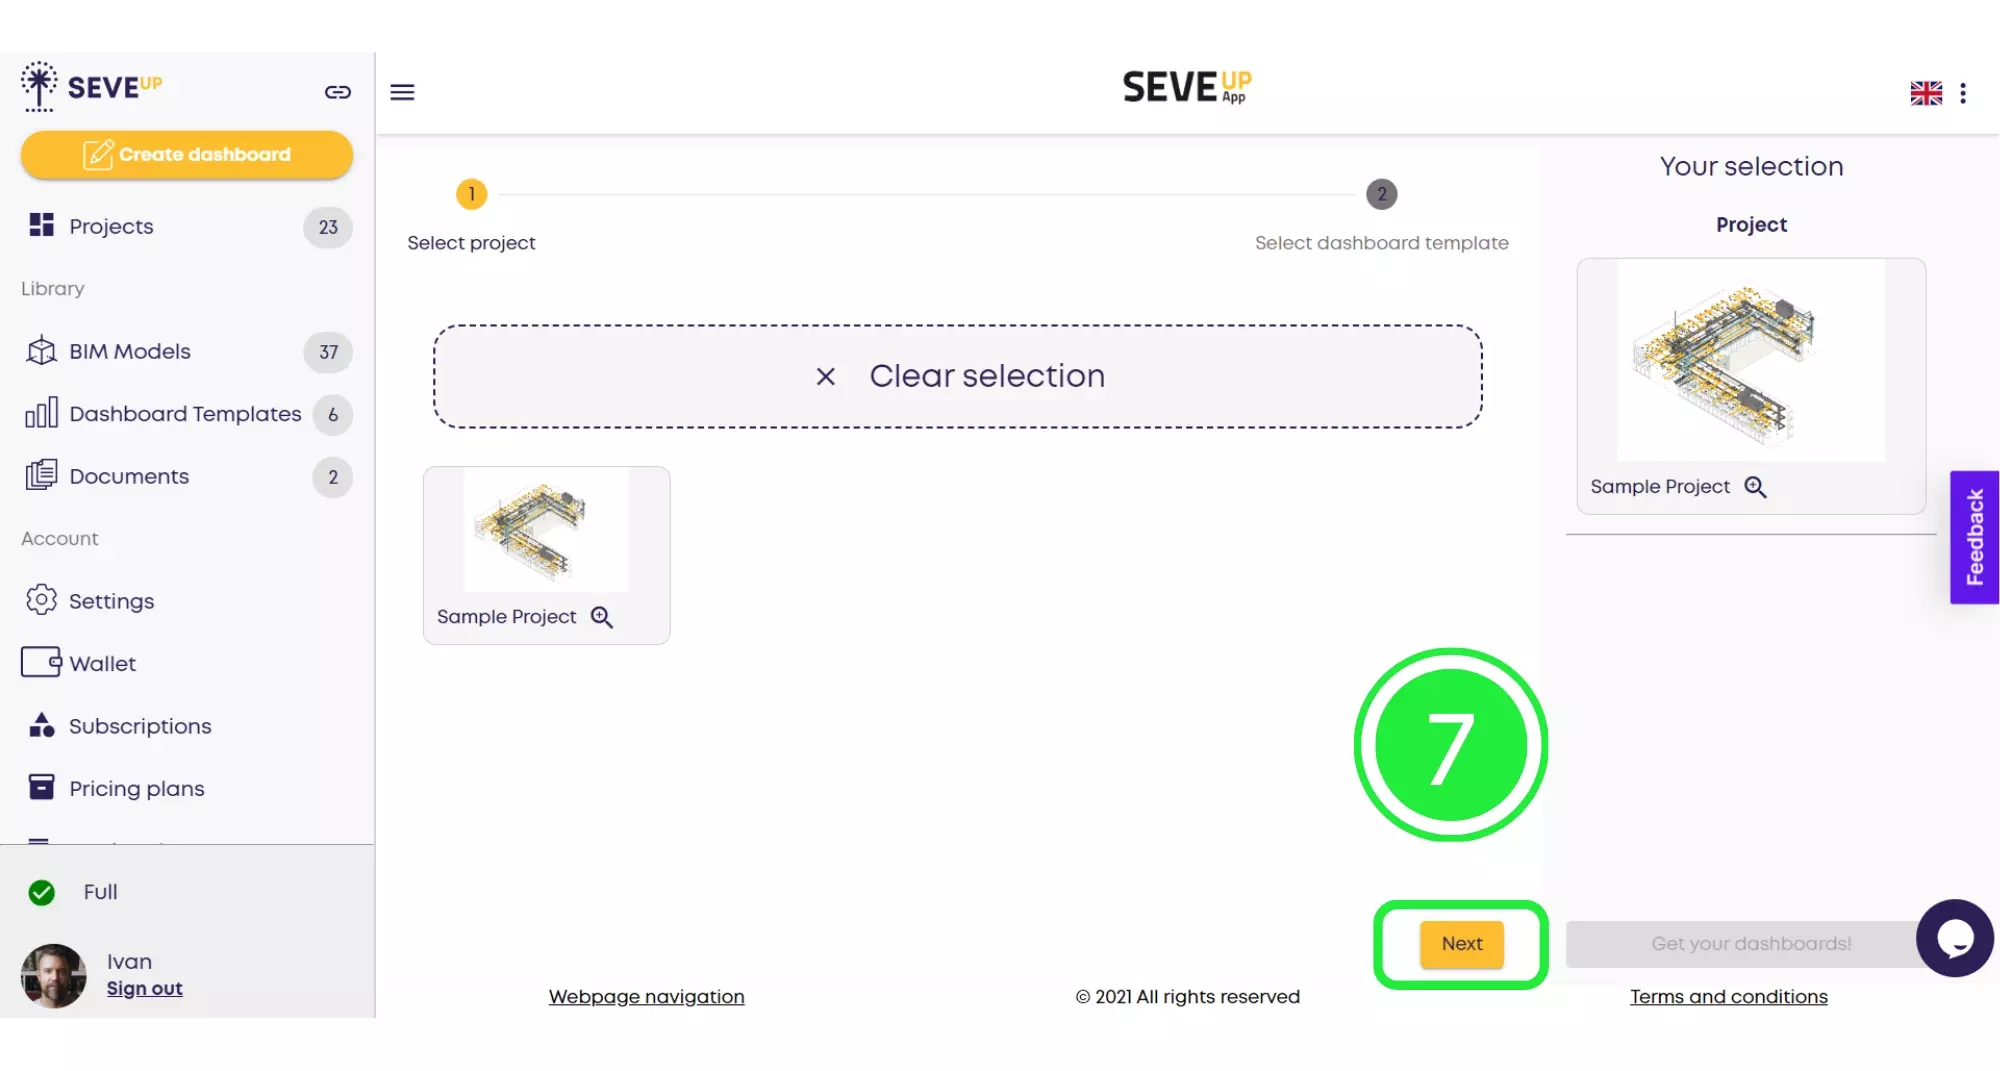
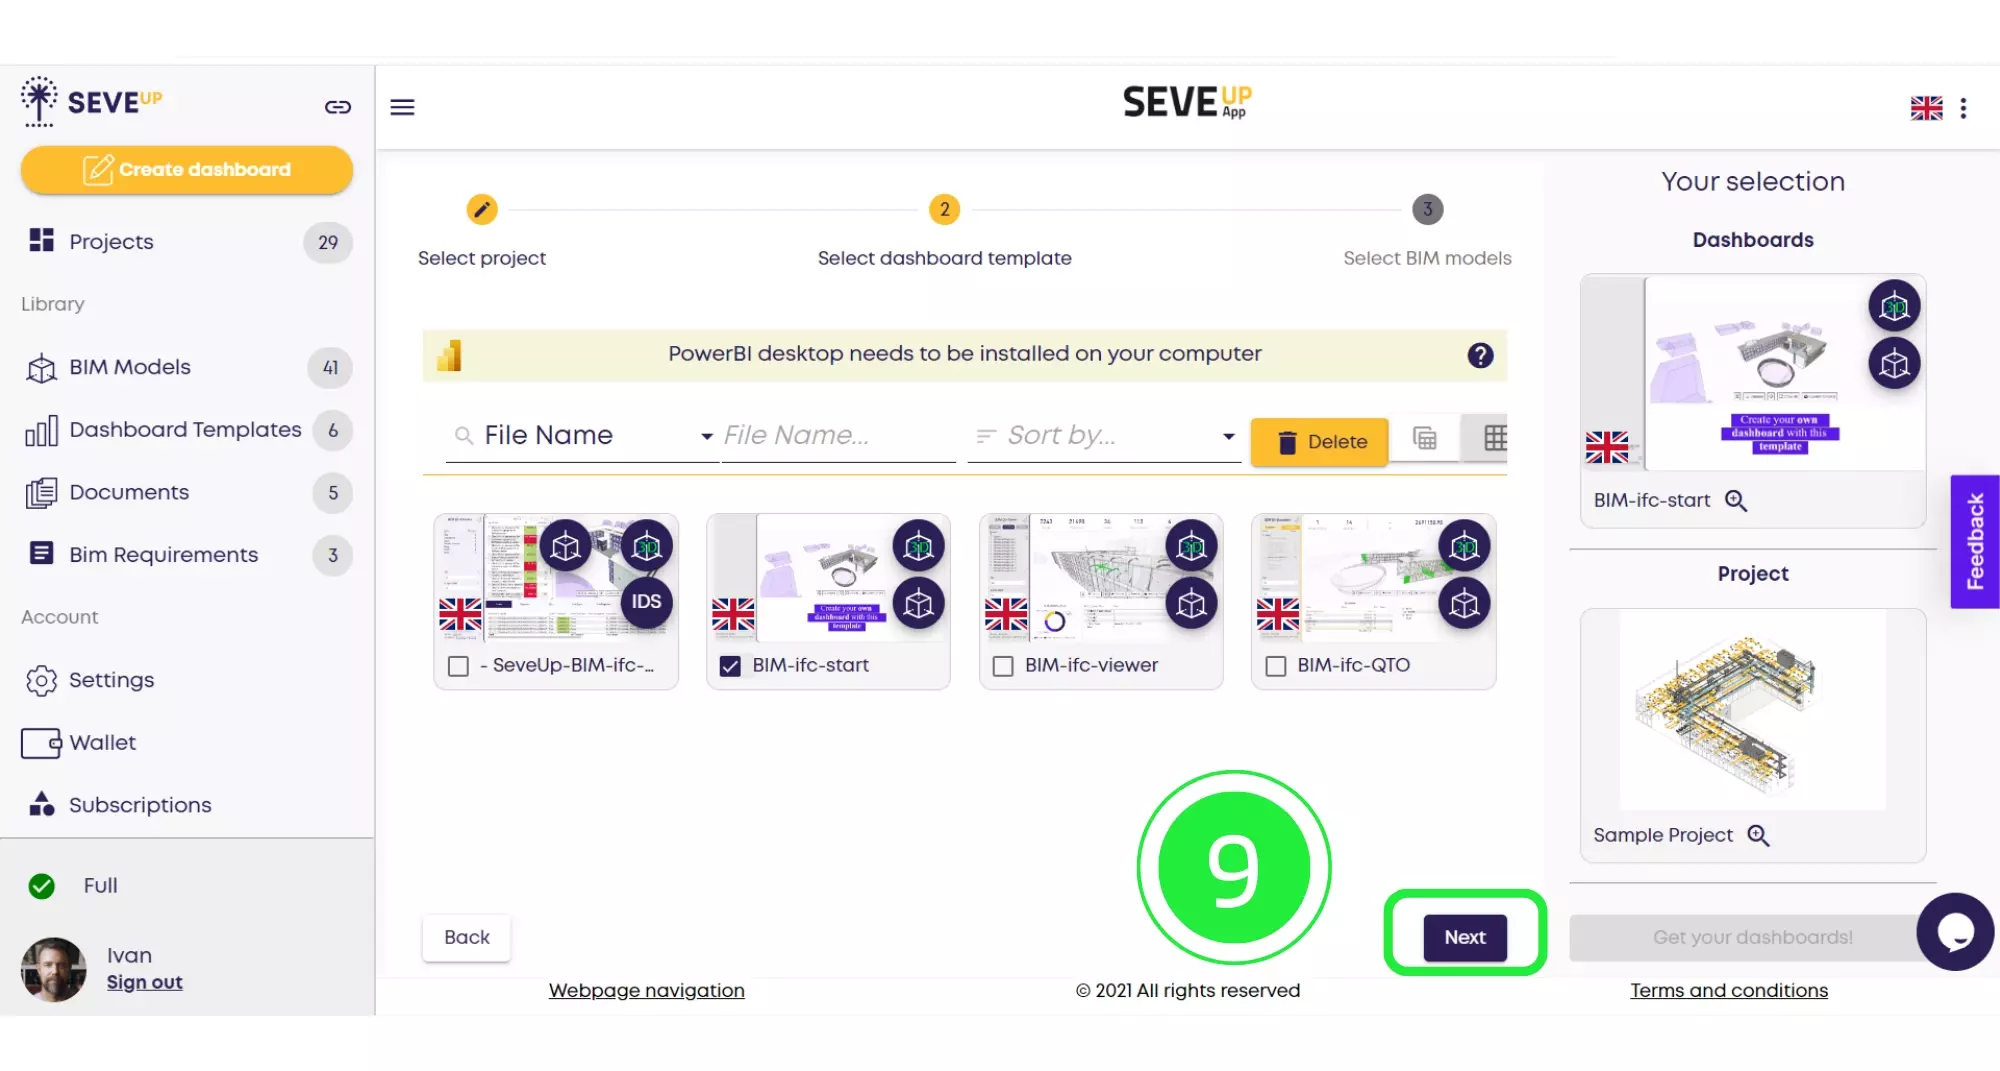
Subsequently, proceed by selecting “Next” to choose a suitable dashboard template. This step is crucial in aligning with your Dashboard Template Selection criteria, offering a range of visualization options.
Furthermore, select your dashboard template as part of the Power BI BIM dashboard creation automation. This choice showcases your project effectively, allowing for a customized presentation of data.
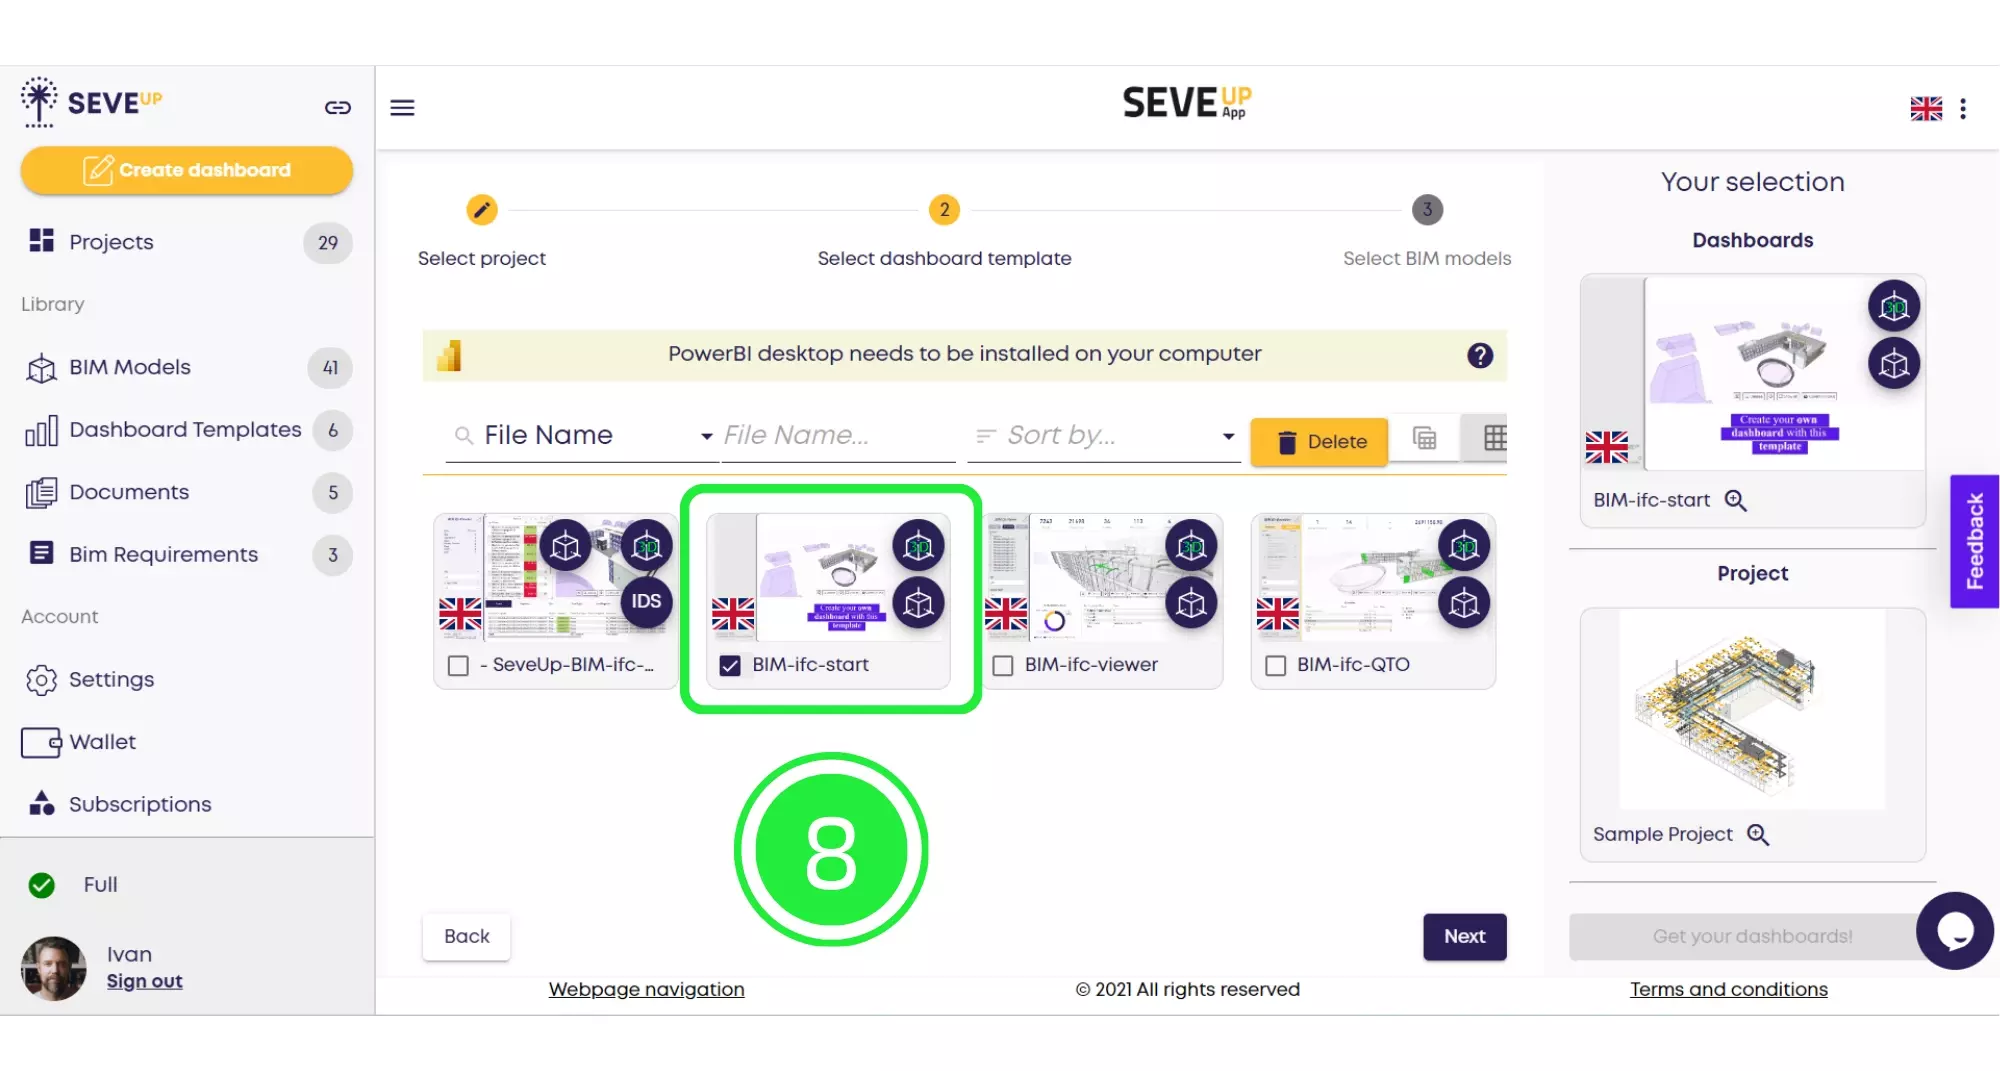
Additionally, click “Next” to proceed with your chosen template. This step is pivotal in BIM Model Visualization within your dashboard, ensuring your data is presented in the most impactful way.
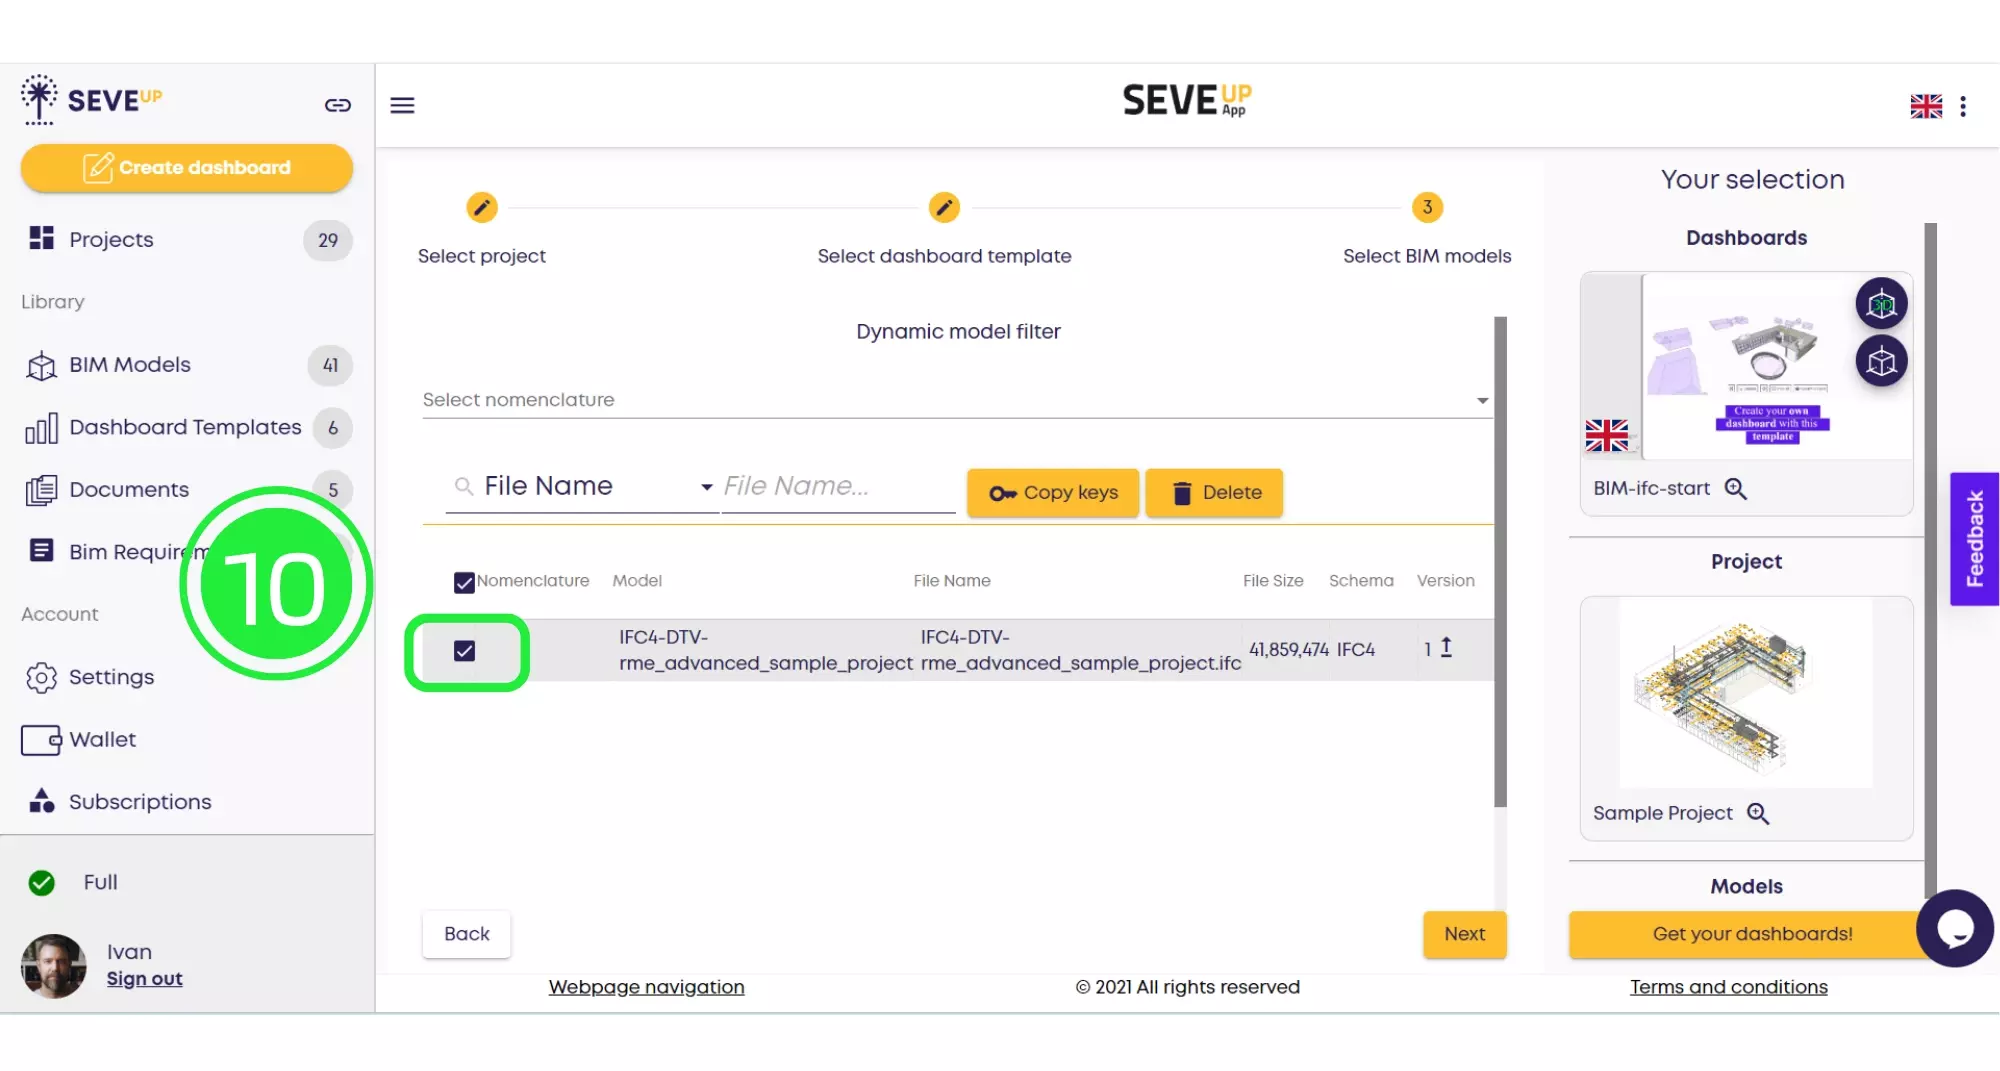
Moreover, highlight the BIM model for your dashboard. This emphasizes the BIM Model Visualization aspect of your project, ensuring the most relevant data is captured and displayed.
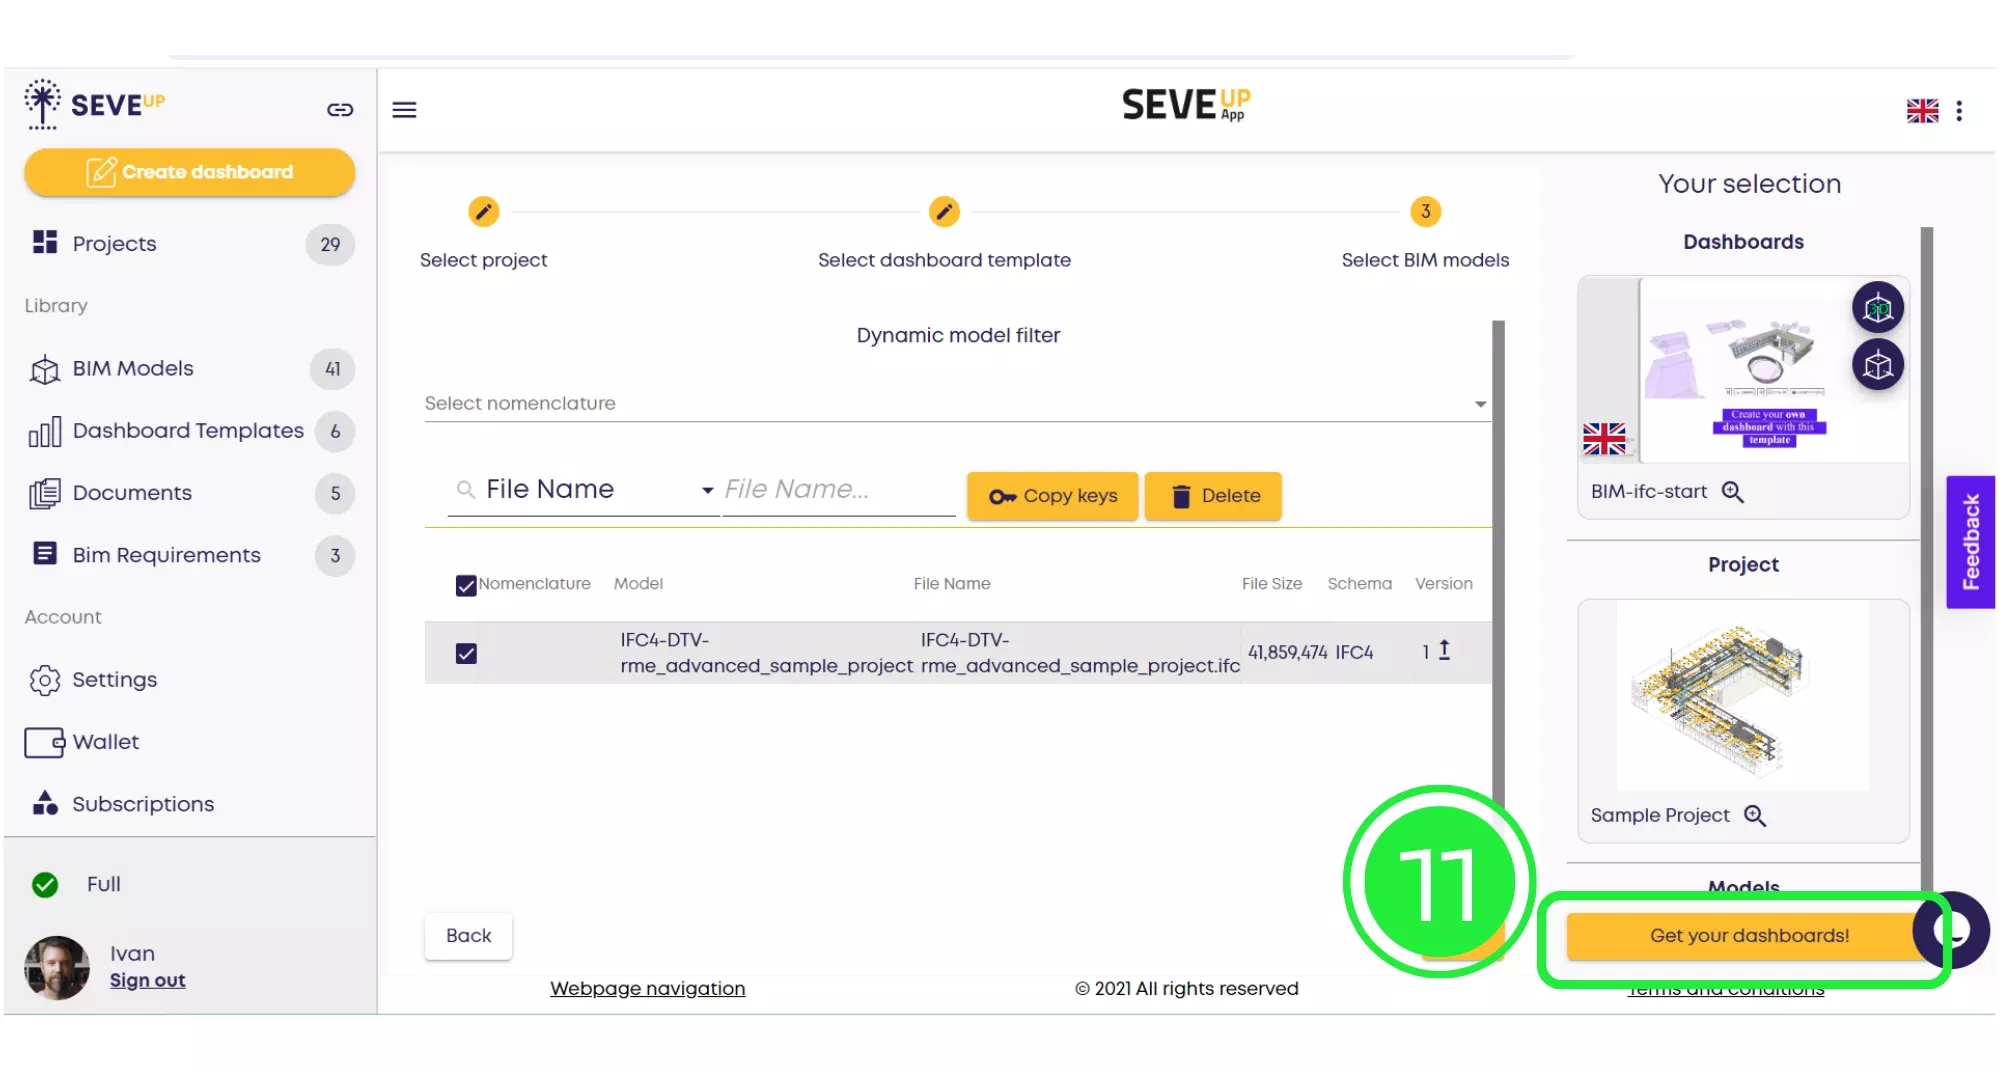
Finally, finalize the creation process by downloading your dashboard. This step is a testament to the efficiency of Power BI BIM dashboard creation automation, offering a quick and effective way to access your customized dashboard.
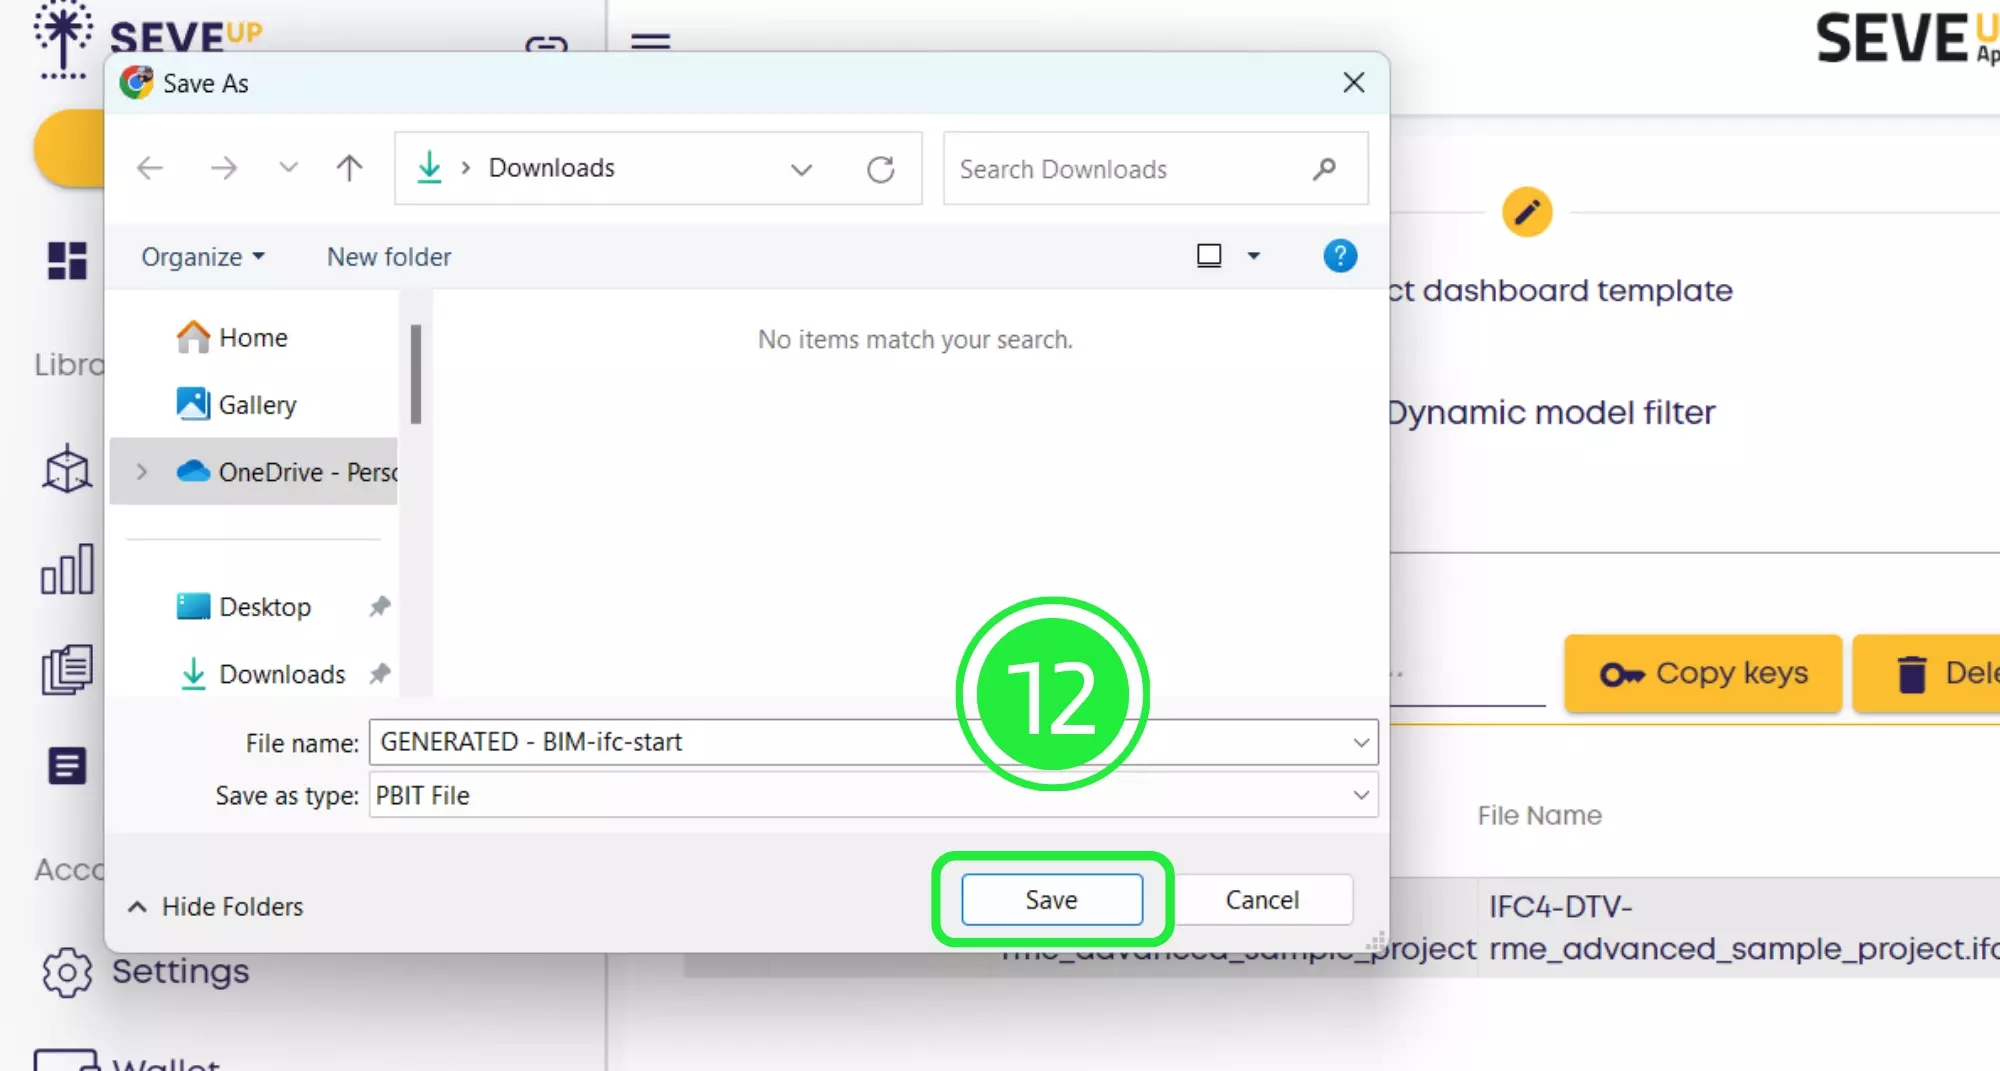
Lastly, ensure to save your project. This secures your progress in Data Visualization in Construction through Power BI, maintaining the integrity of your work and ensuring it can be accessed and modified in the future.
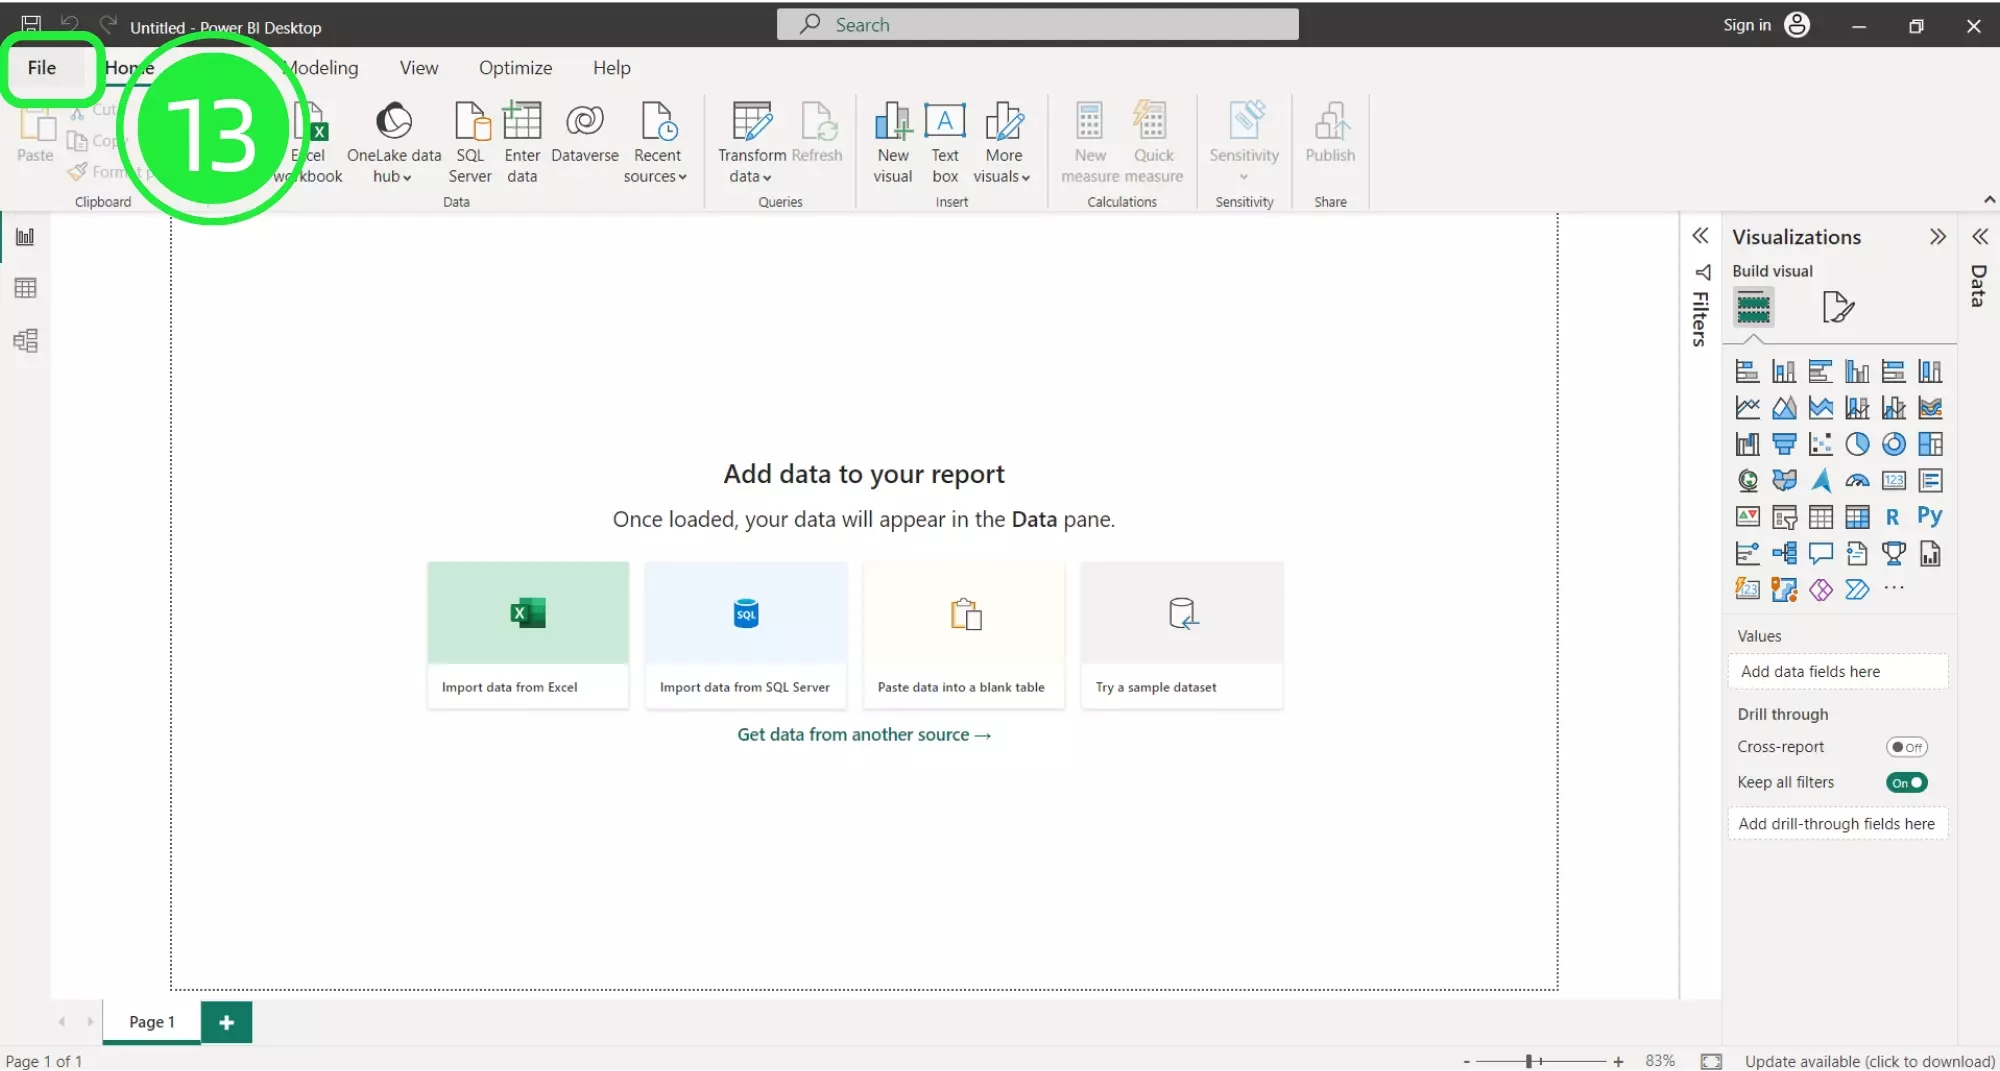
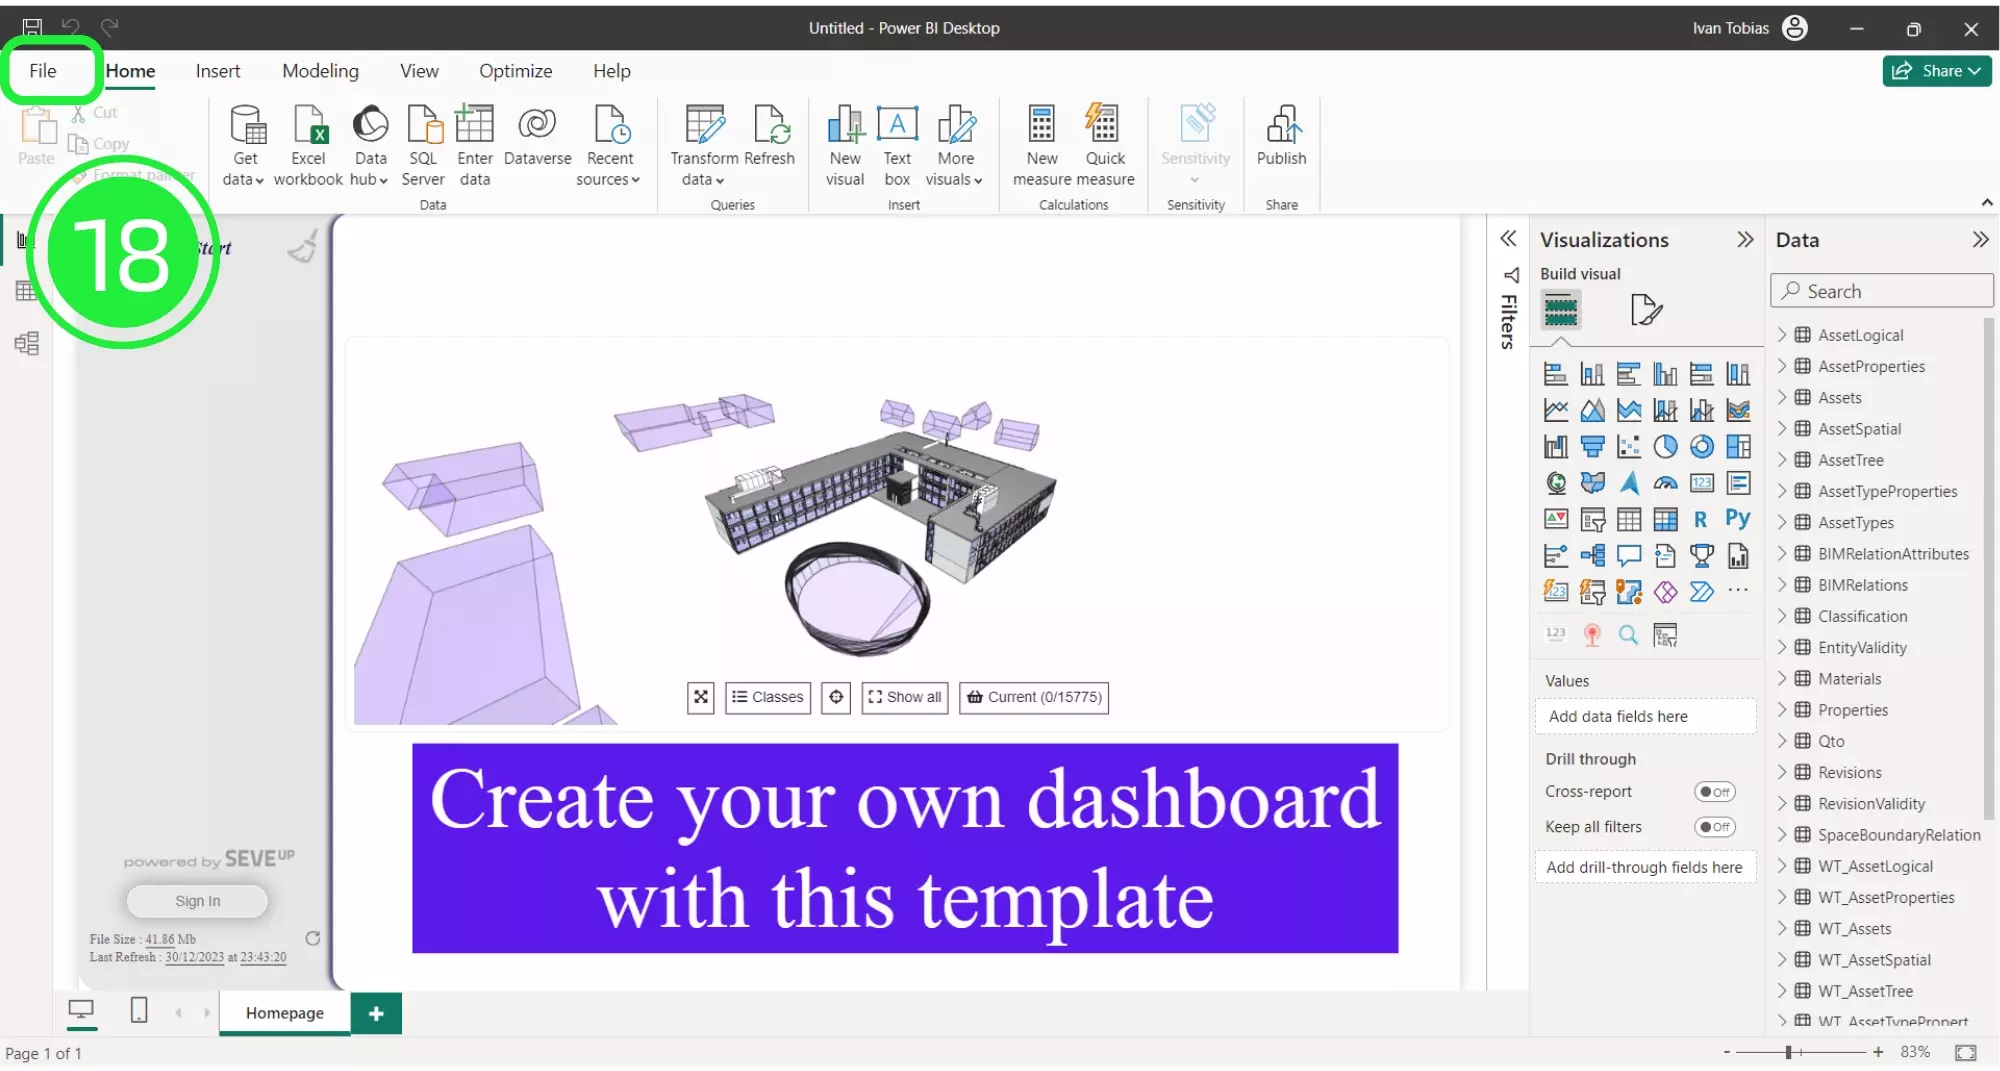
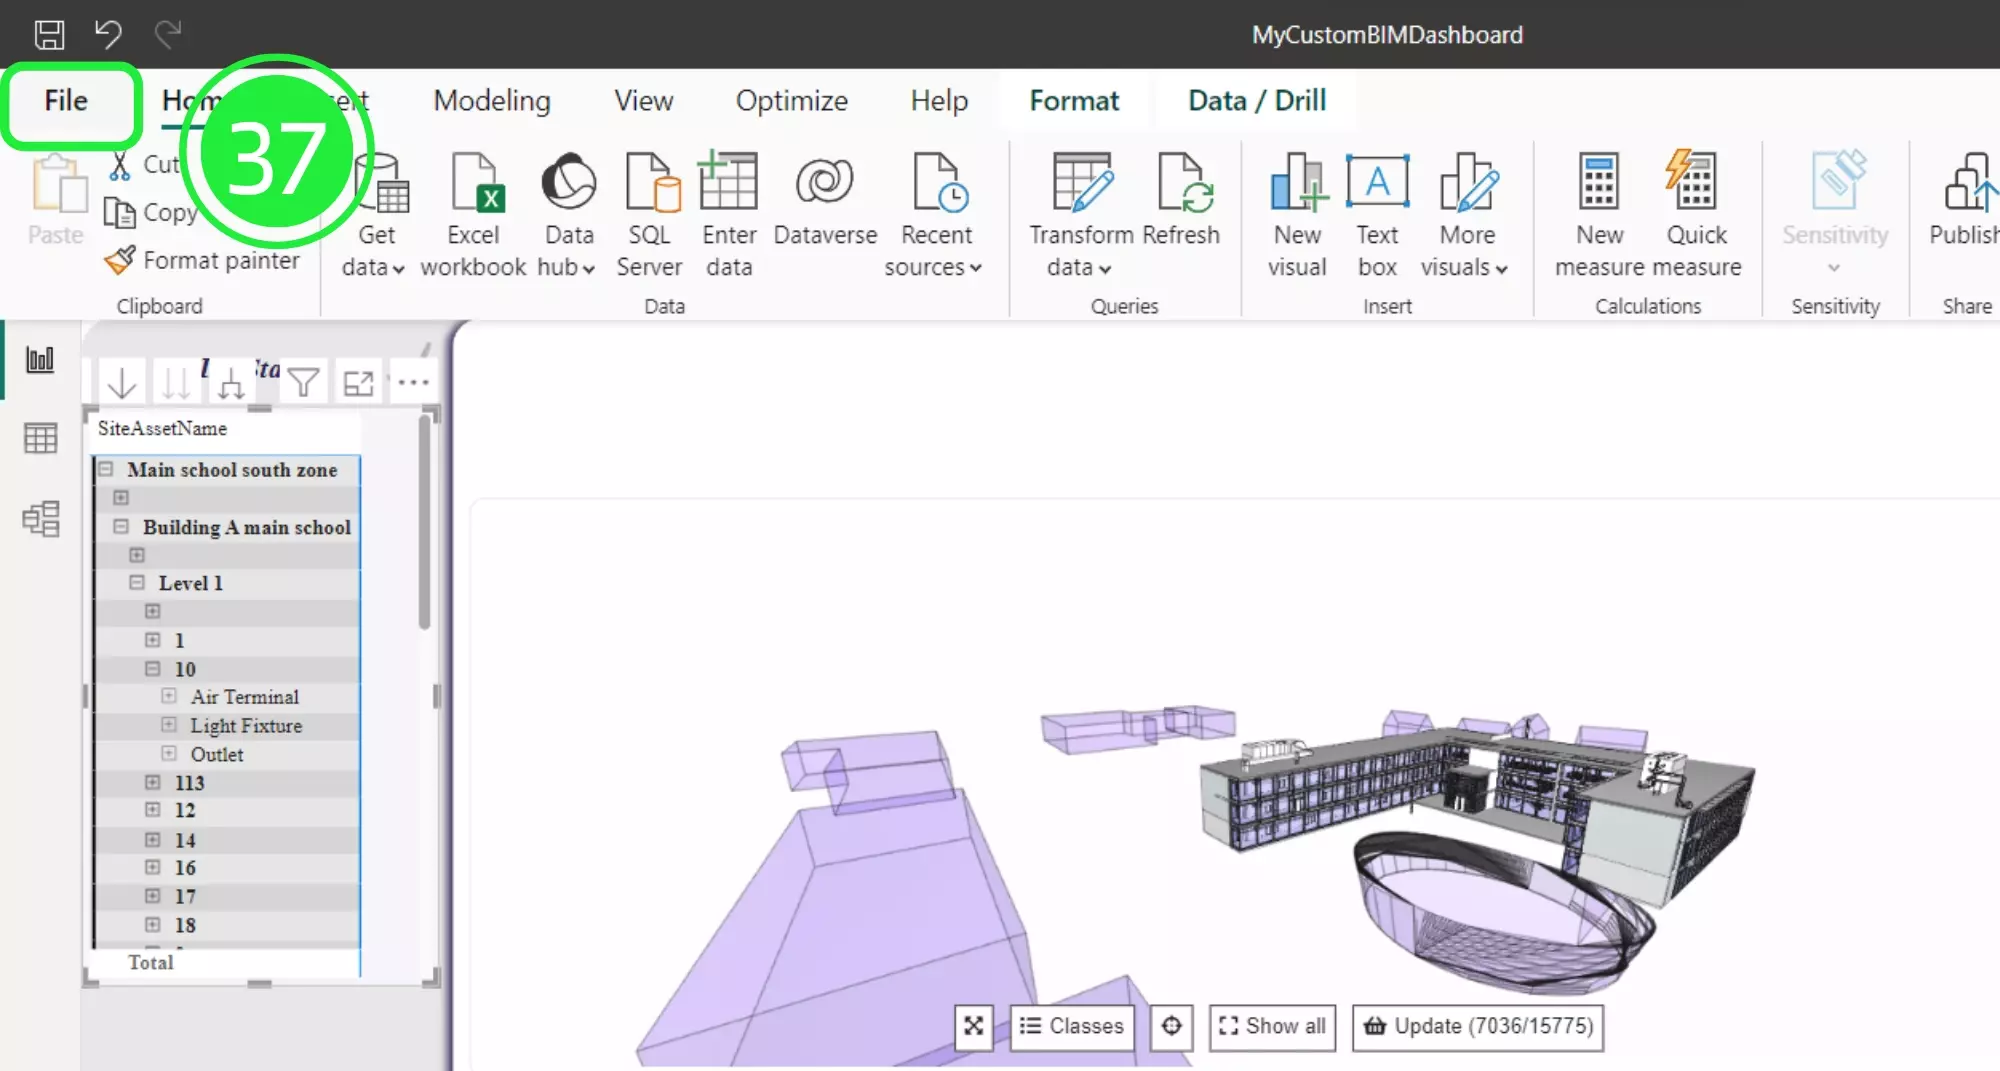
Start by opening up Microsoft Power BI and clicking on “File” located at the top left of the interface, setting the stage for importing your dashboard.
A menu will appear. Click on the “Browse this device” button at the bottom to search for your newly downloaded dashboard, facilitating the import process.

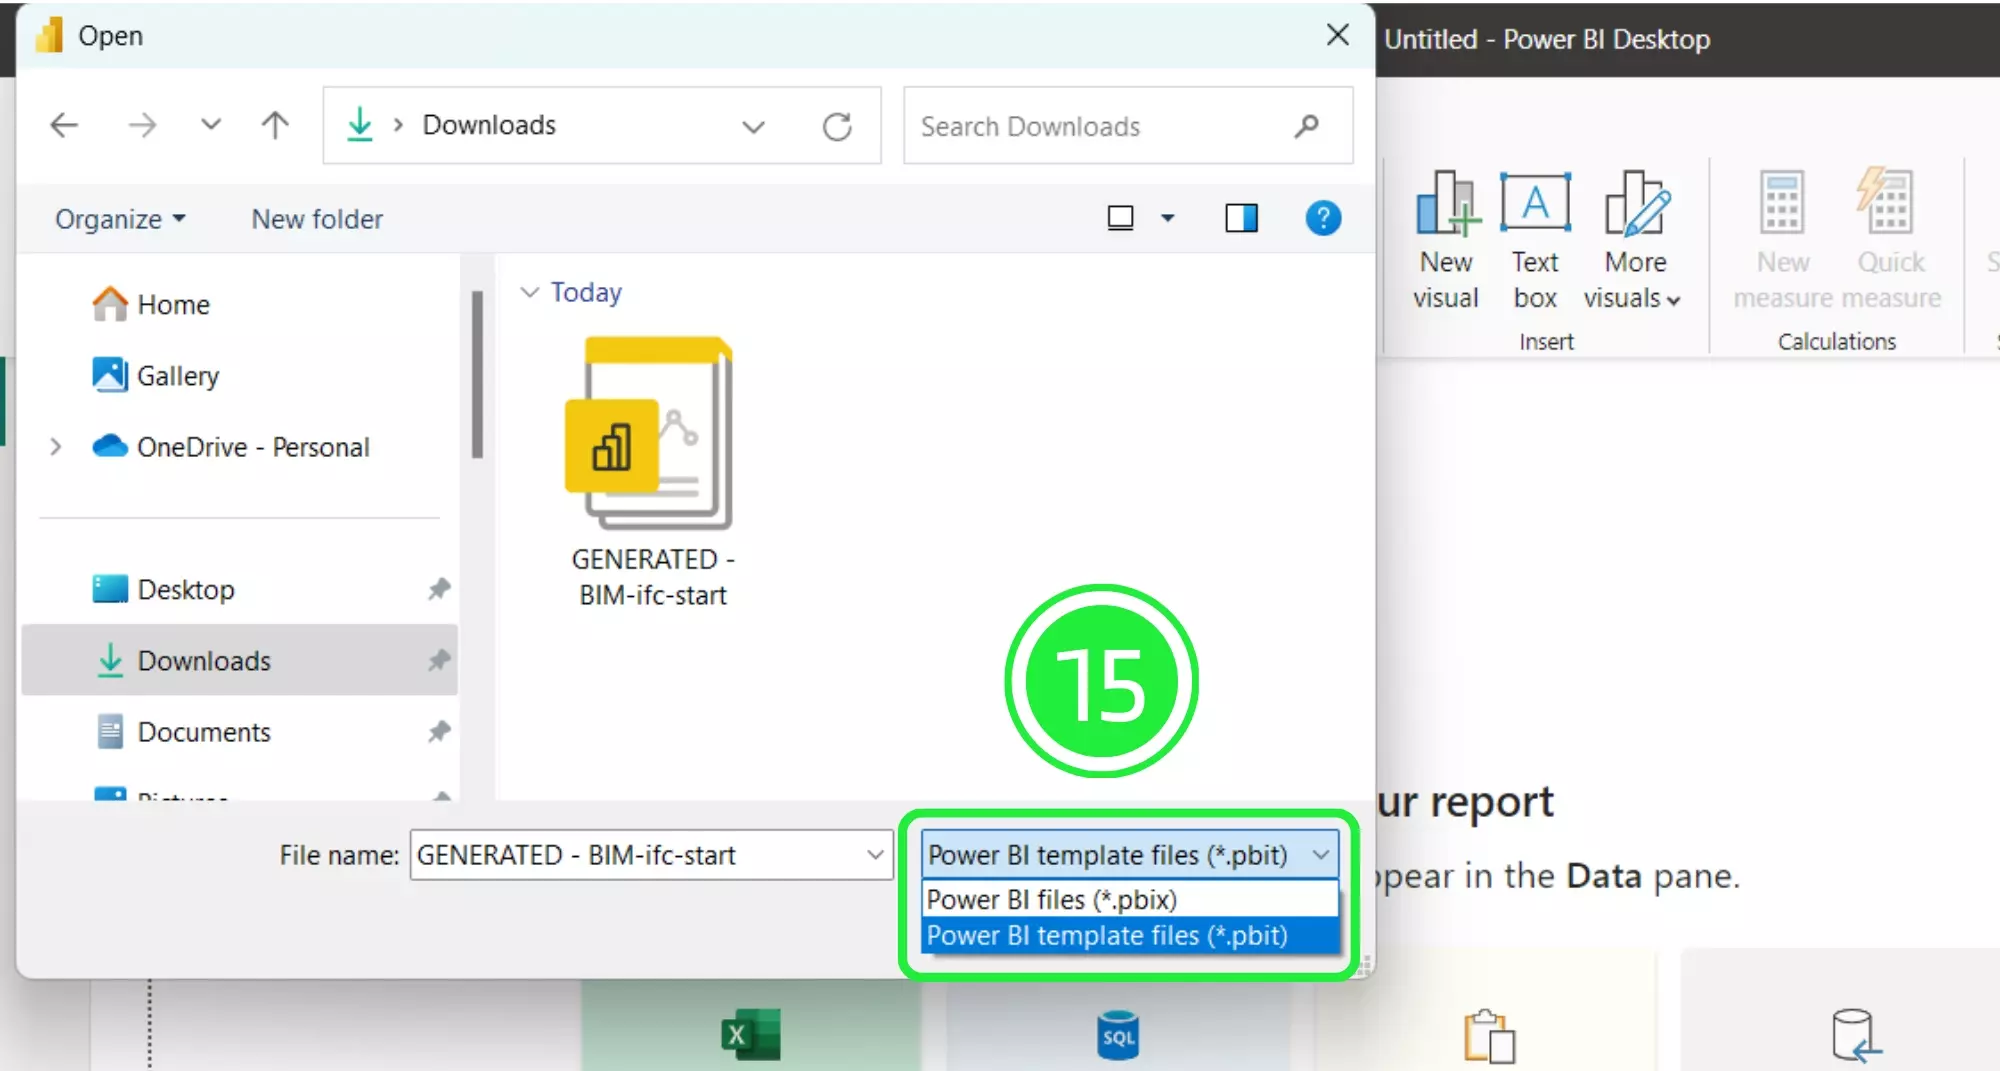
In the “Open” window, navigate to the bottom right and choose the correct file extension, specifically “Power BI Template Files (*pbit)”, to locate your dashboard files.
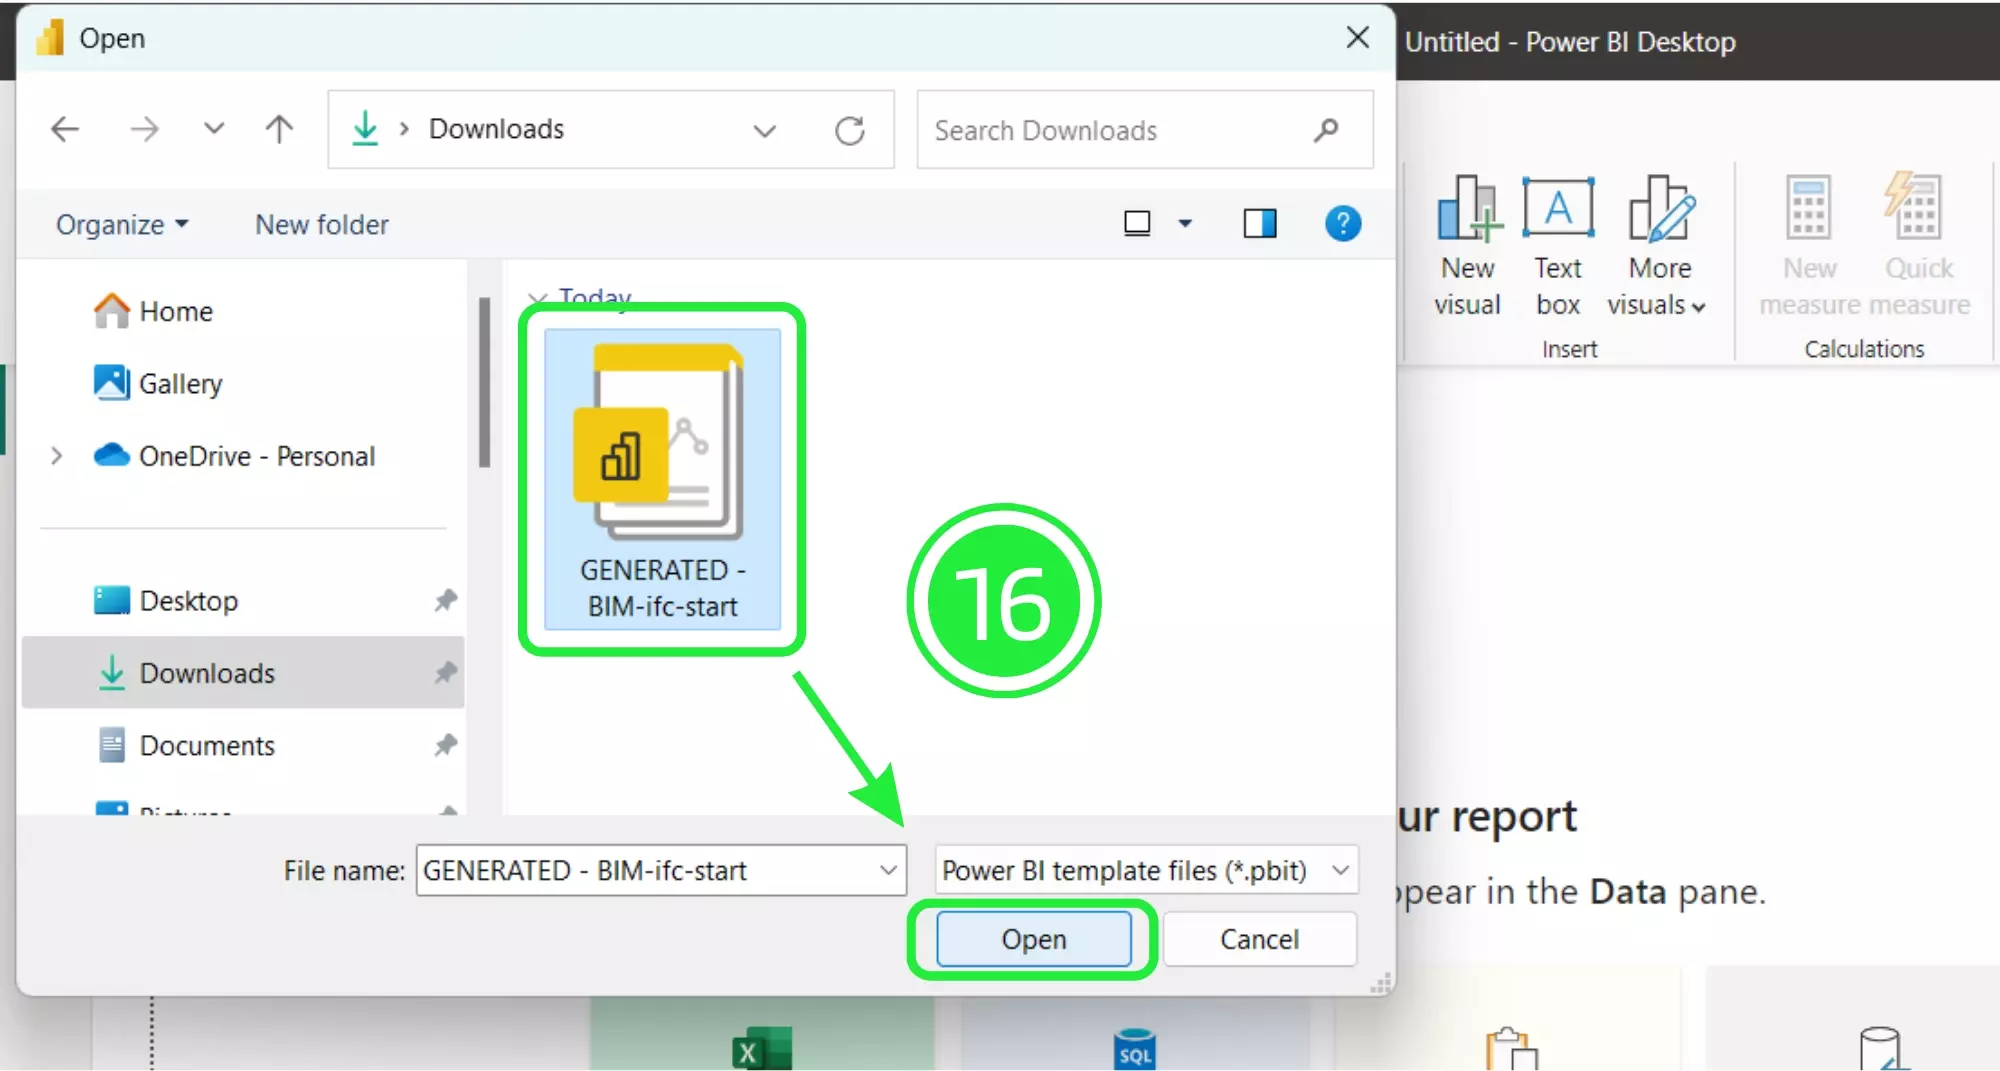
Select your newly downloaded template file and then click on “Open”, preparing it for integration into Power BI.
Upon seeing the file details pop-up, click on “Load” to commence the loading of your dashboard template file into Microsoft Power BI.

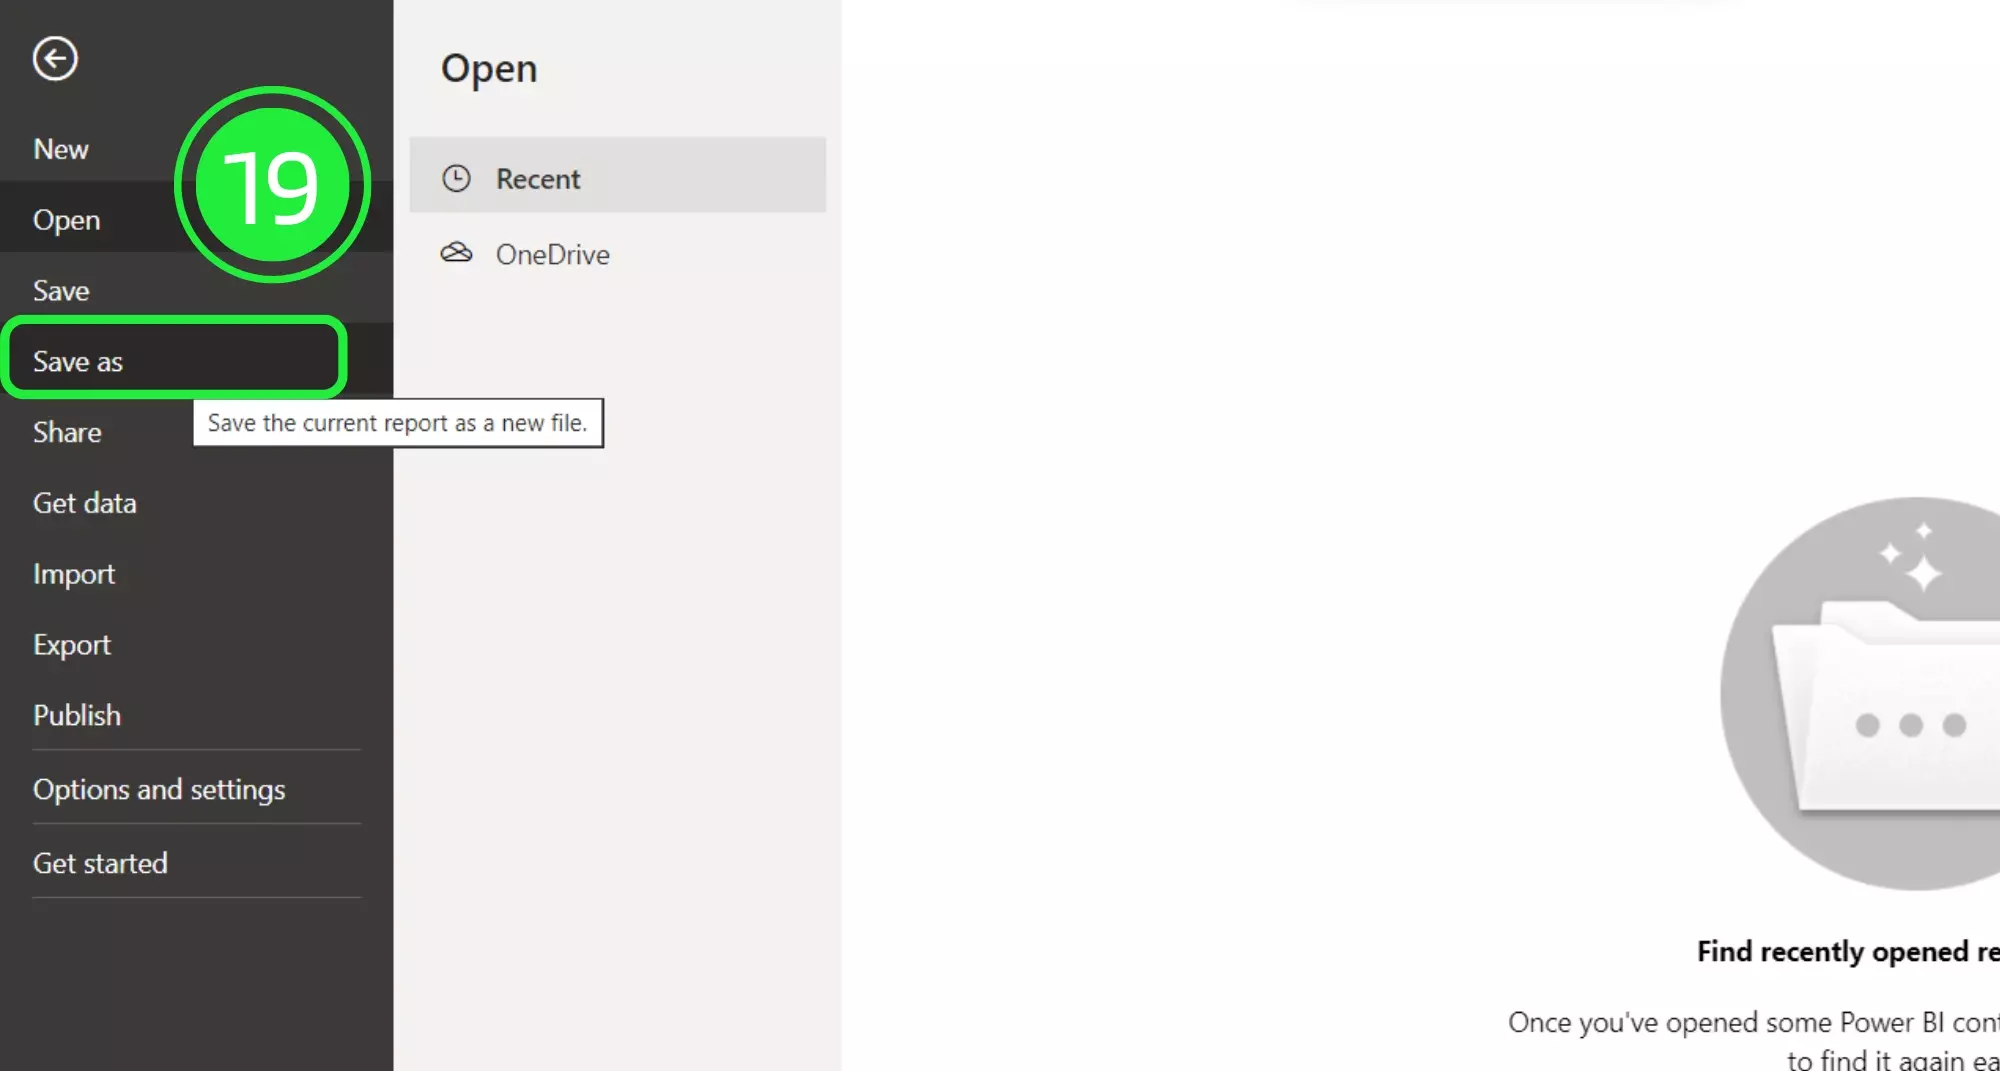
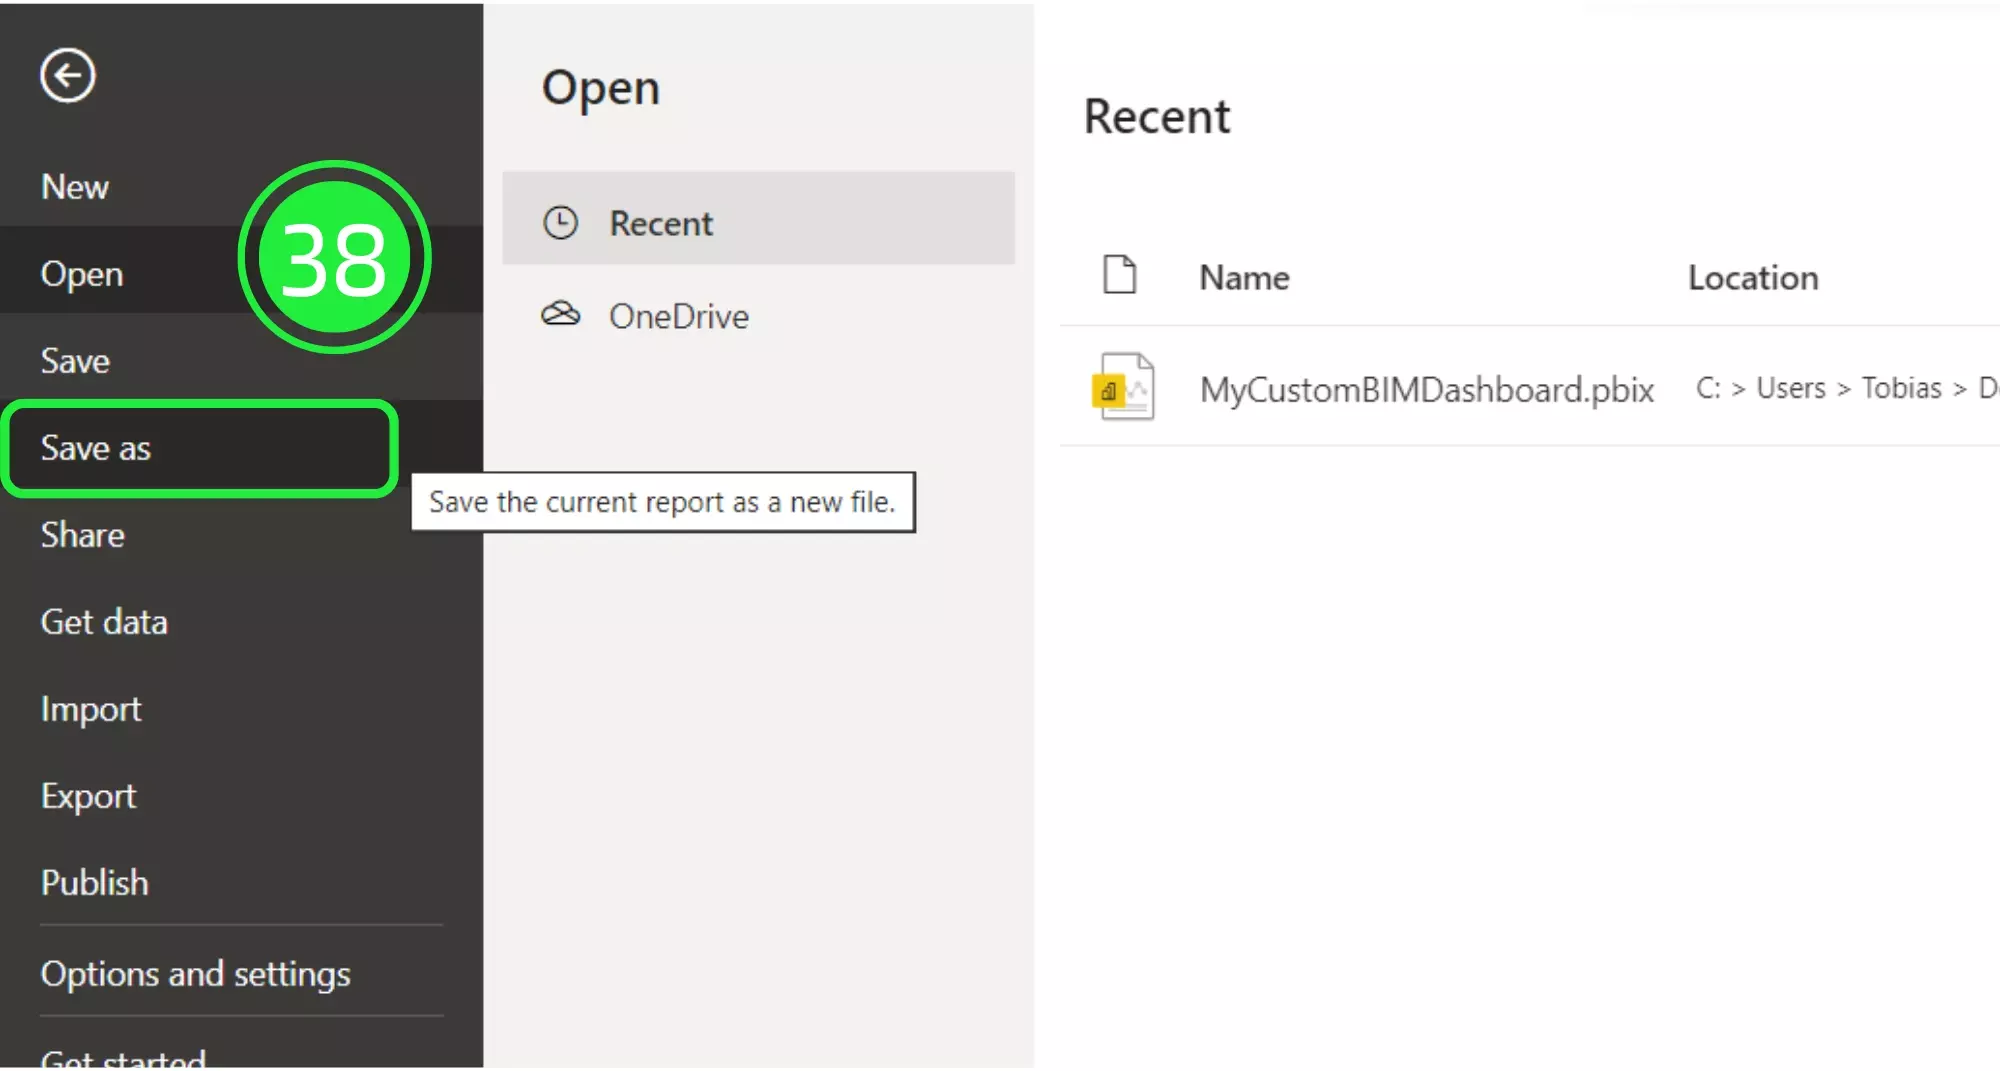
For building the template in Power BI, first save it as a Power BI file (.pbix) by clicking on “File” in the top left corner.
Choose “Save As” to secure your file, a crucial step in safeguarding your dashboard’s progress.
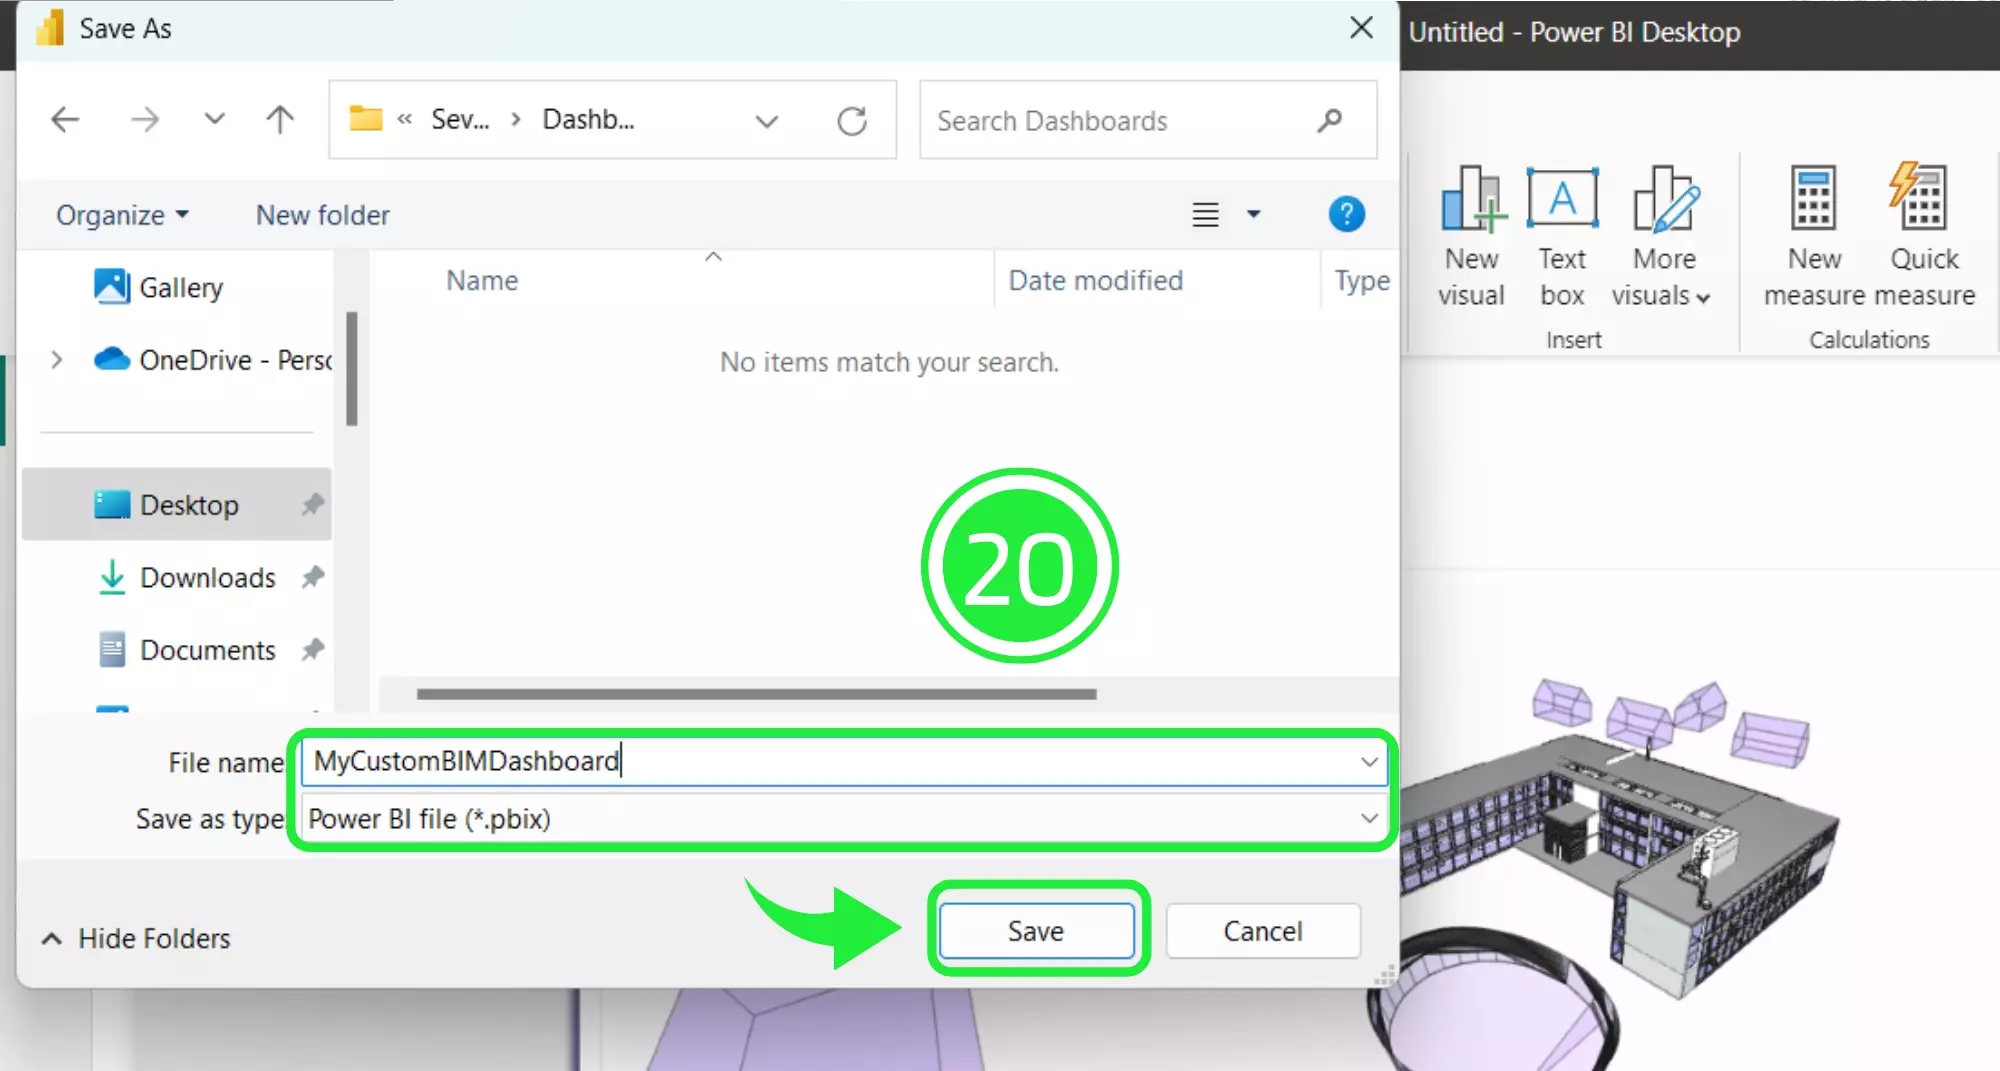
Decide on an appropriate name for your file and confirm by clicking the “Save” button, effectively finalizing your Power BI BIM dashboard creation.
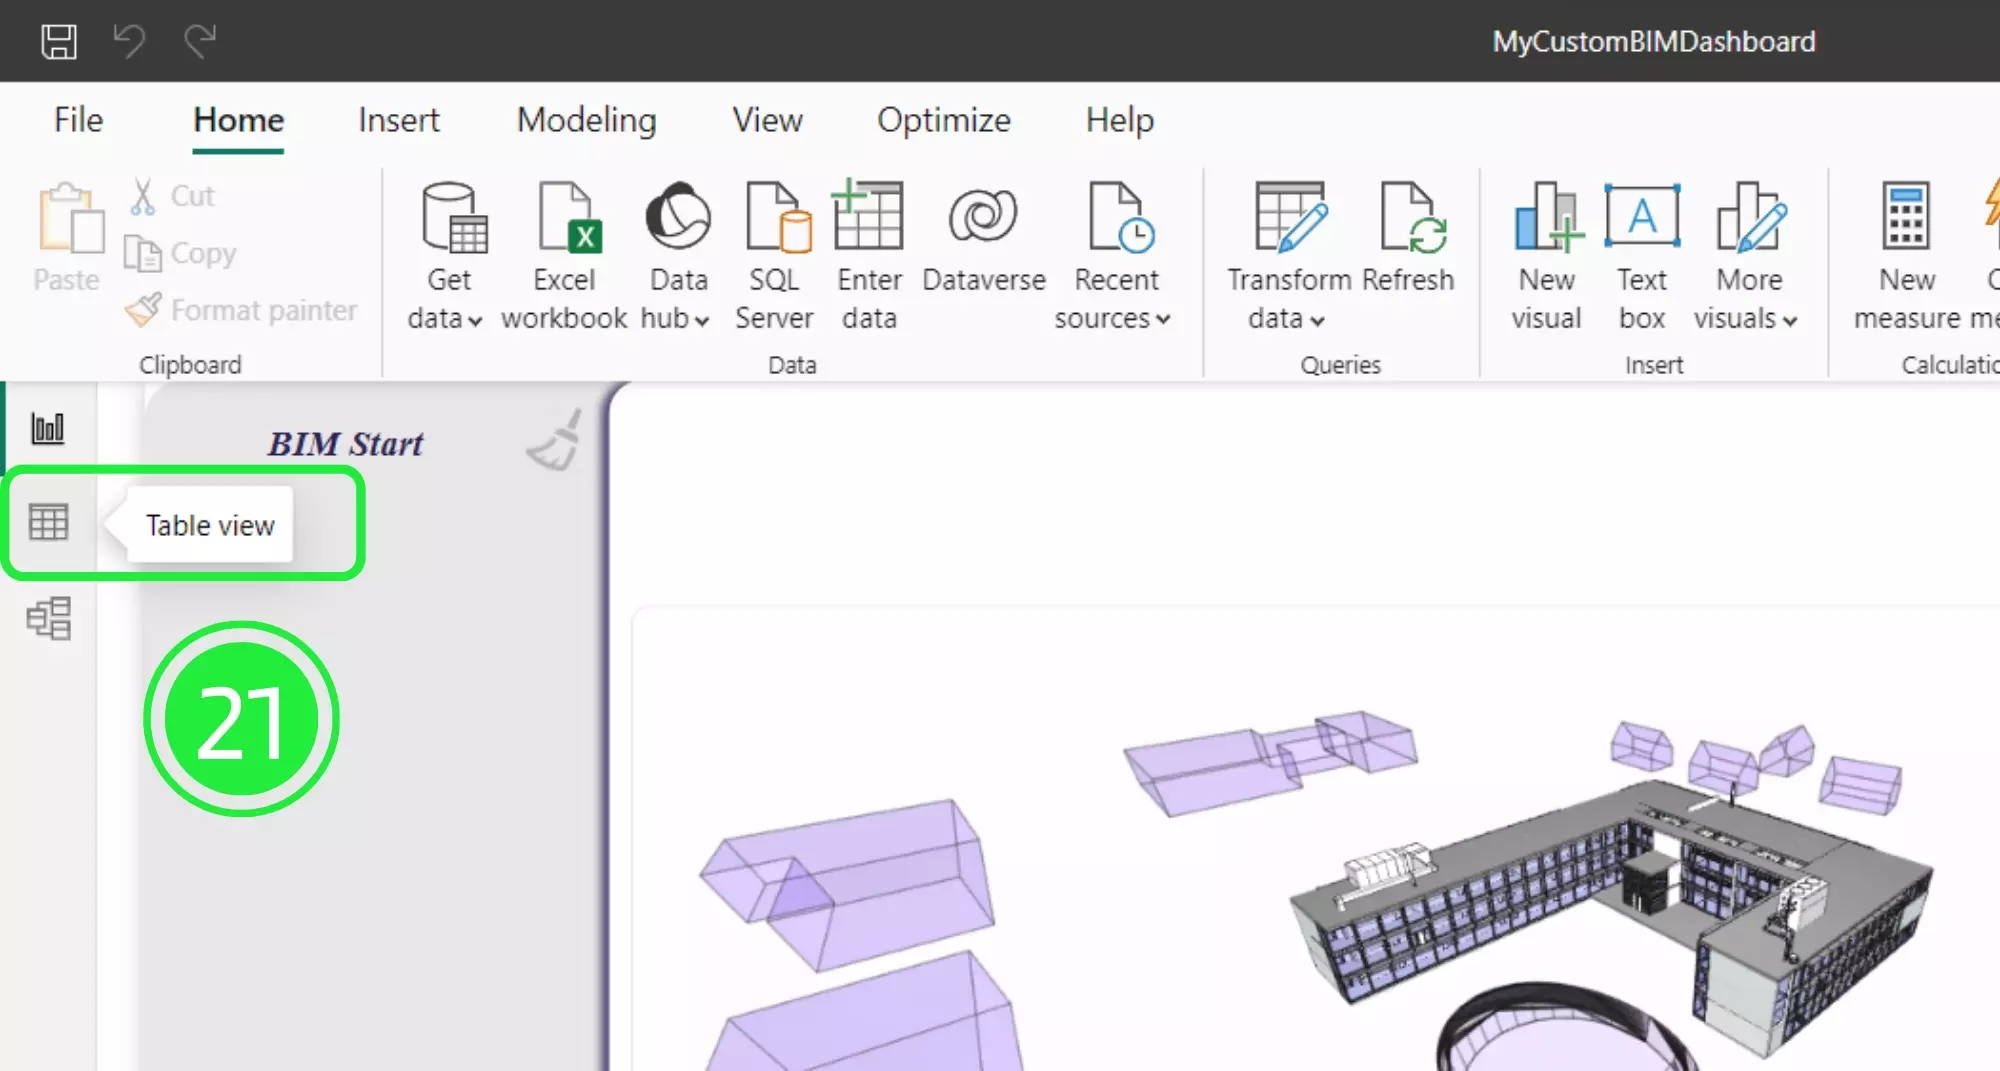
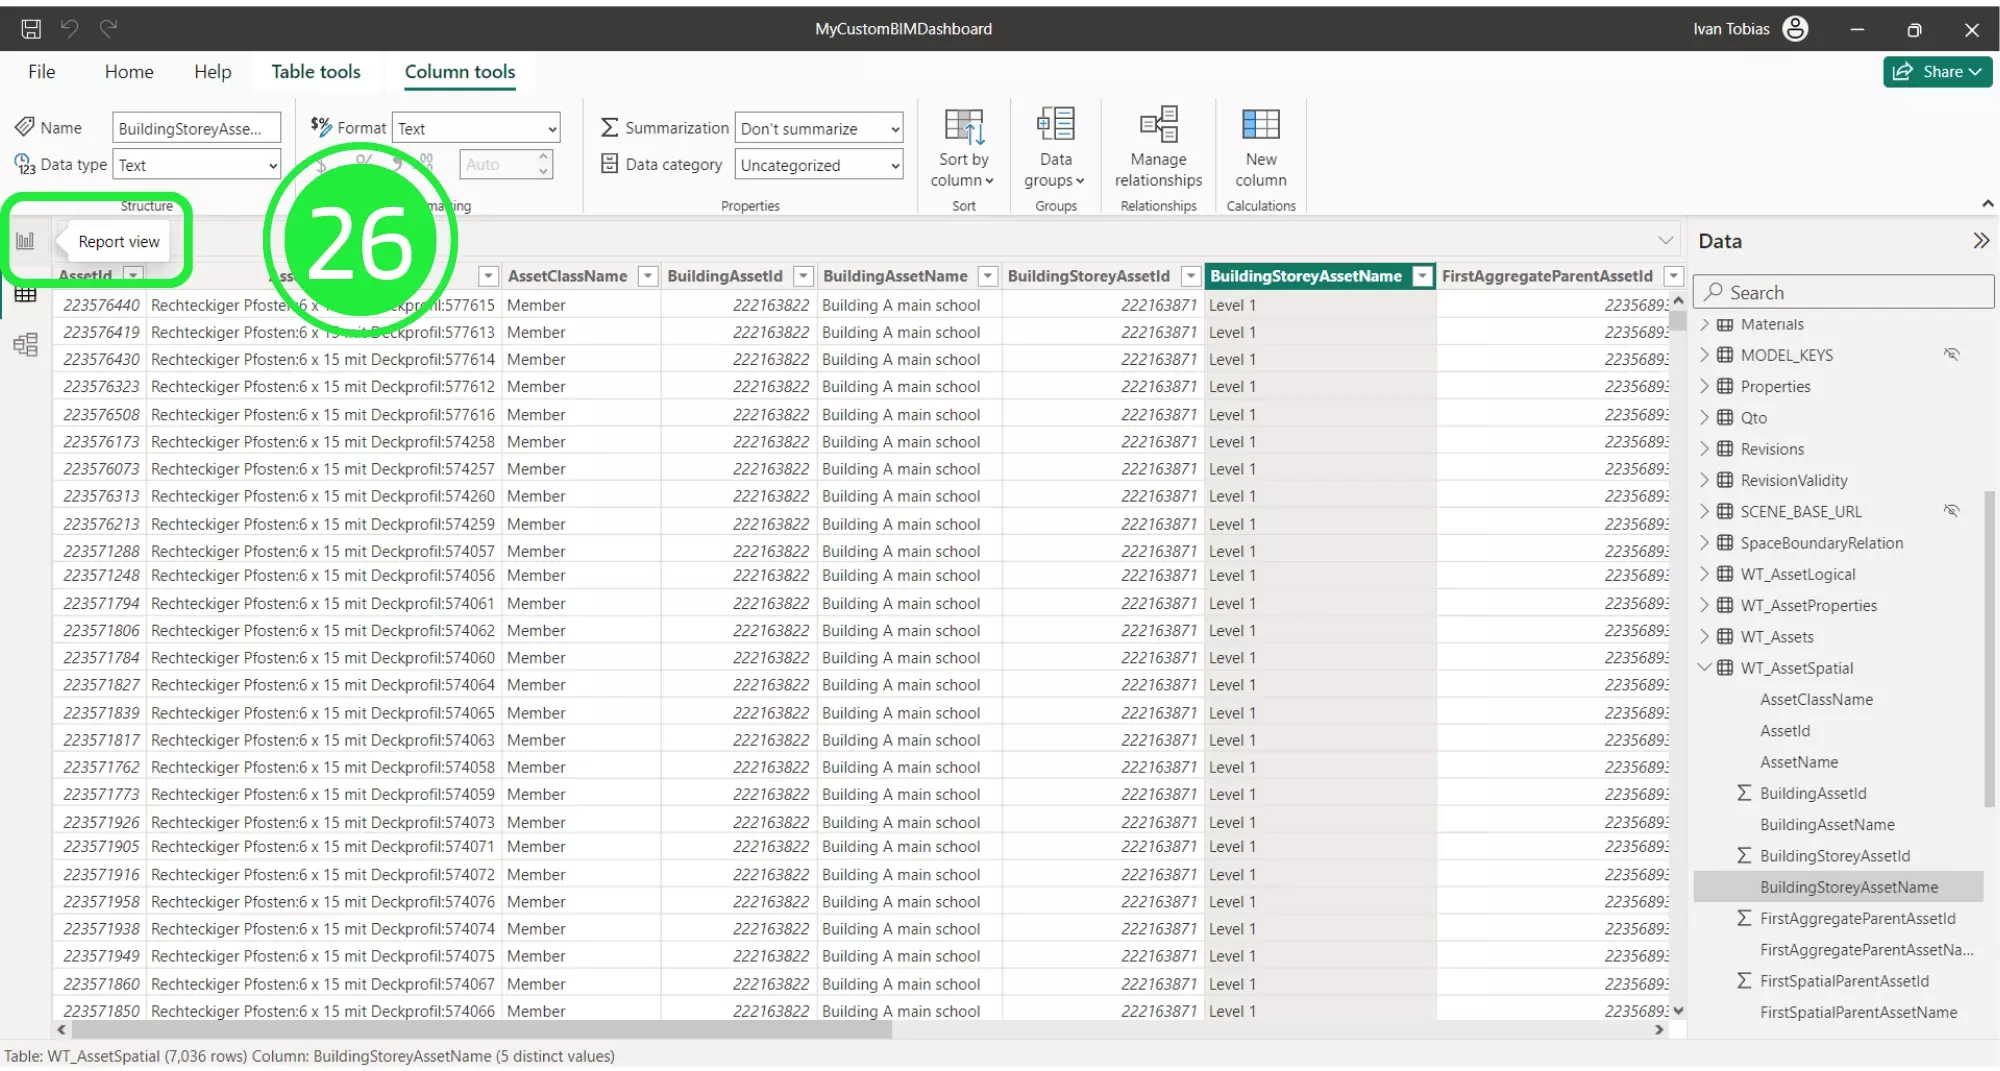
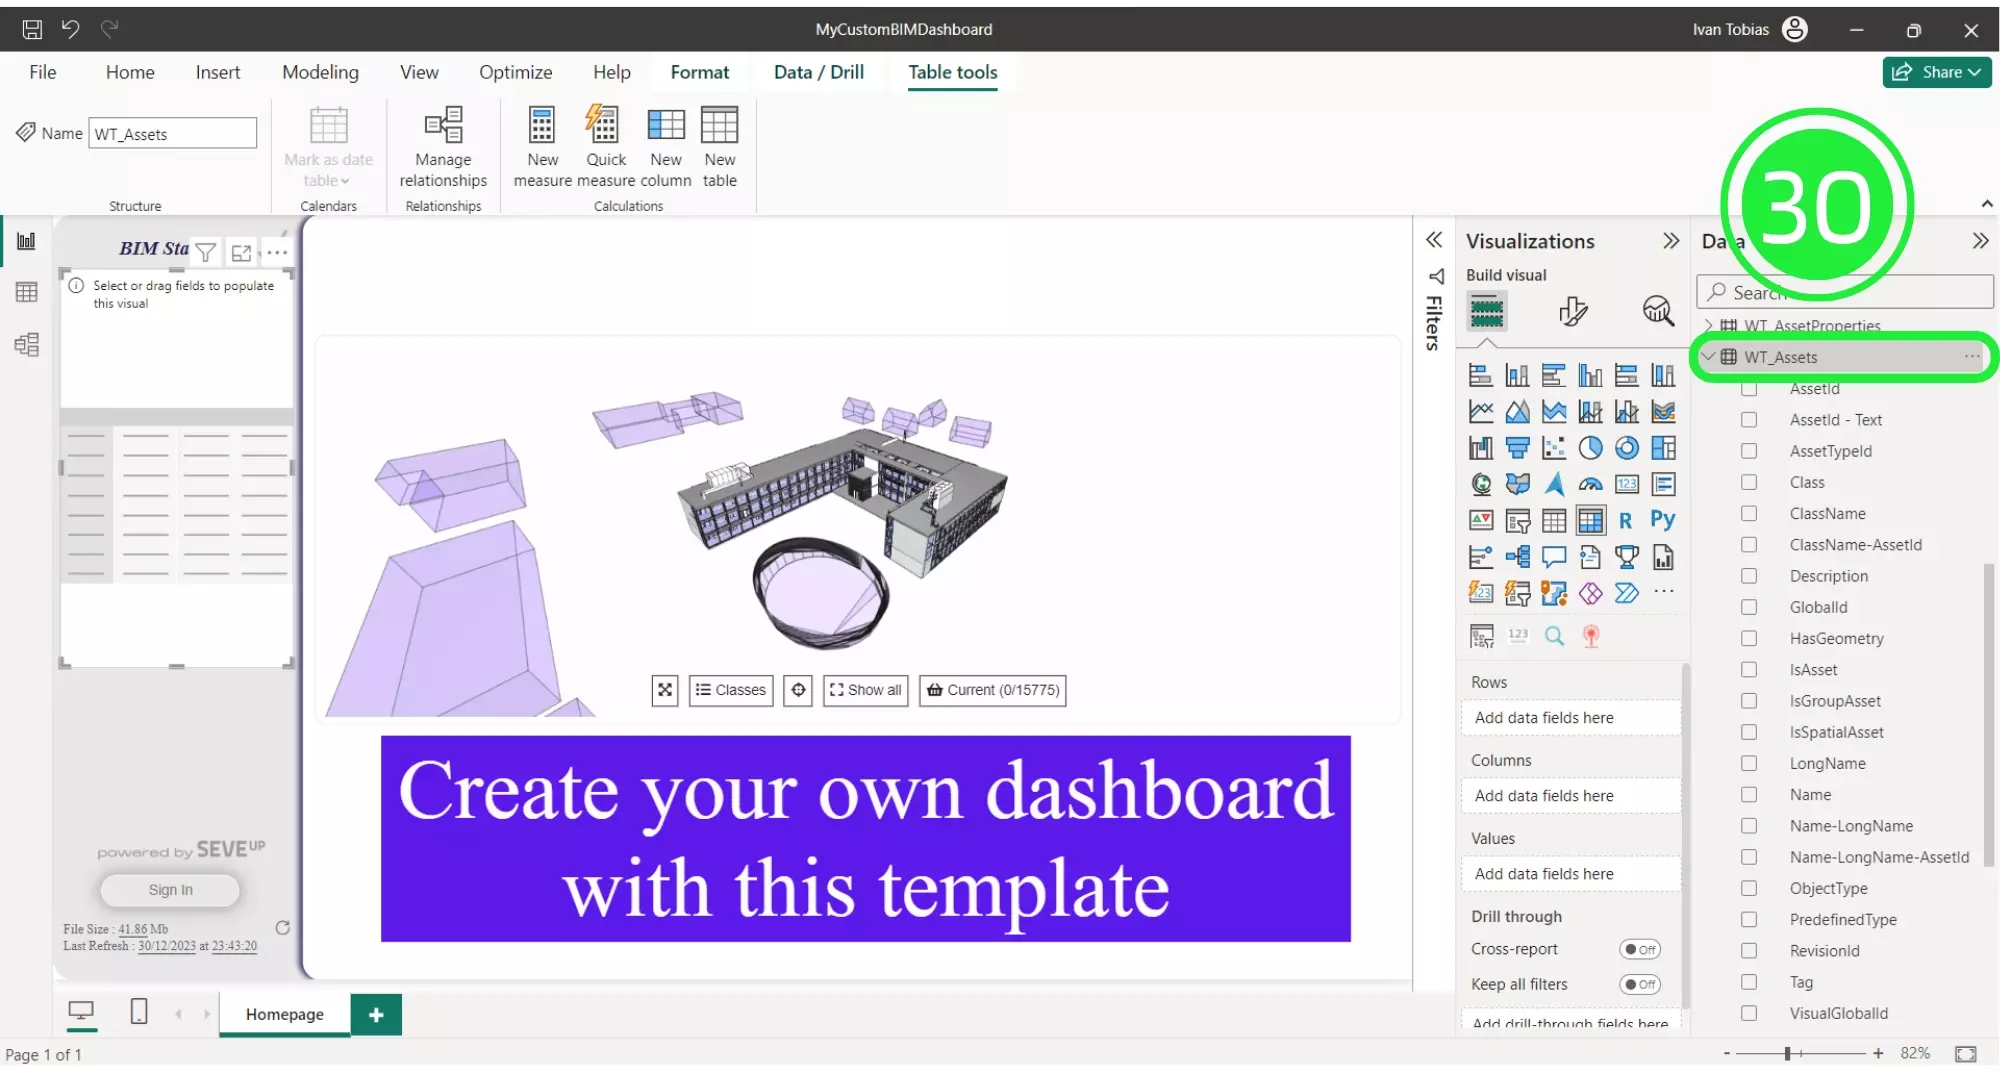
Explore data for the Power BI BIM Spatial Tree visualization. Instructions on accessing “Table View”.
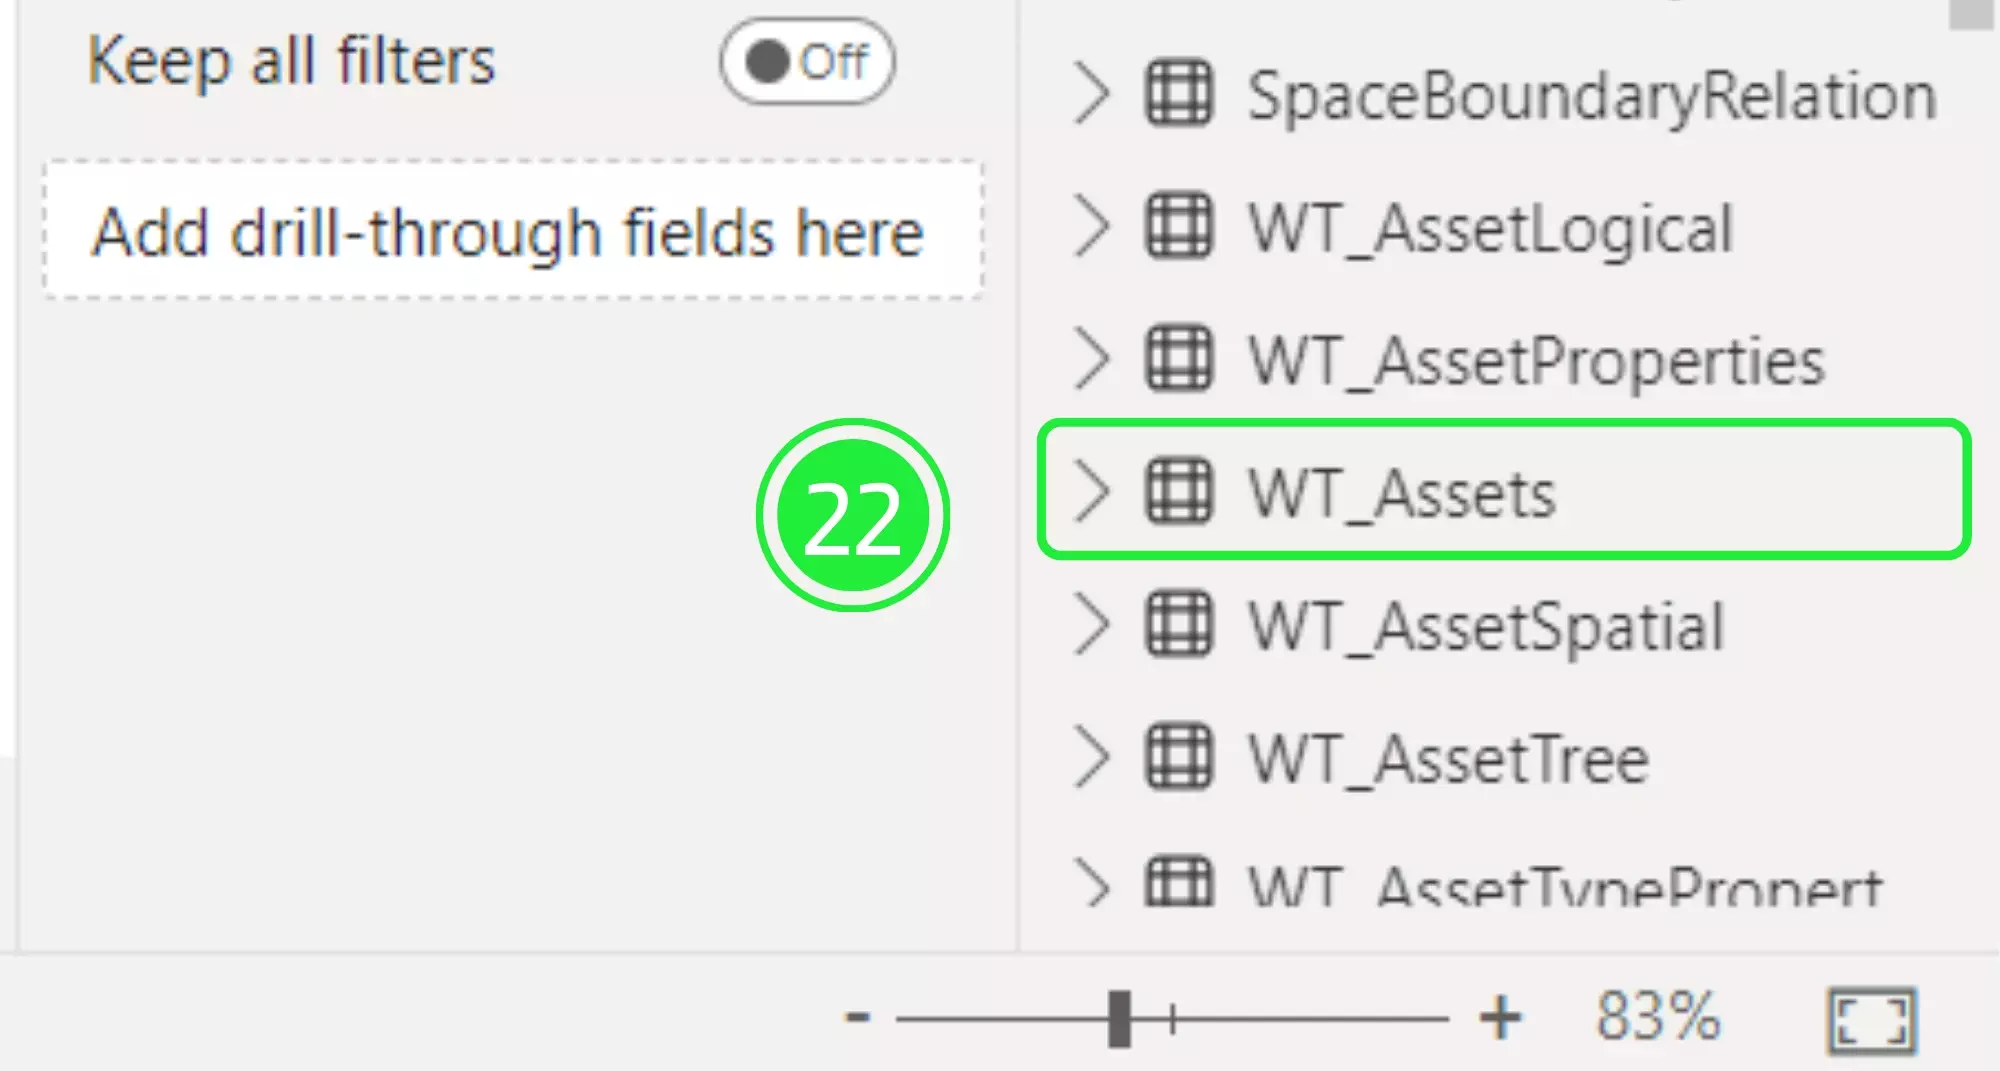
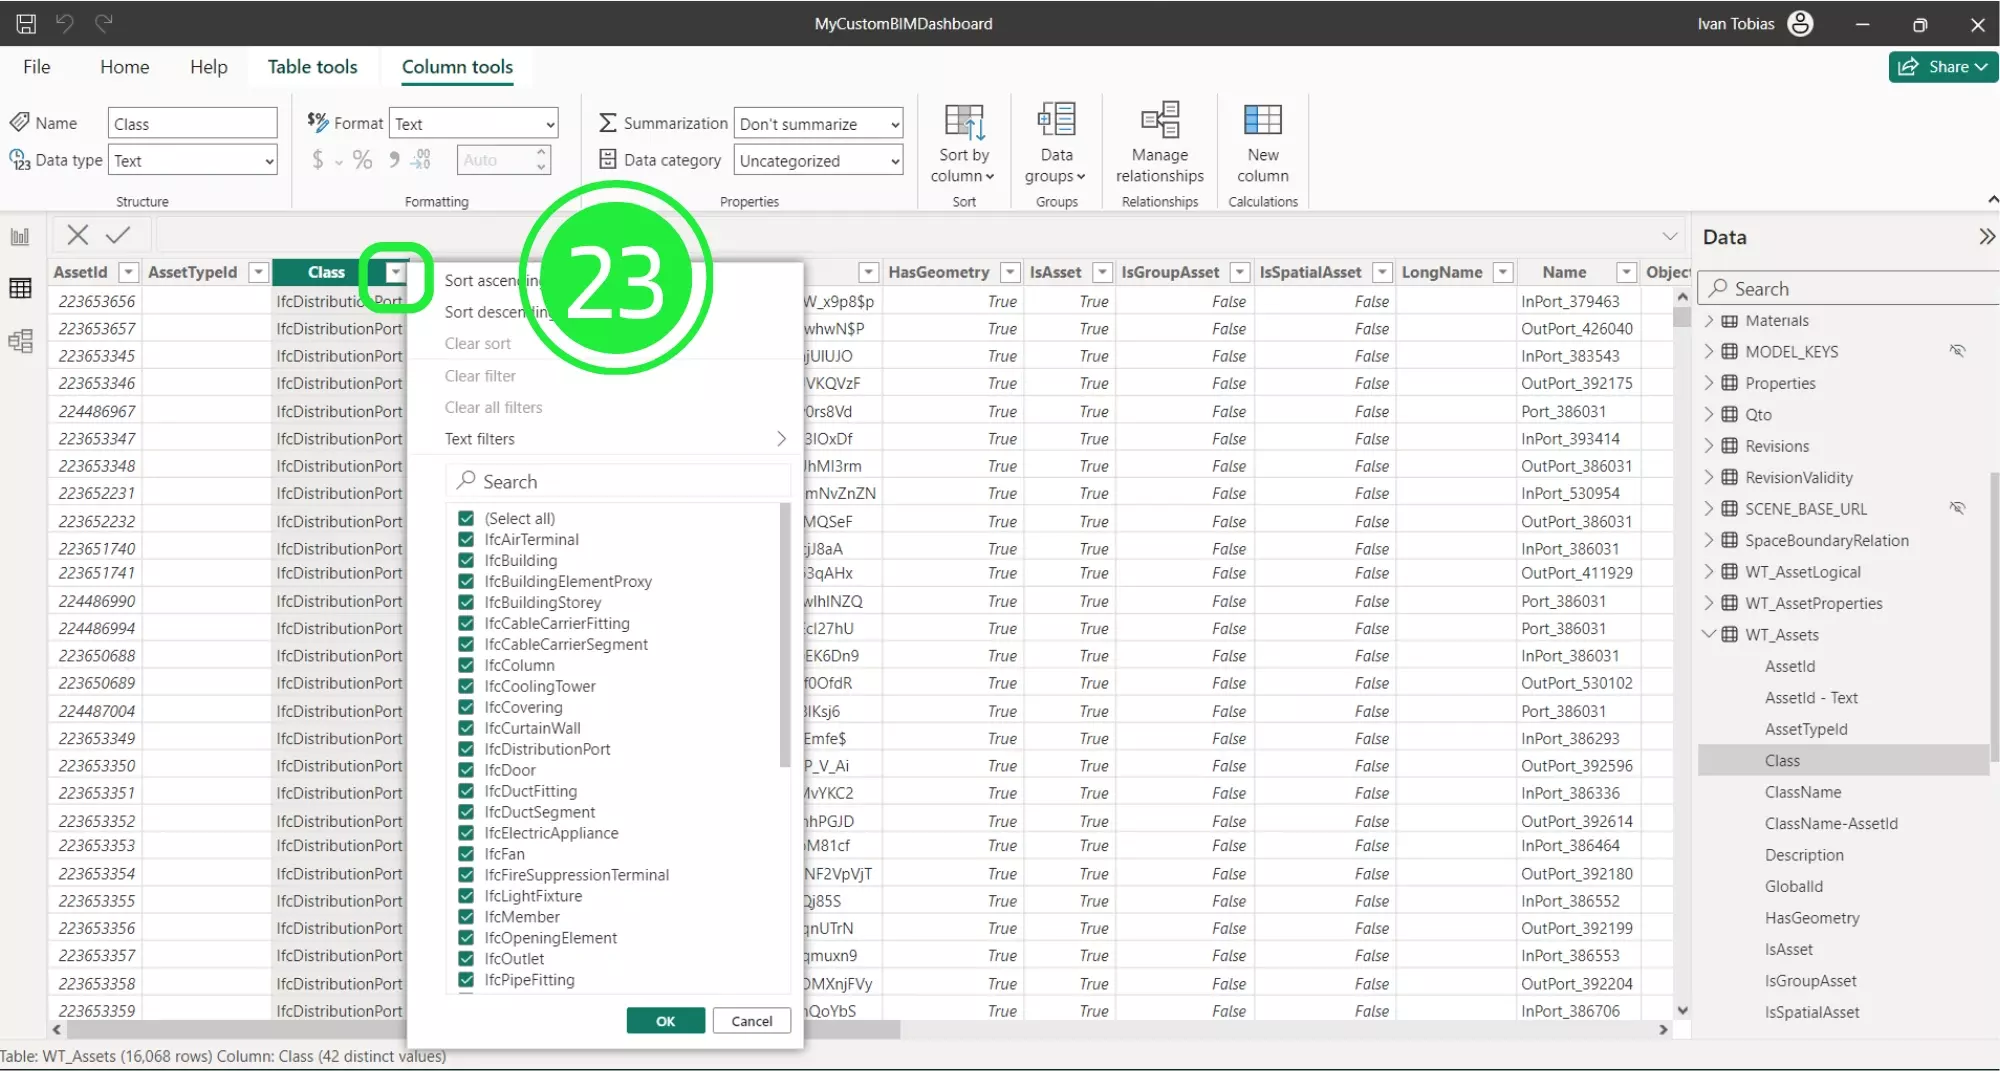
Choose WT_Assets for detailed asset insights within your BIM Model on the Power BI dashboard.
Utilize the drop-down menu in “Class” to explore various IFC classes for your BIM dashboard.
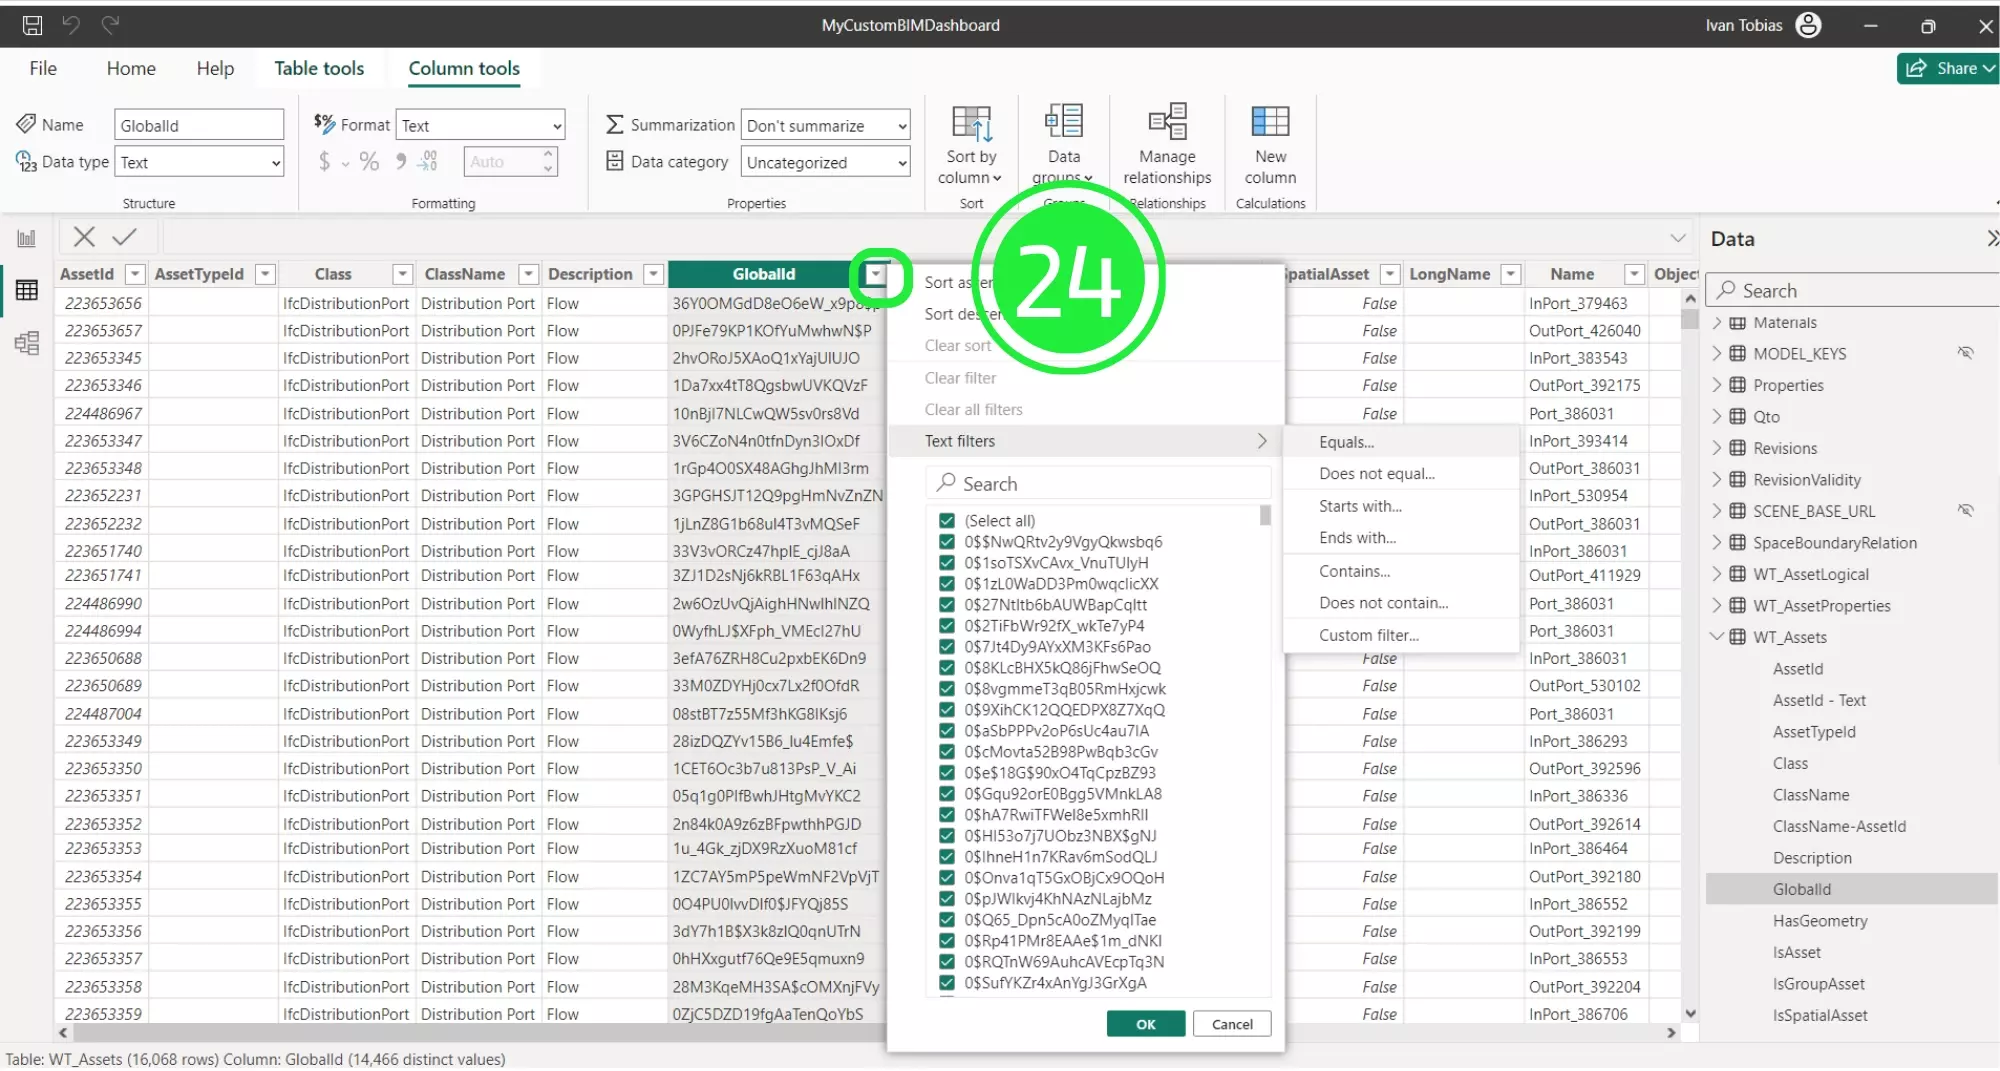
View unique ID codes essential for BIM model integration and management in Power BI.
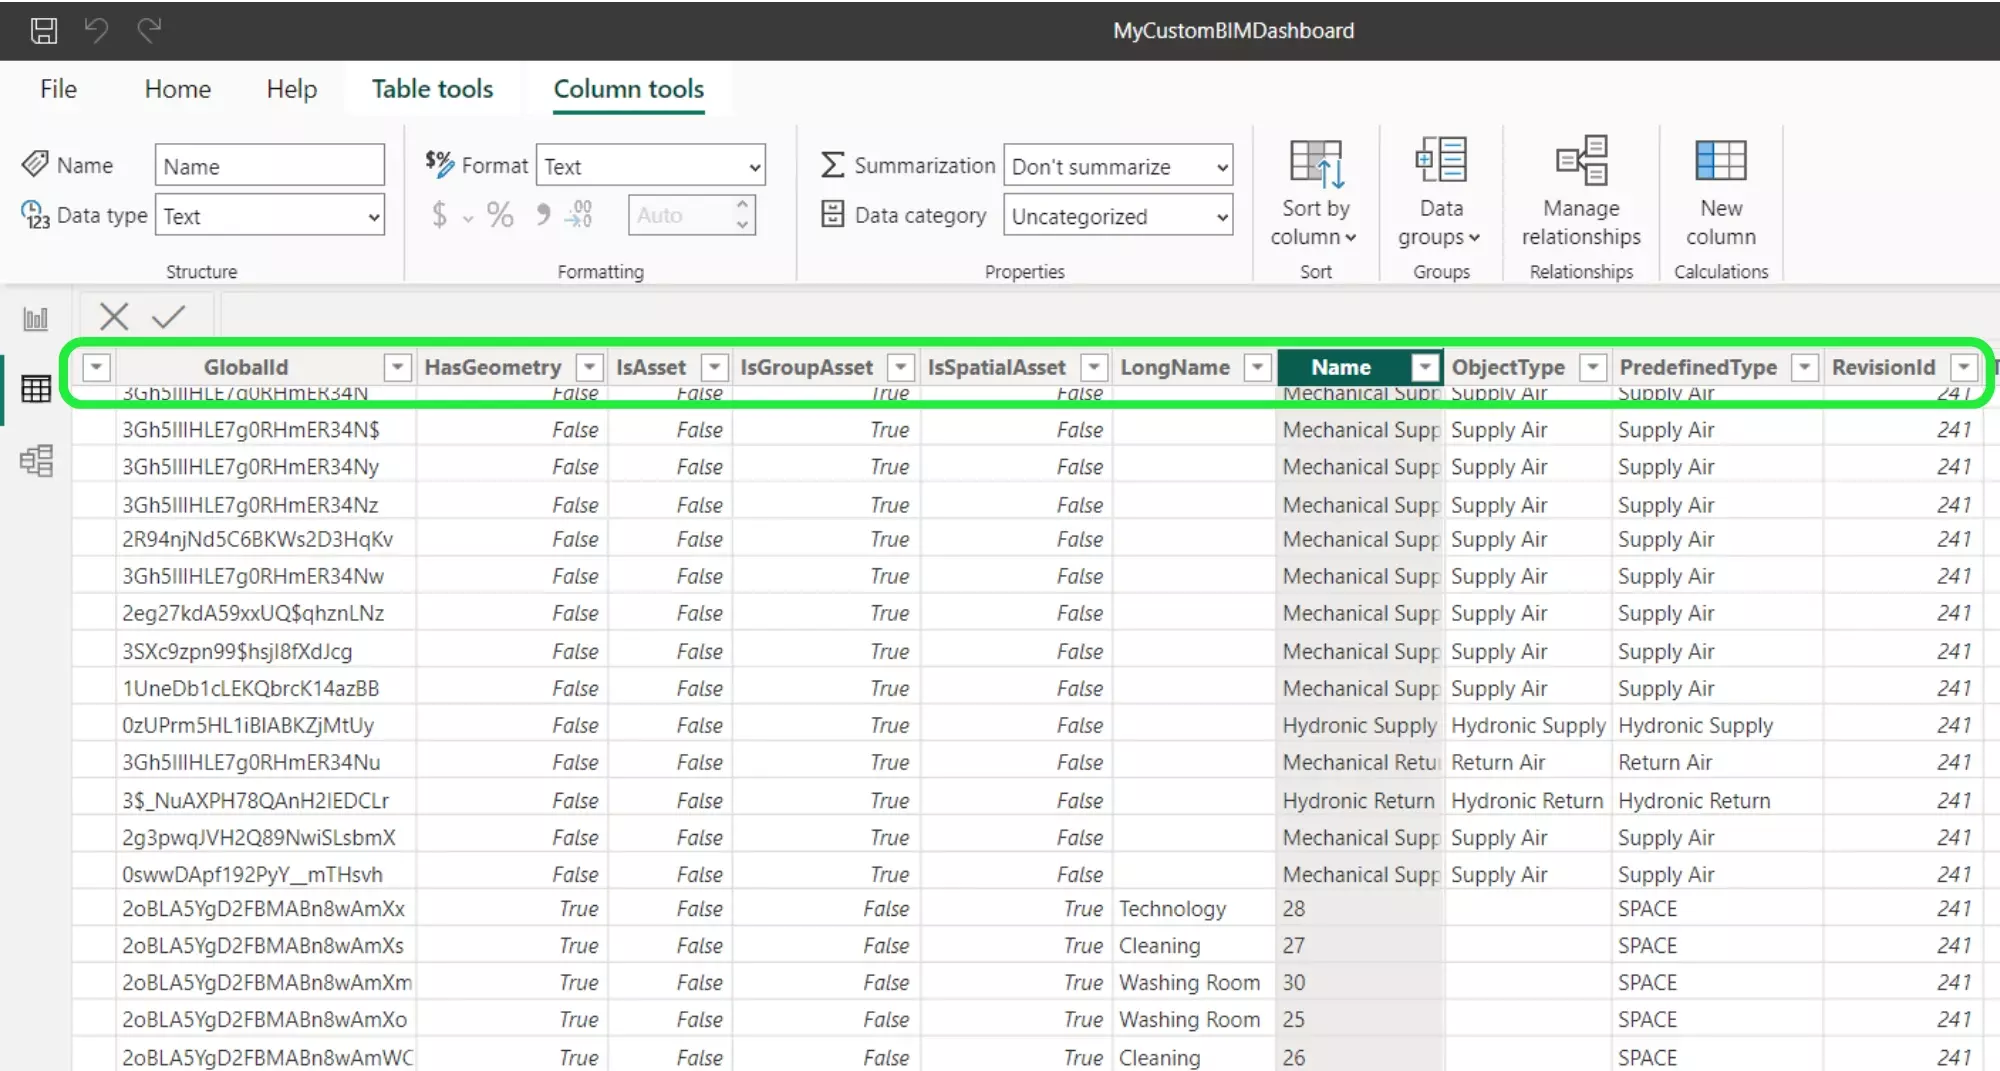
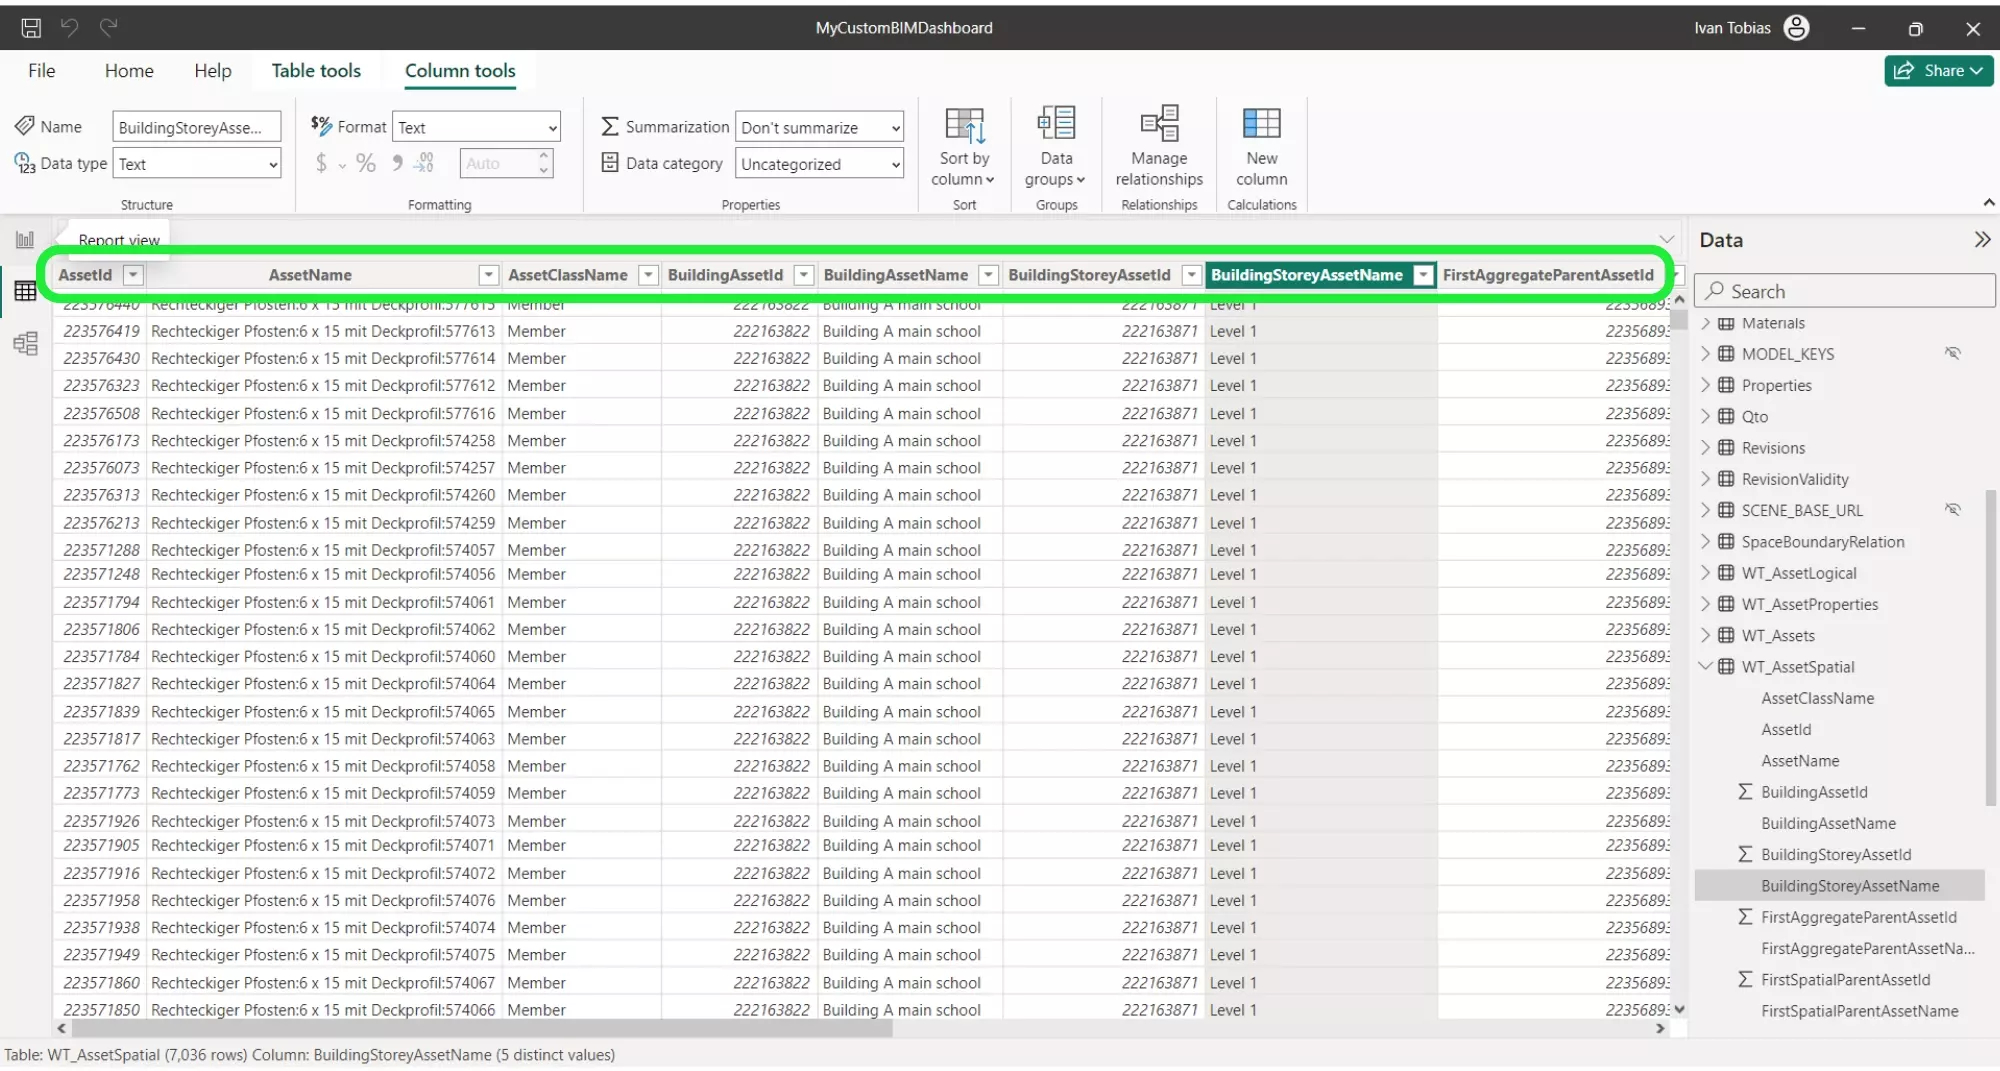
You’ll also see columns for “Longname”, “Name”, “Object Type” etc – these are the main IFC class attributes that come with your asset. And all these columns can be used to animate your Power BI visual on your dashboard.
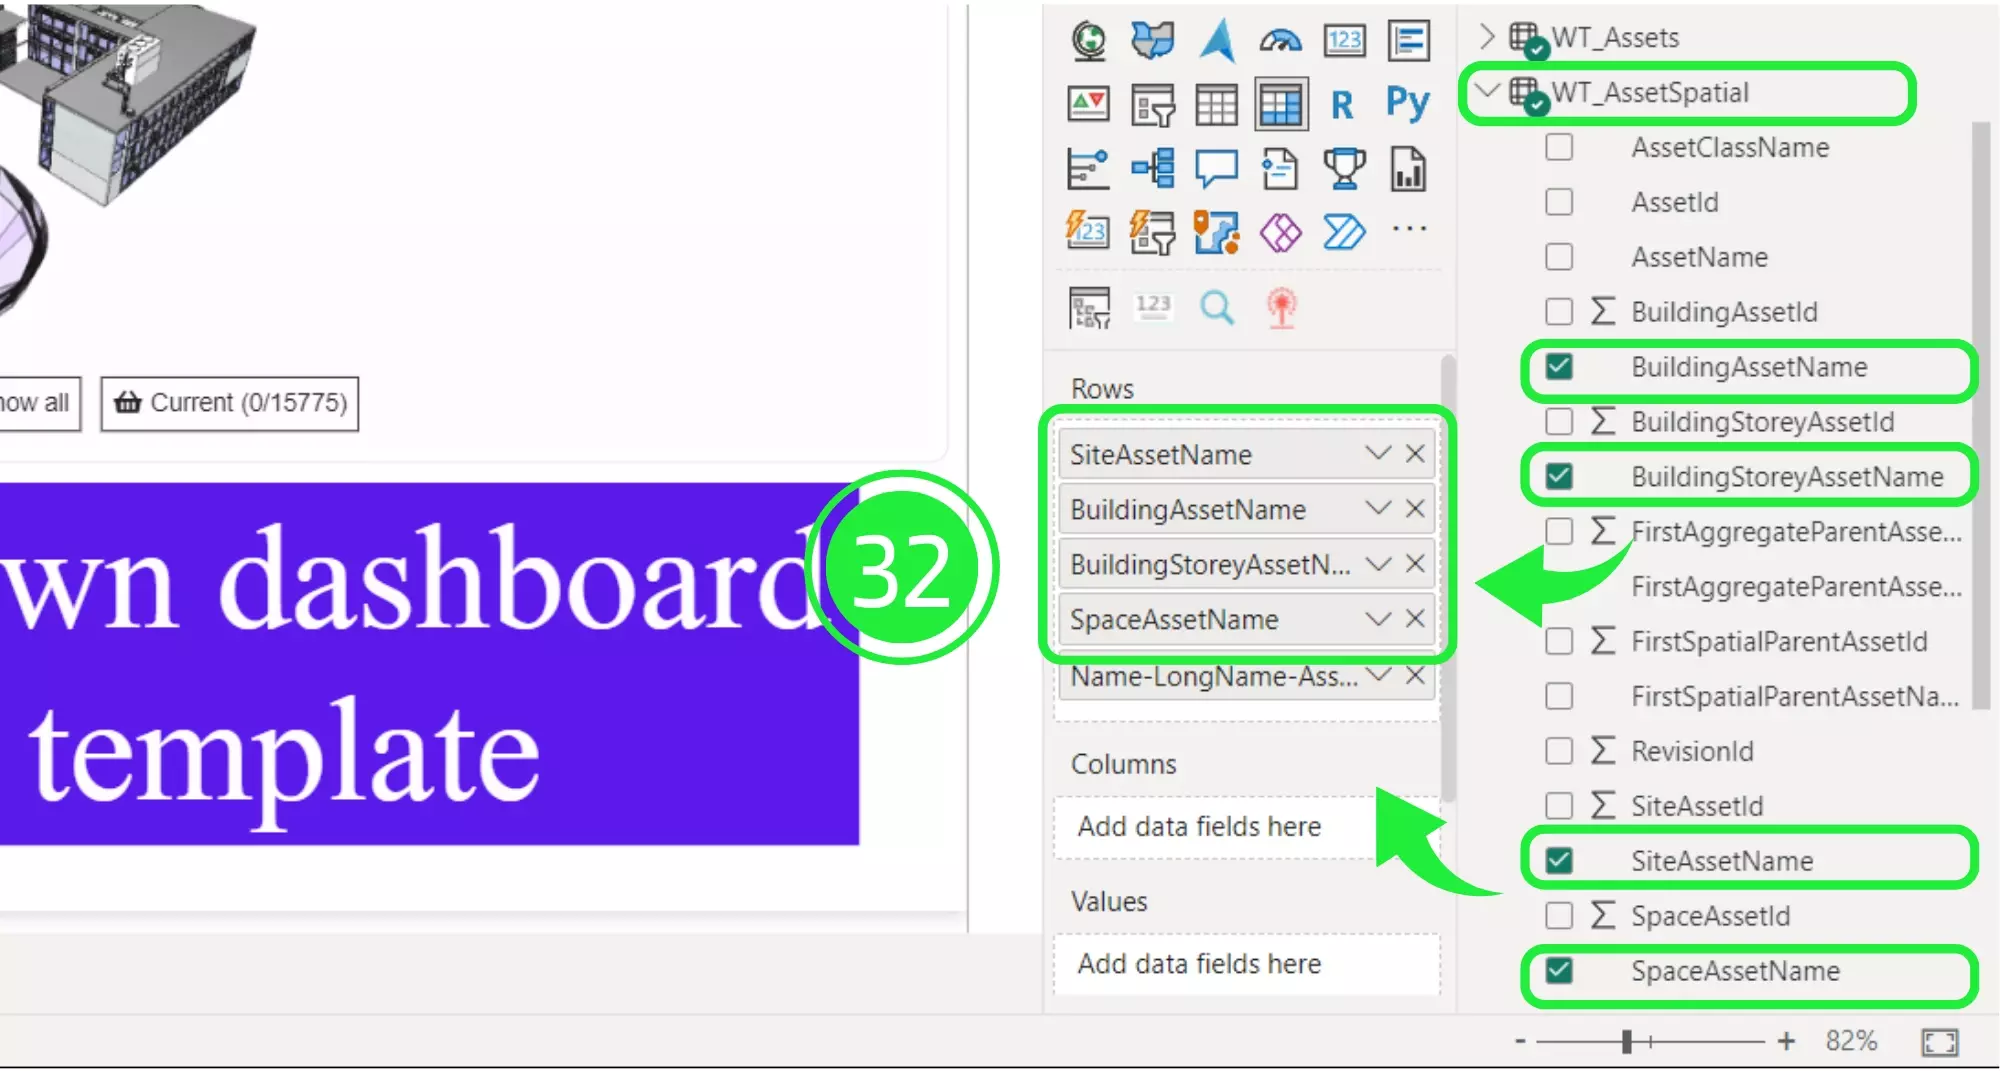
Reference spatial positions using “WT_AssetSpatial”, enhancing the Power BI BIM Spatial Tree.
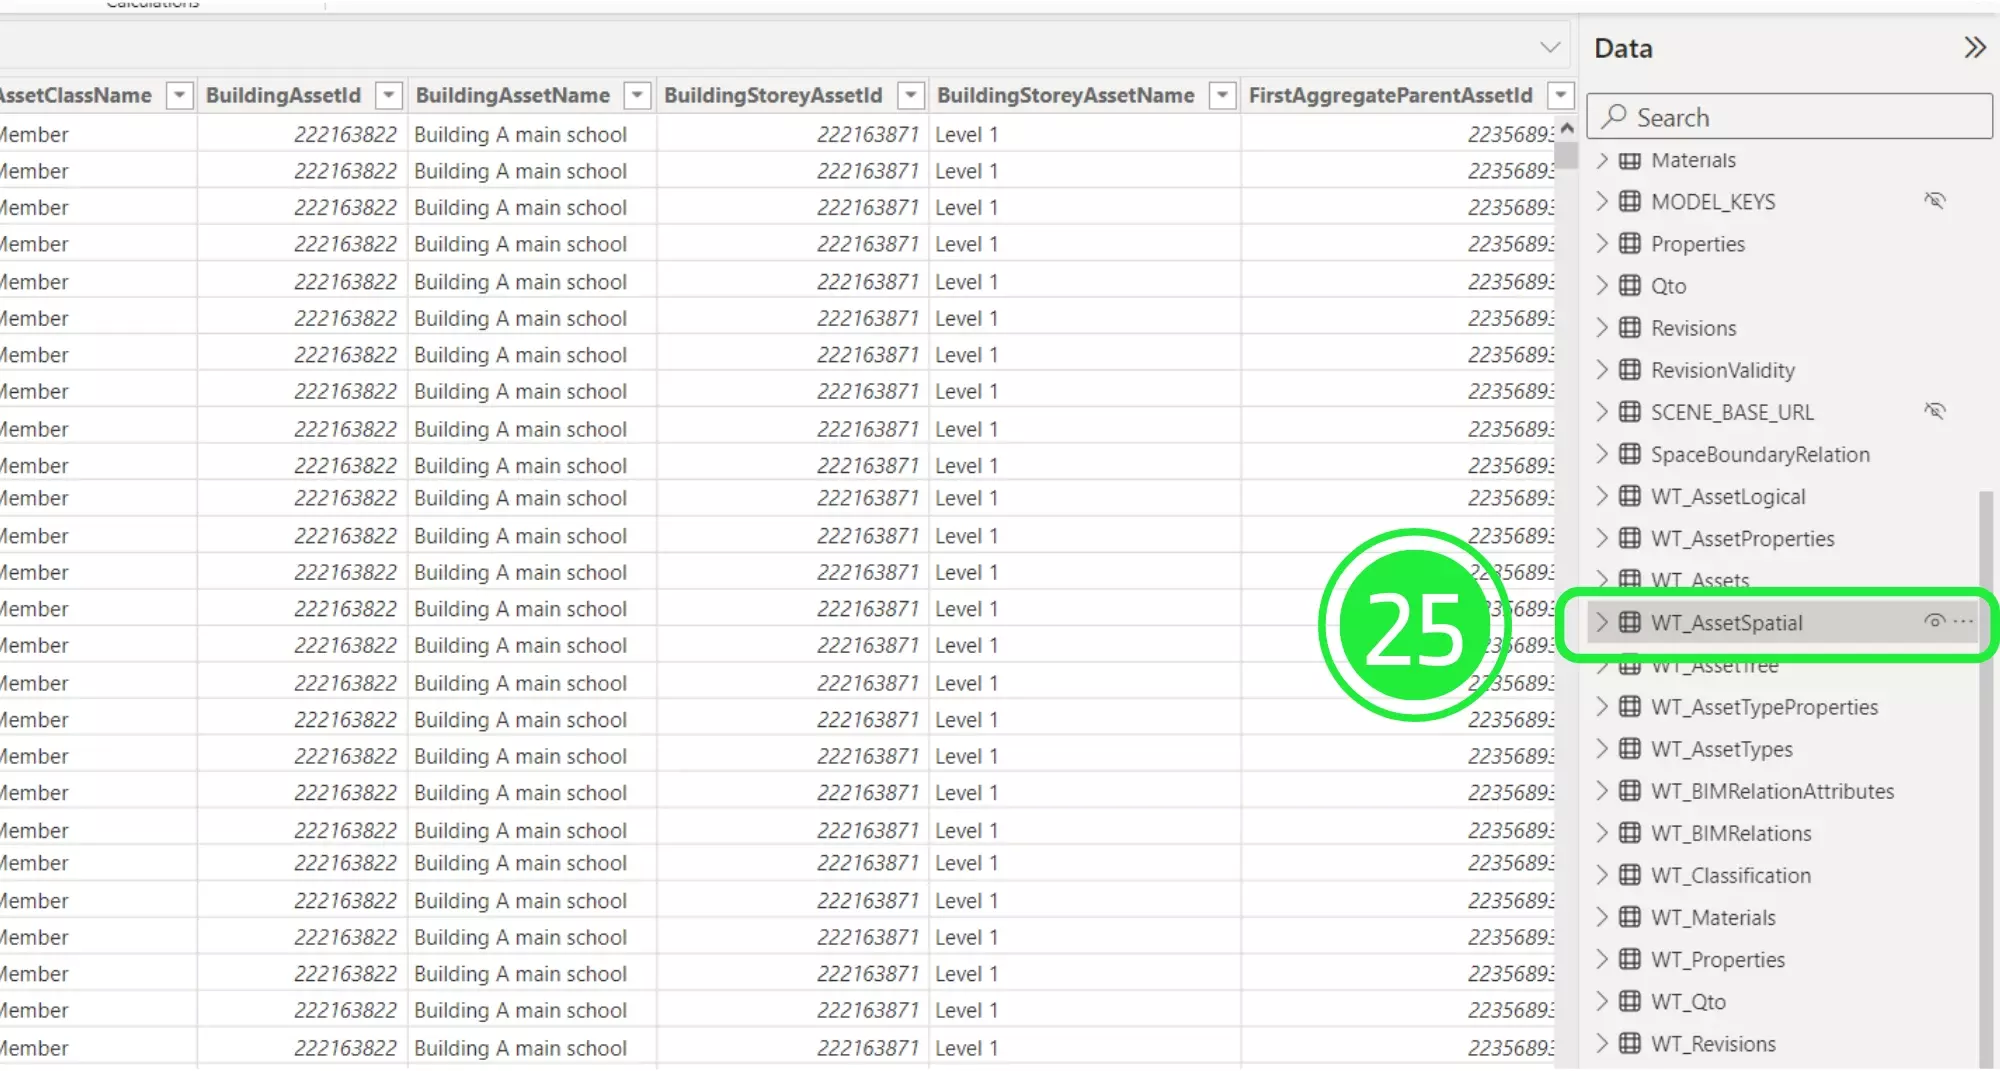
The spatial position is defined by the Site, Building, Building Storey, and Space related columns in this table.
Switch back to “Report View” to continue building your spatial tree in the 3D BIM Viewer.
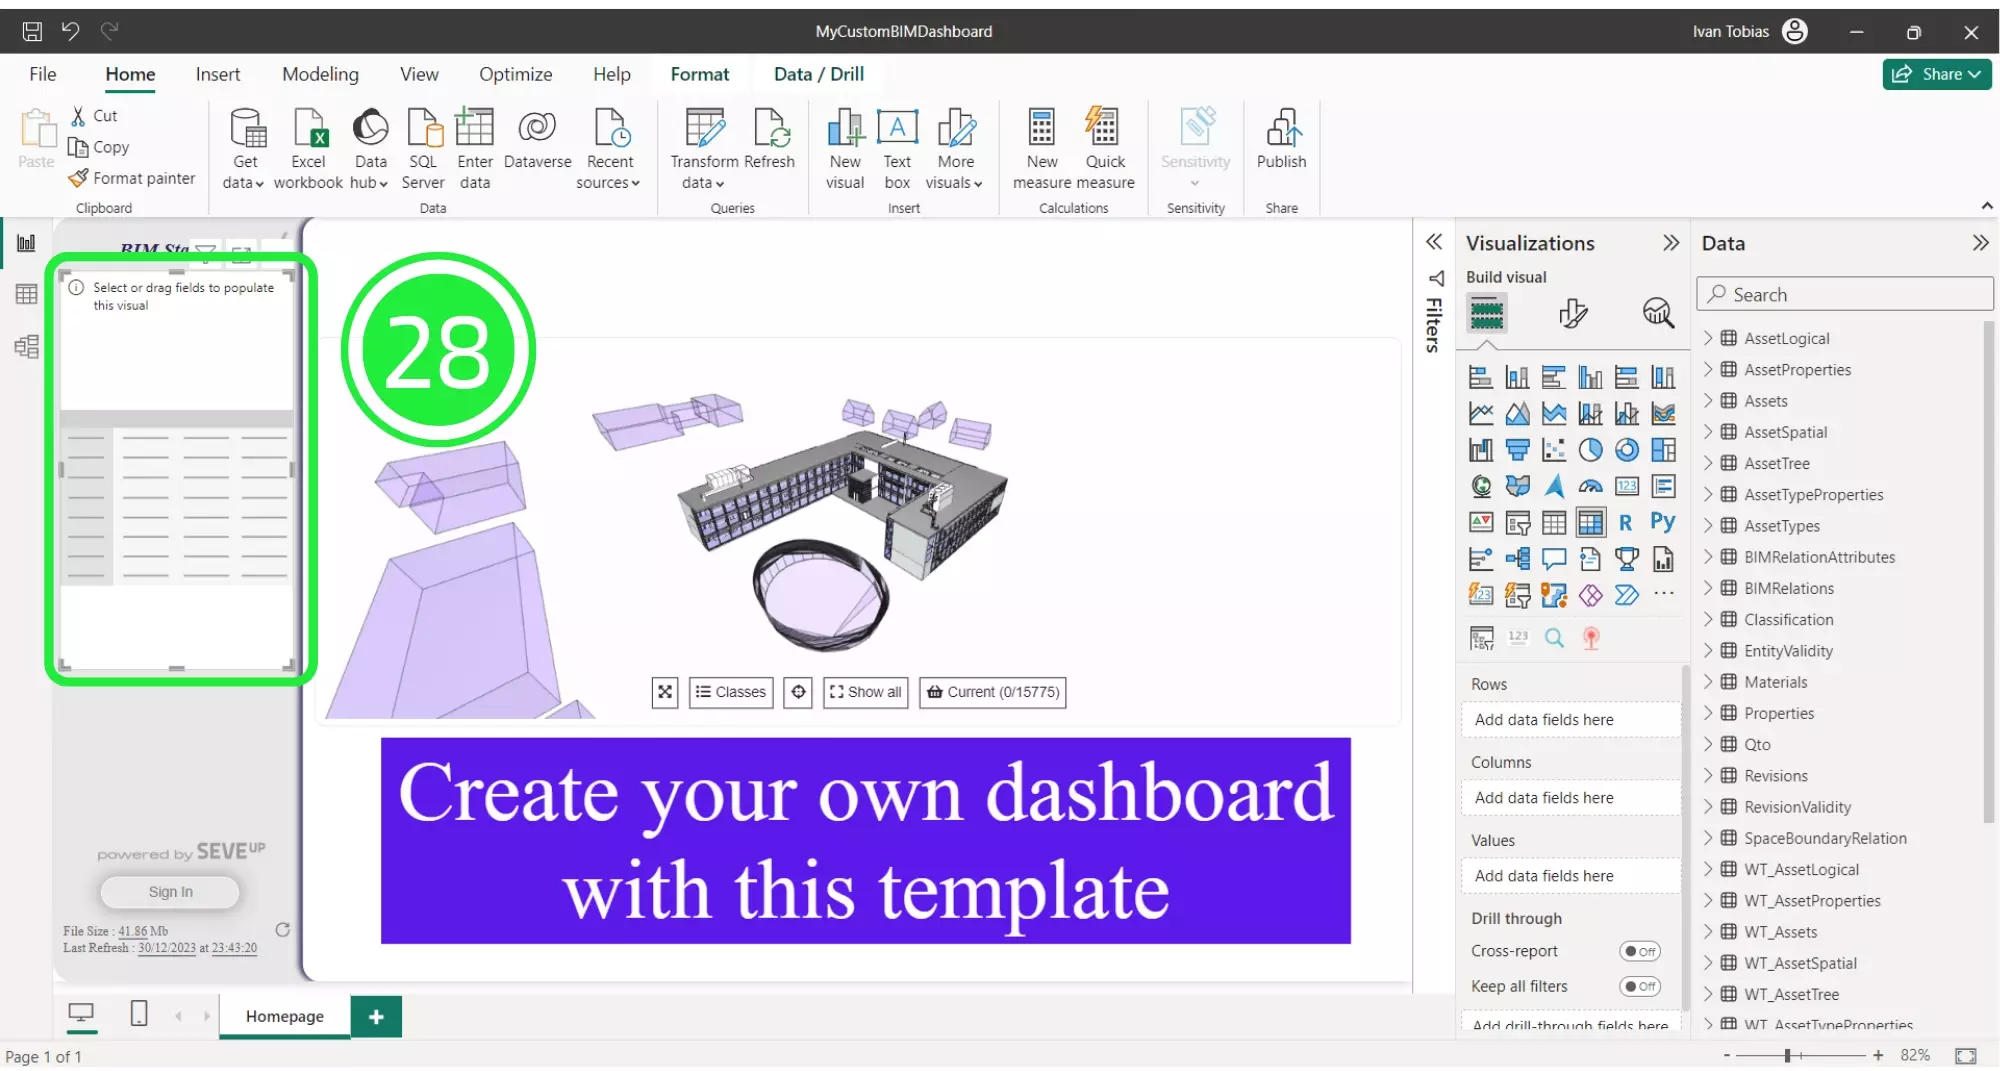
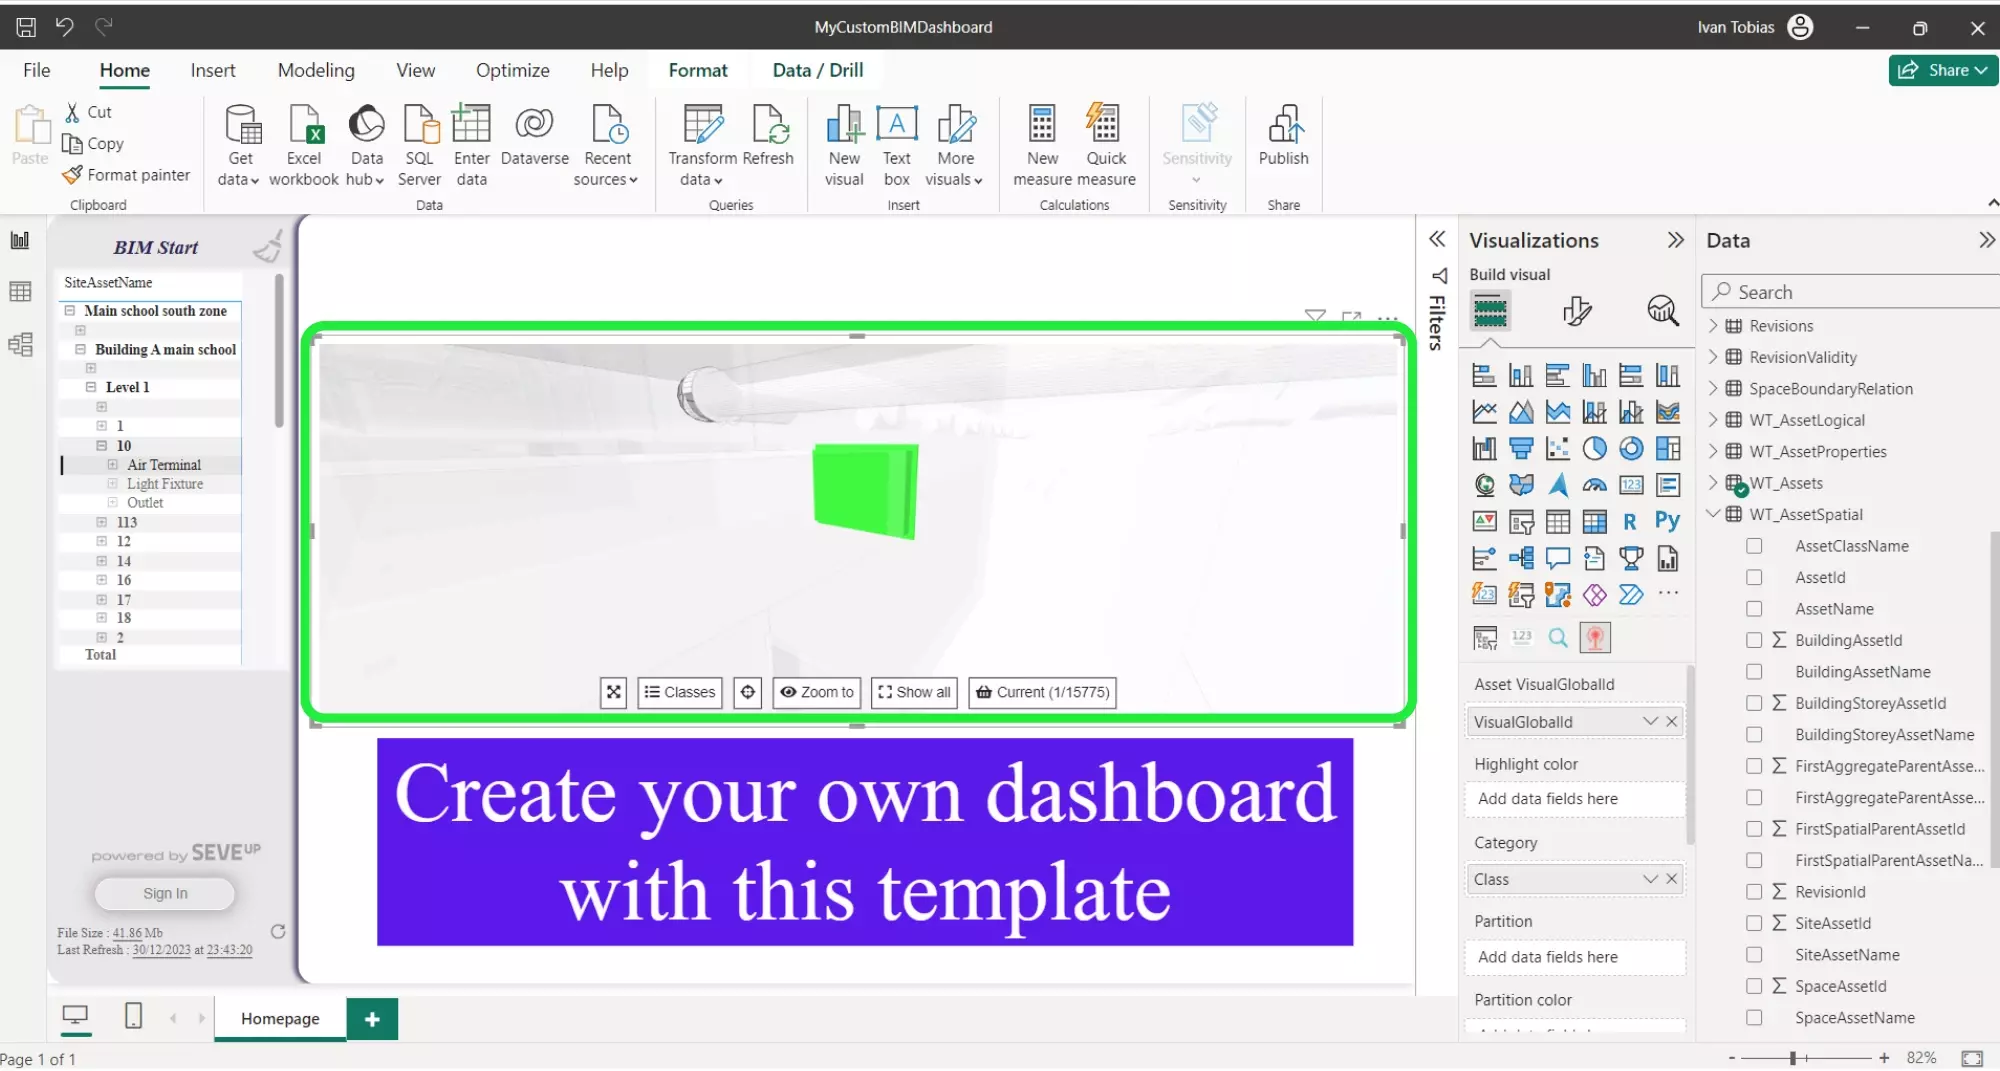
Incorporate a “Matrix” visual from the “Visualisations” pane for a comprehensive BIM dashboard.

Strategically place visuals to ensure unobstructed views of the 3D BIM Viewer in Power BI.

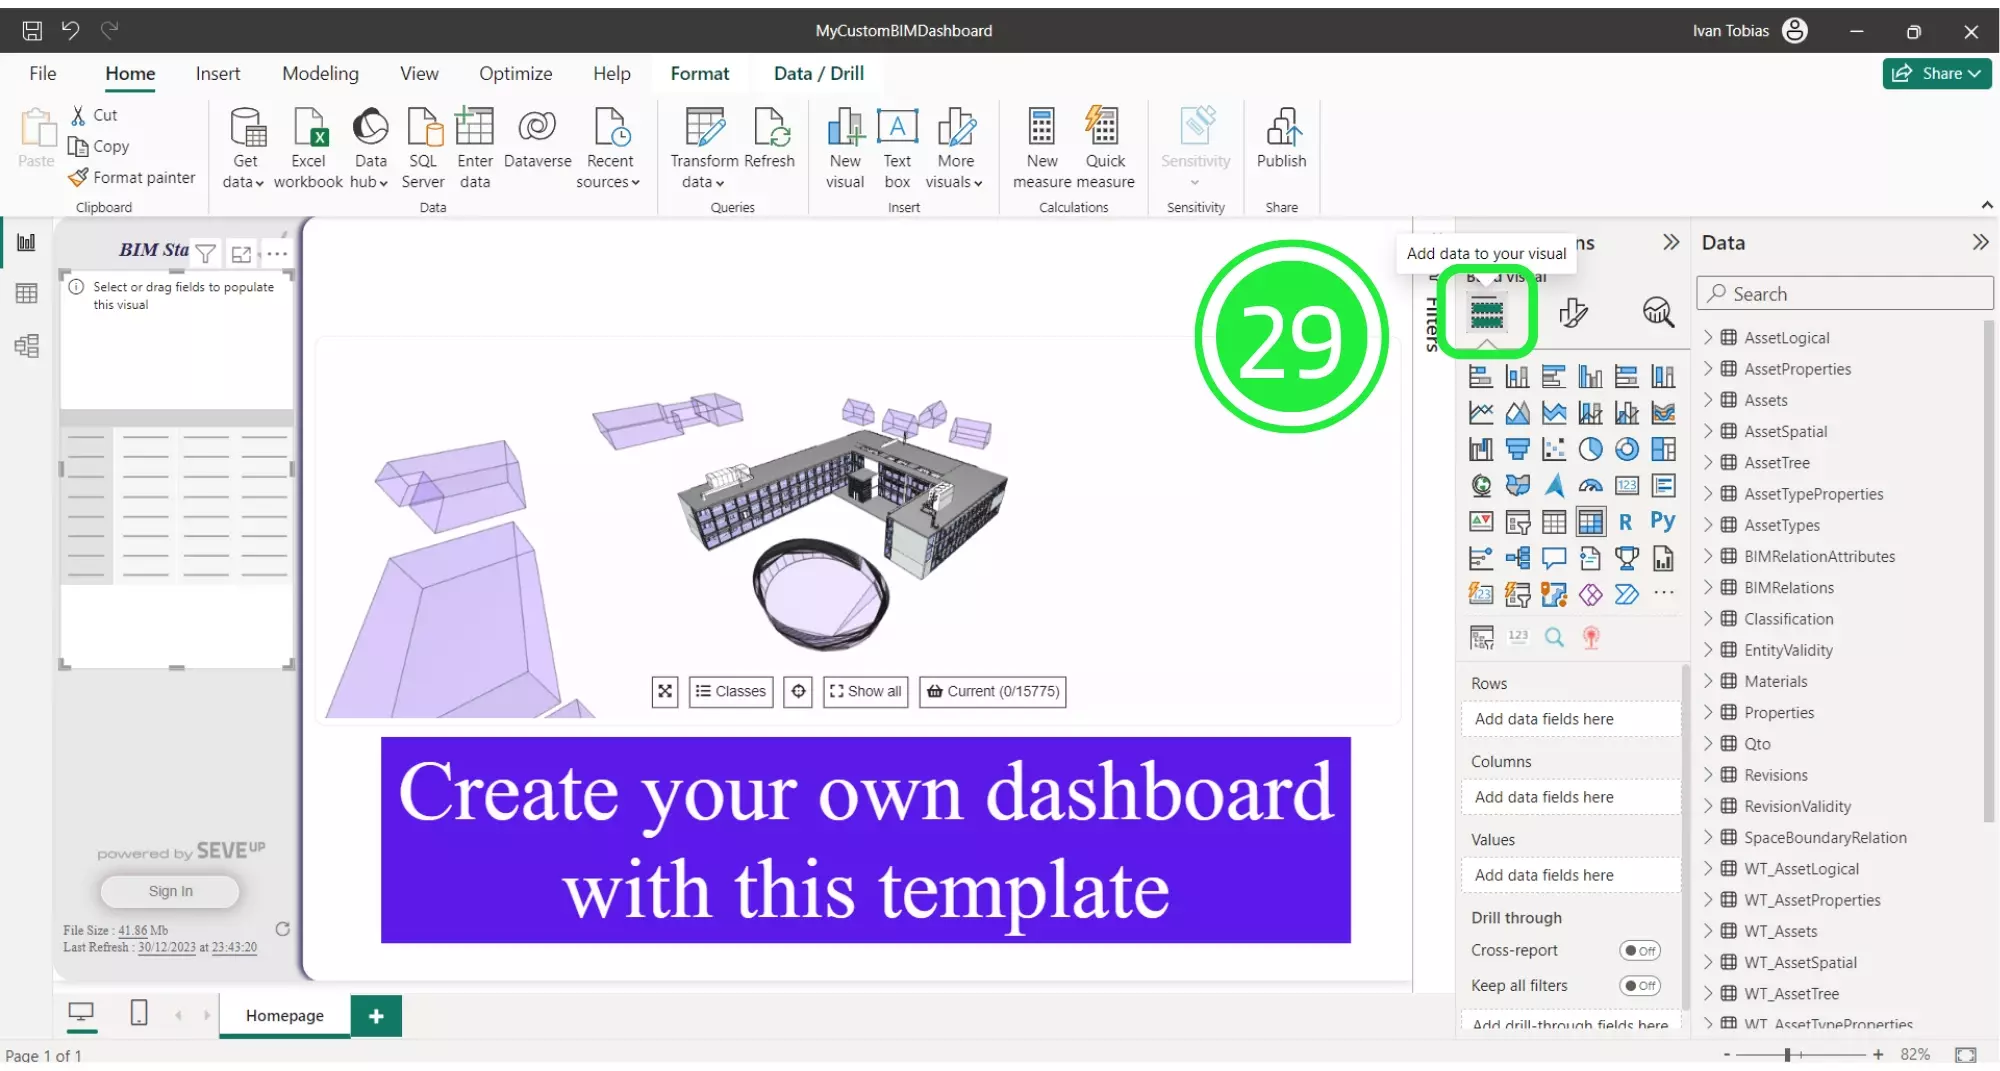
Ensure data is added to visuals for in-depth analysis within your Power BI BIM Spatial Tree.
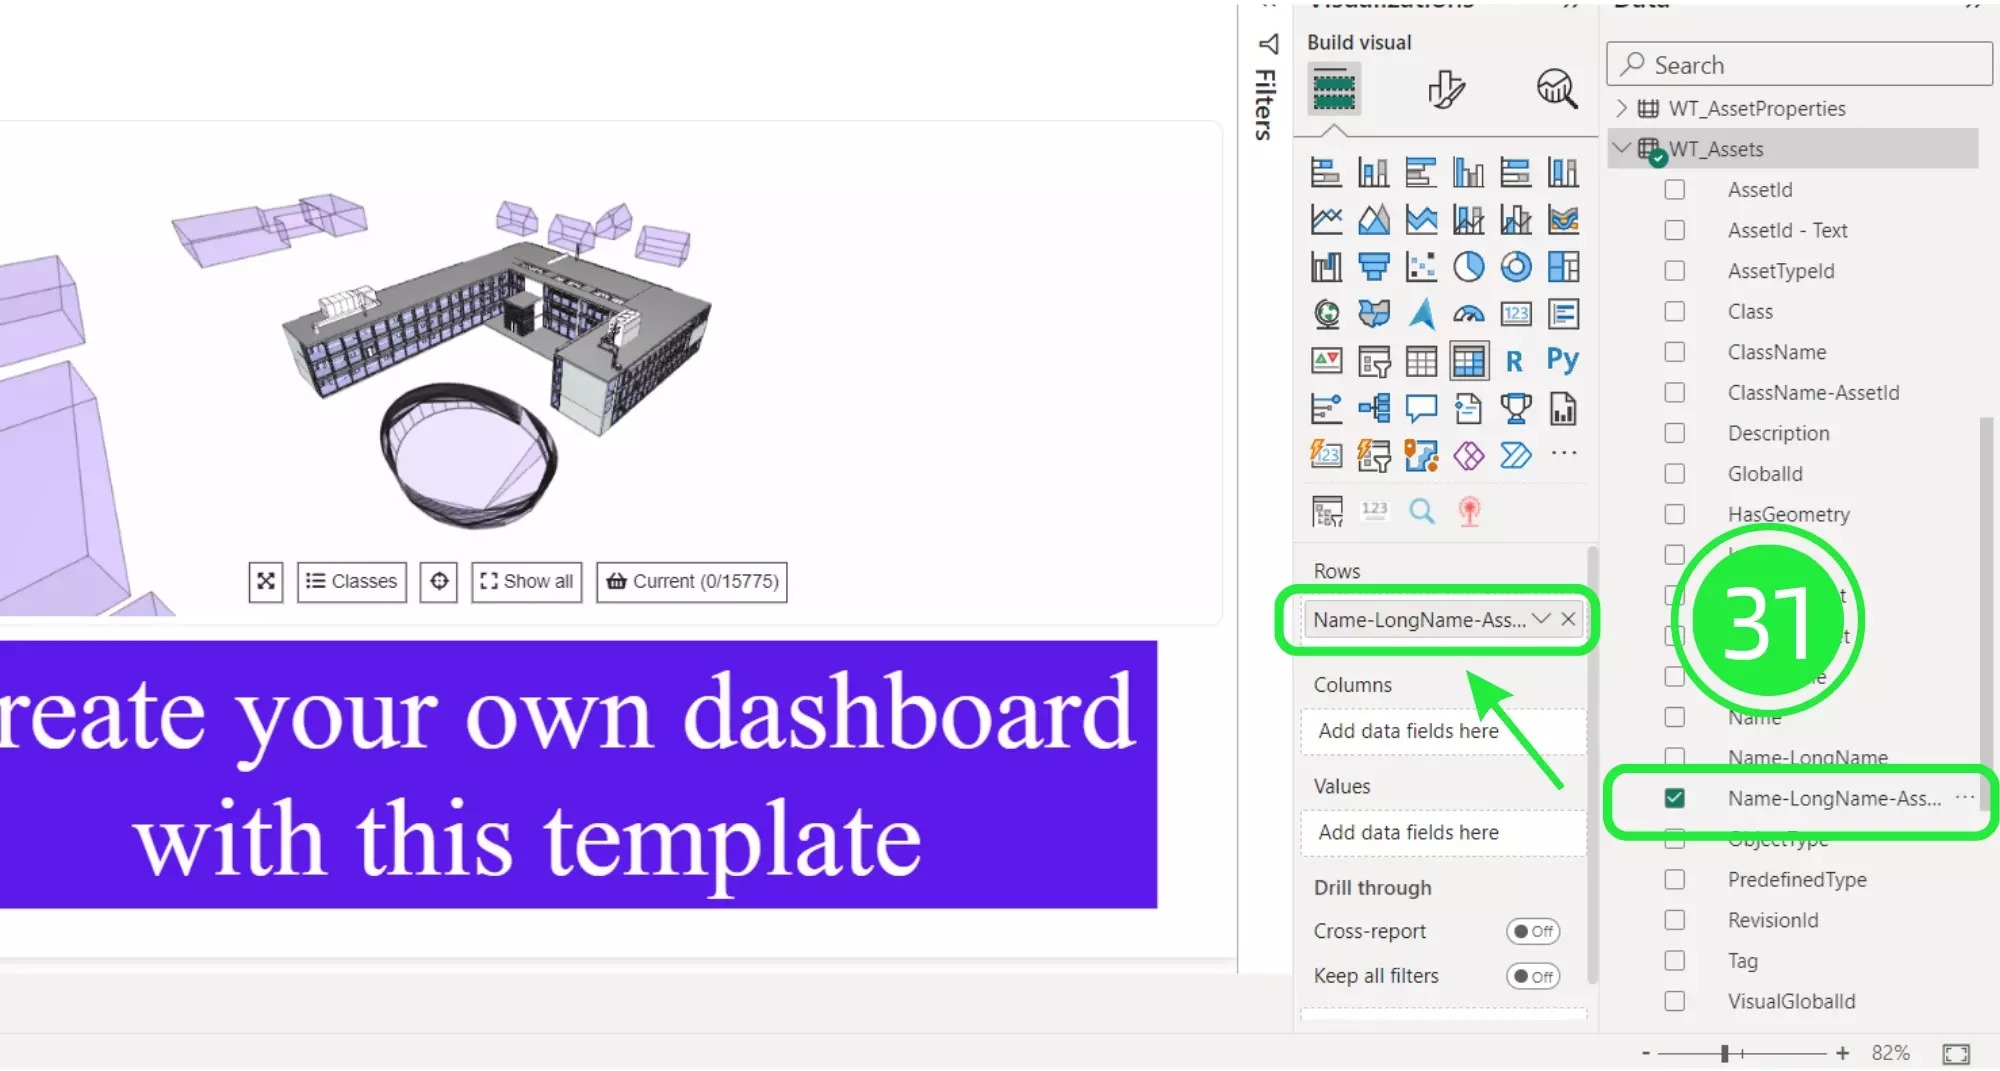
Instructions to select and expand “WT_Assets” for detailed asset management within Power BI.
Guide on dragging “Name-LongName-AssetID” to “Rows” for asset identification in the Power BI BIM Spatial Tree.
Detailed steps to add spatial and hierarchical data for a rich BIM visualization in Power BI.
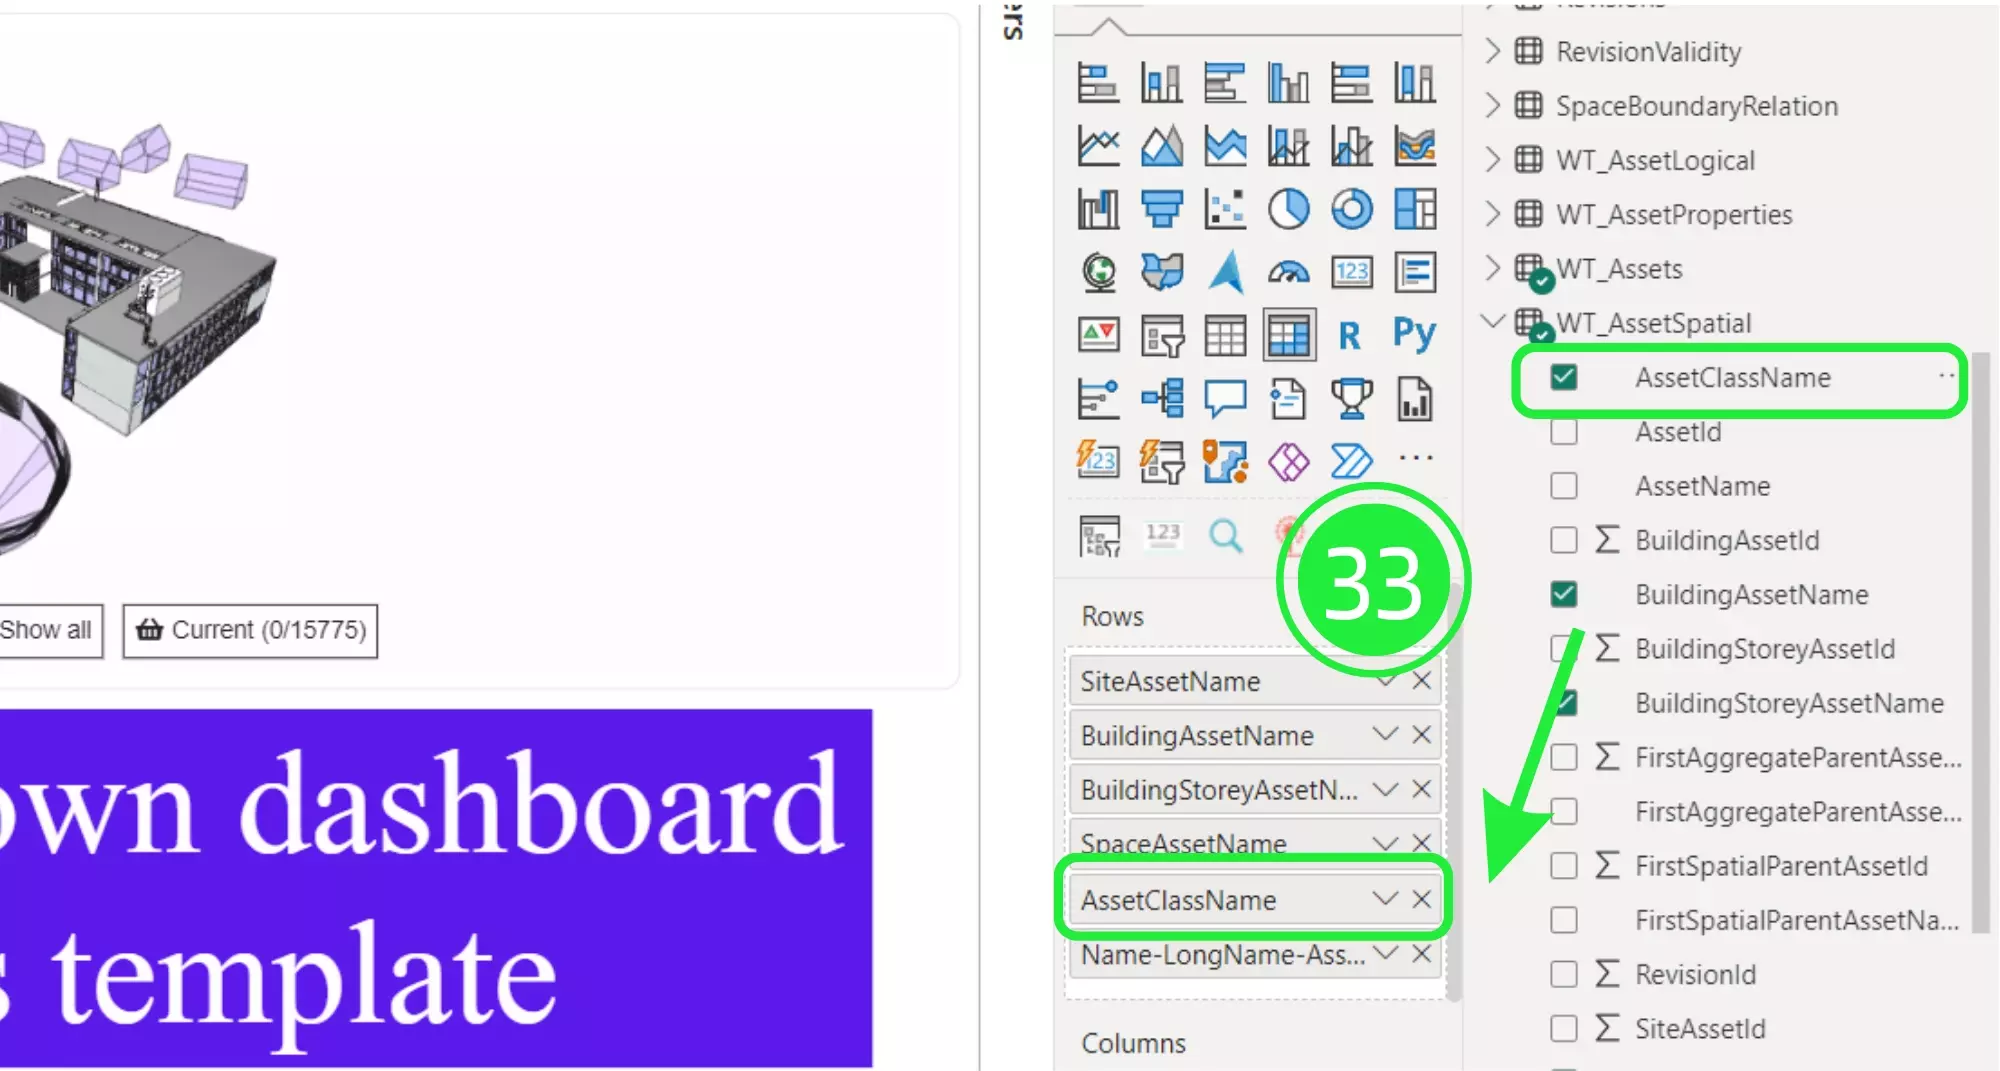
Instructions on adding “AssetClassName” to visuals for a more organized Power BI BIM Spatial Tree.
How to select “Air Terminal” within the Matrix visual for targeted asset analysis in the BIM Viewer.
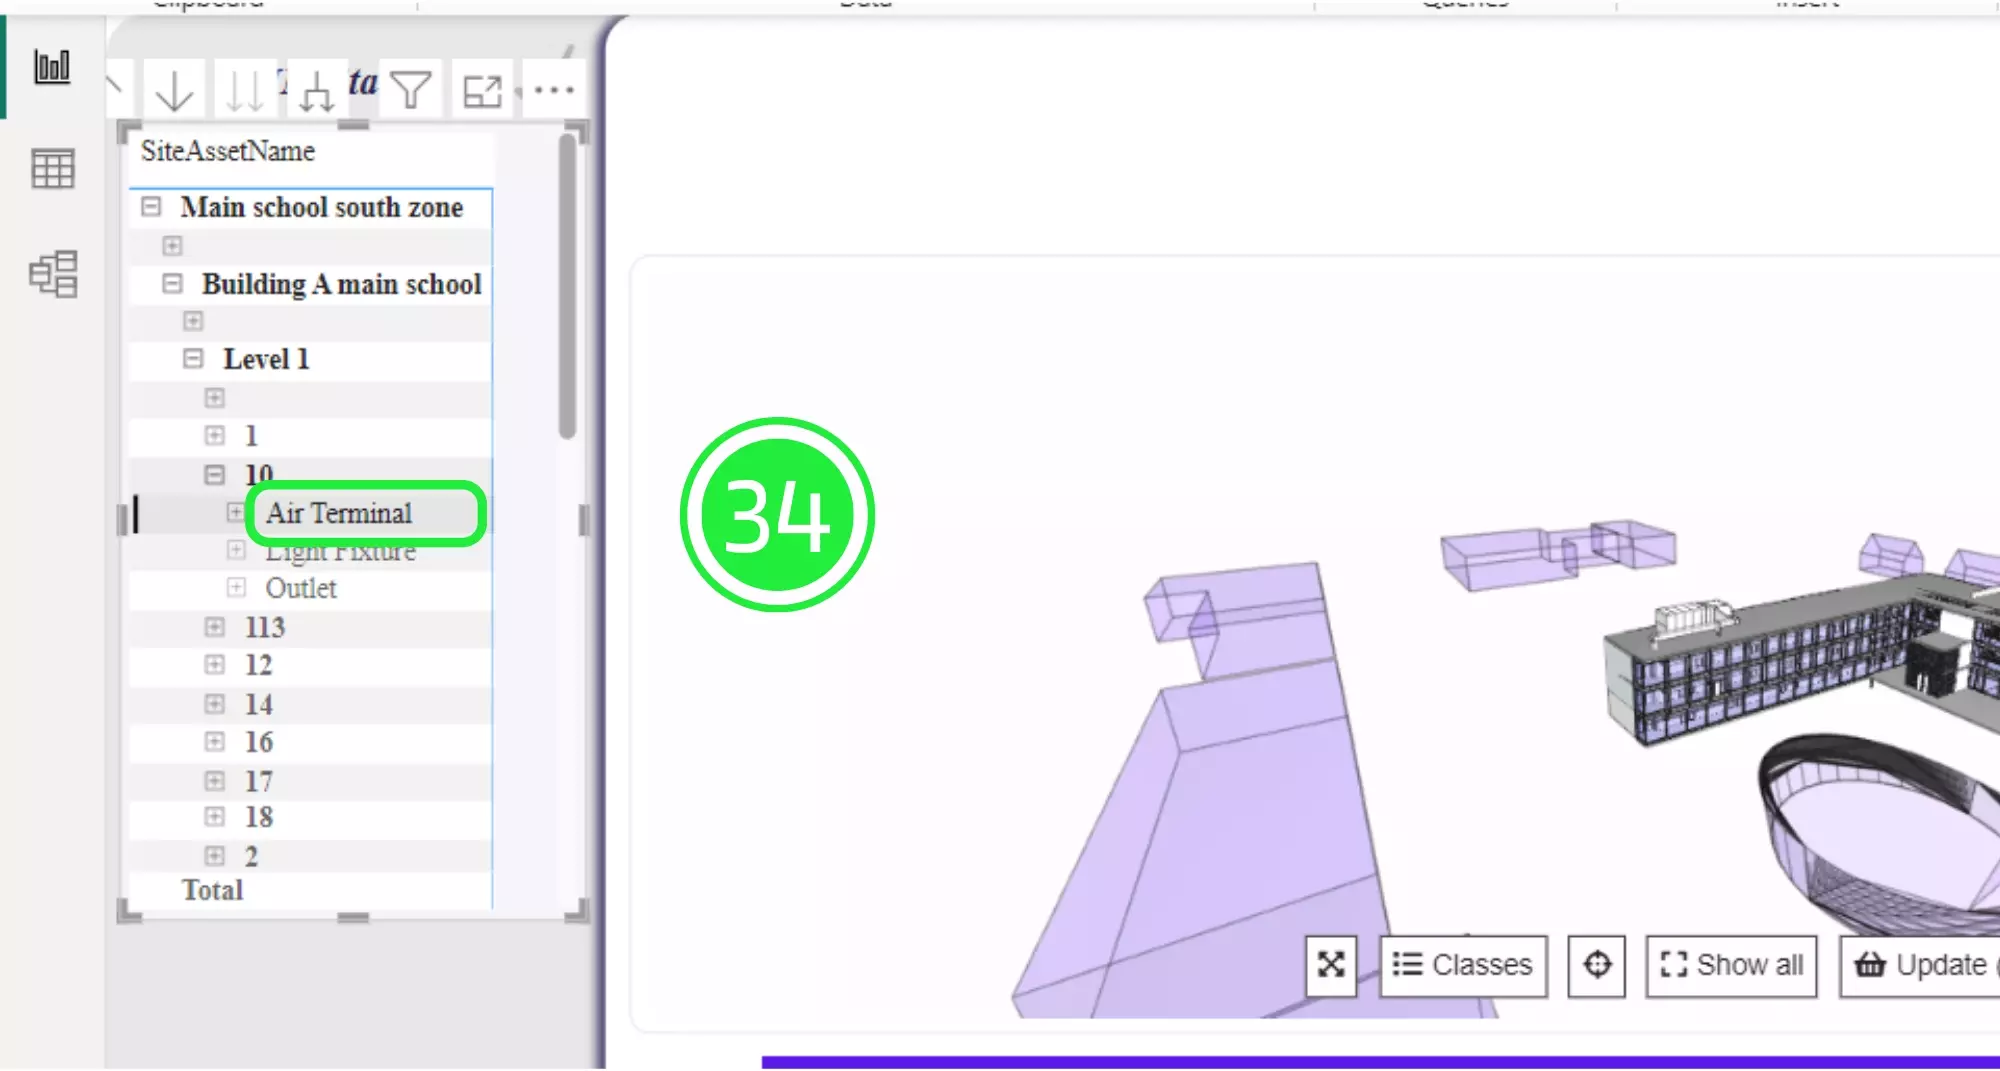
Steps to update the BIM Viewer in Power BI, showcasing the selected assets.

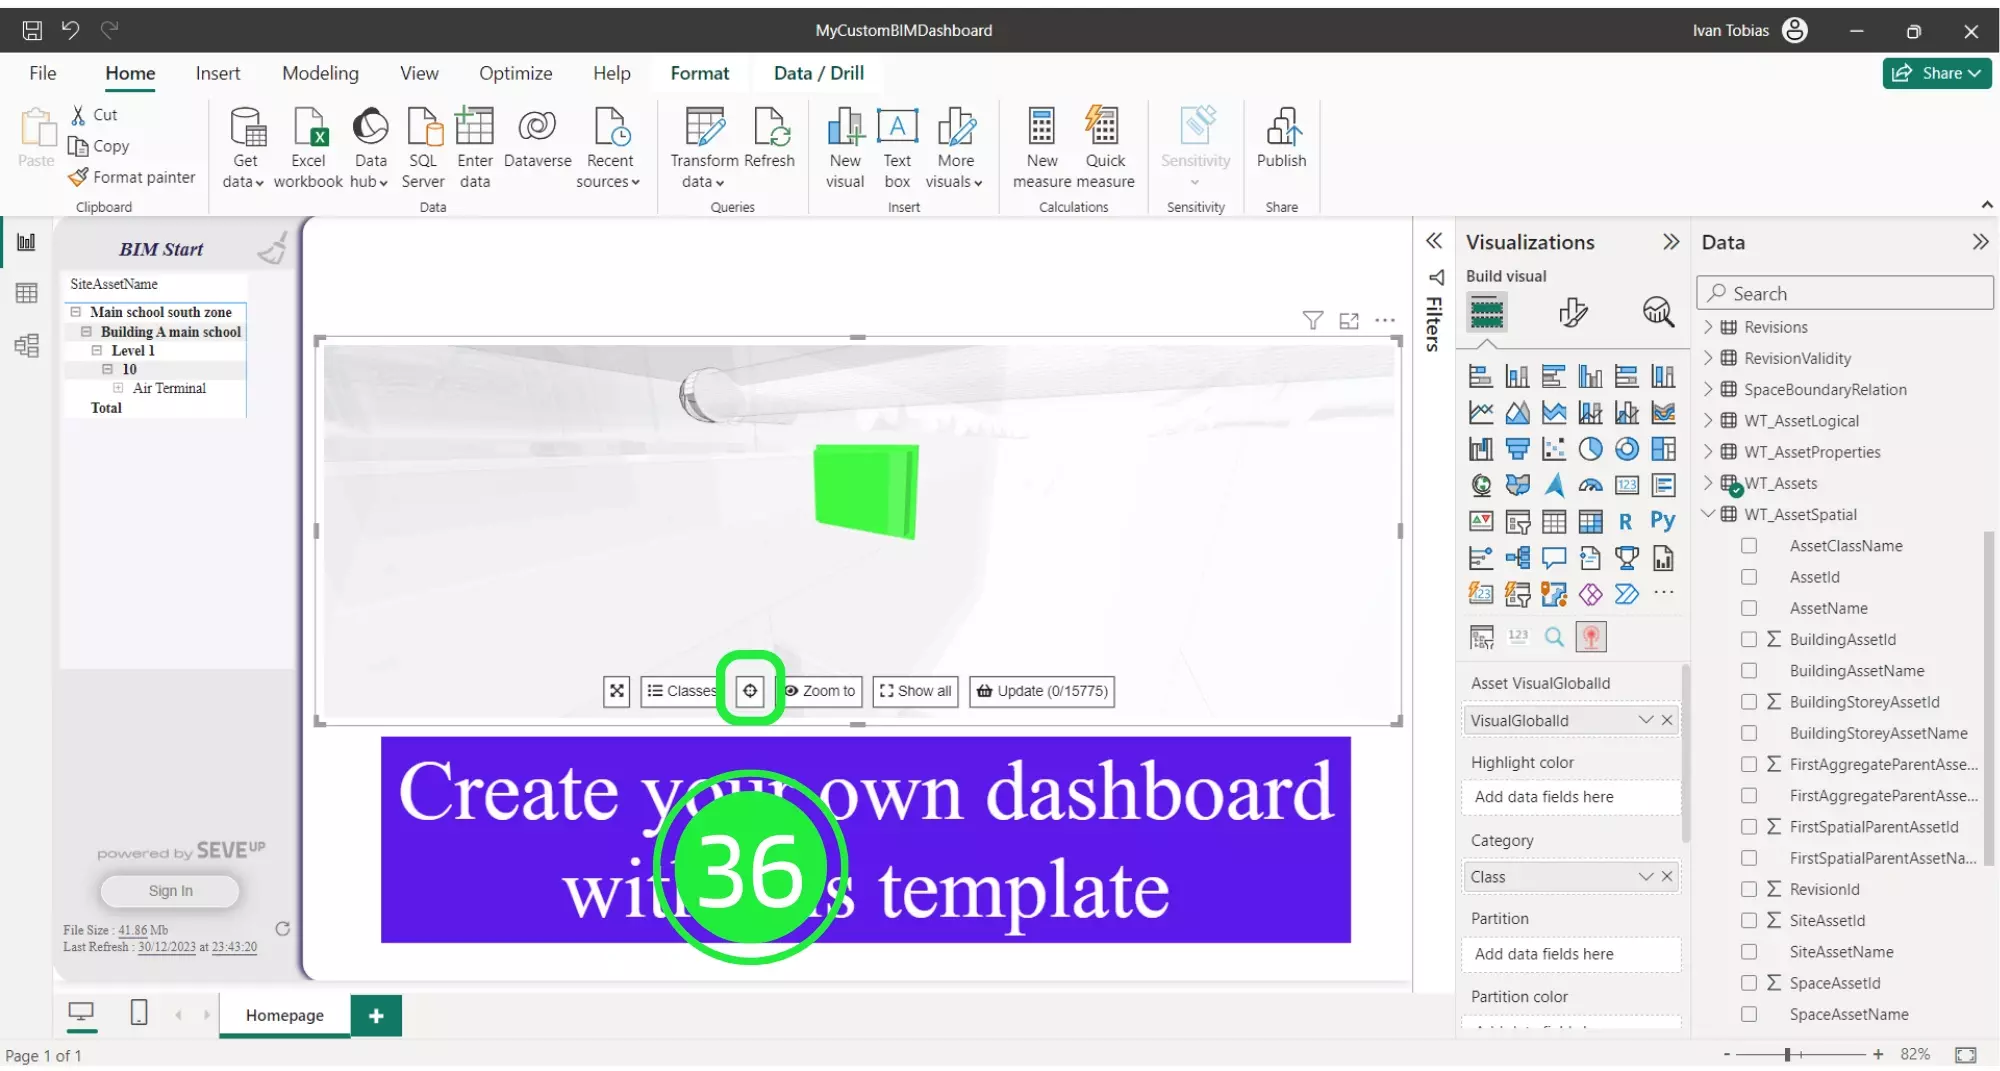
Guiding the use of “Selection” button to access tooltip information for in-depth asset details.
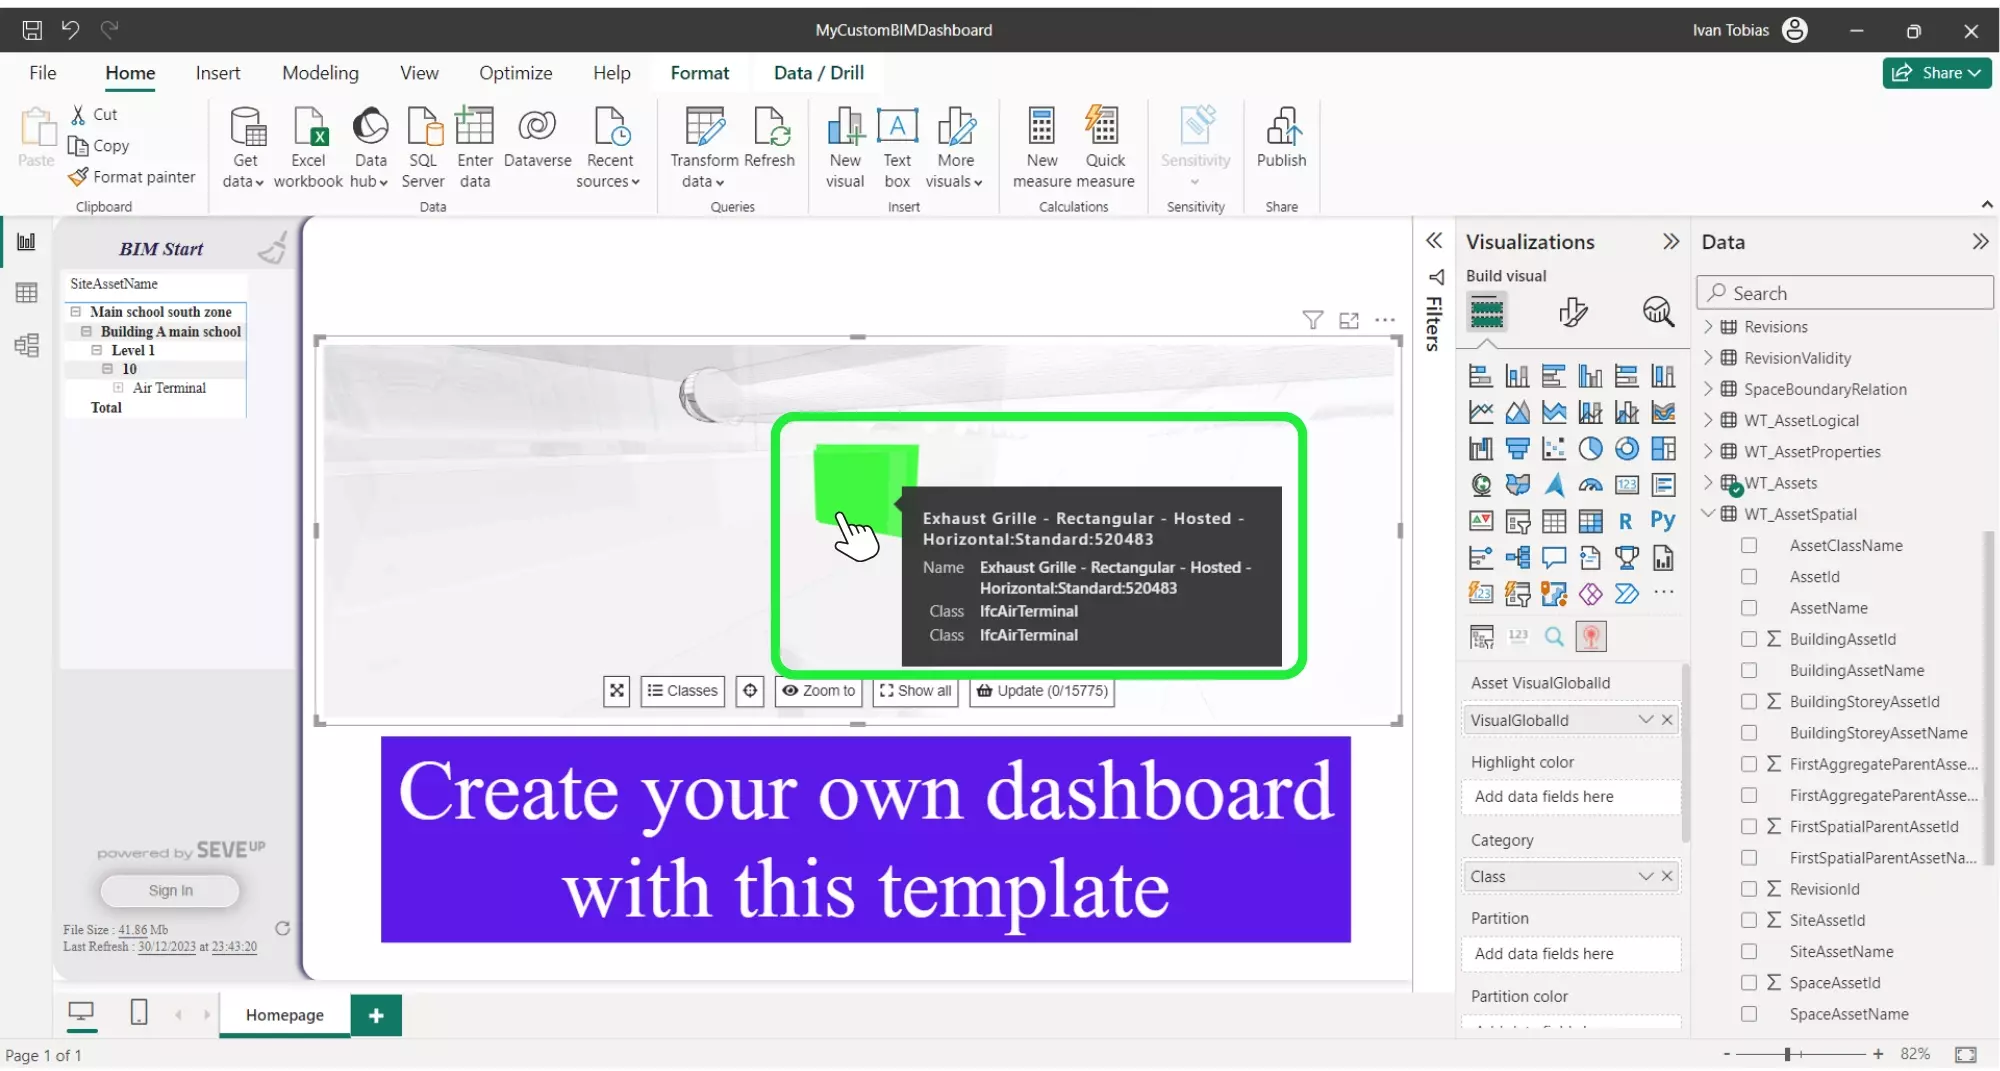
Hover over assets for tooltip data, enriching the Power BI BIM Spatial Tree experience.
Then hover your cursor over the asset for the tooltip information to be displayed.
You can make any selection you want in the “Matrix” visual then simply click on the “Update” button and it will display it within the 3D BIM Viewer.
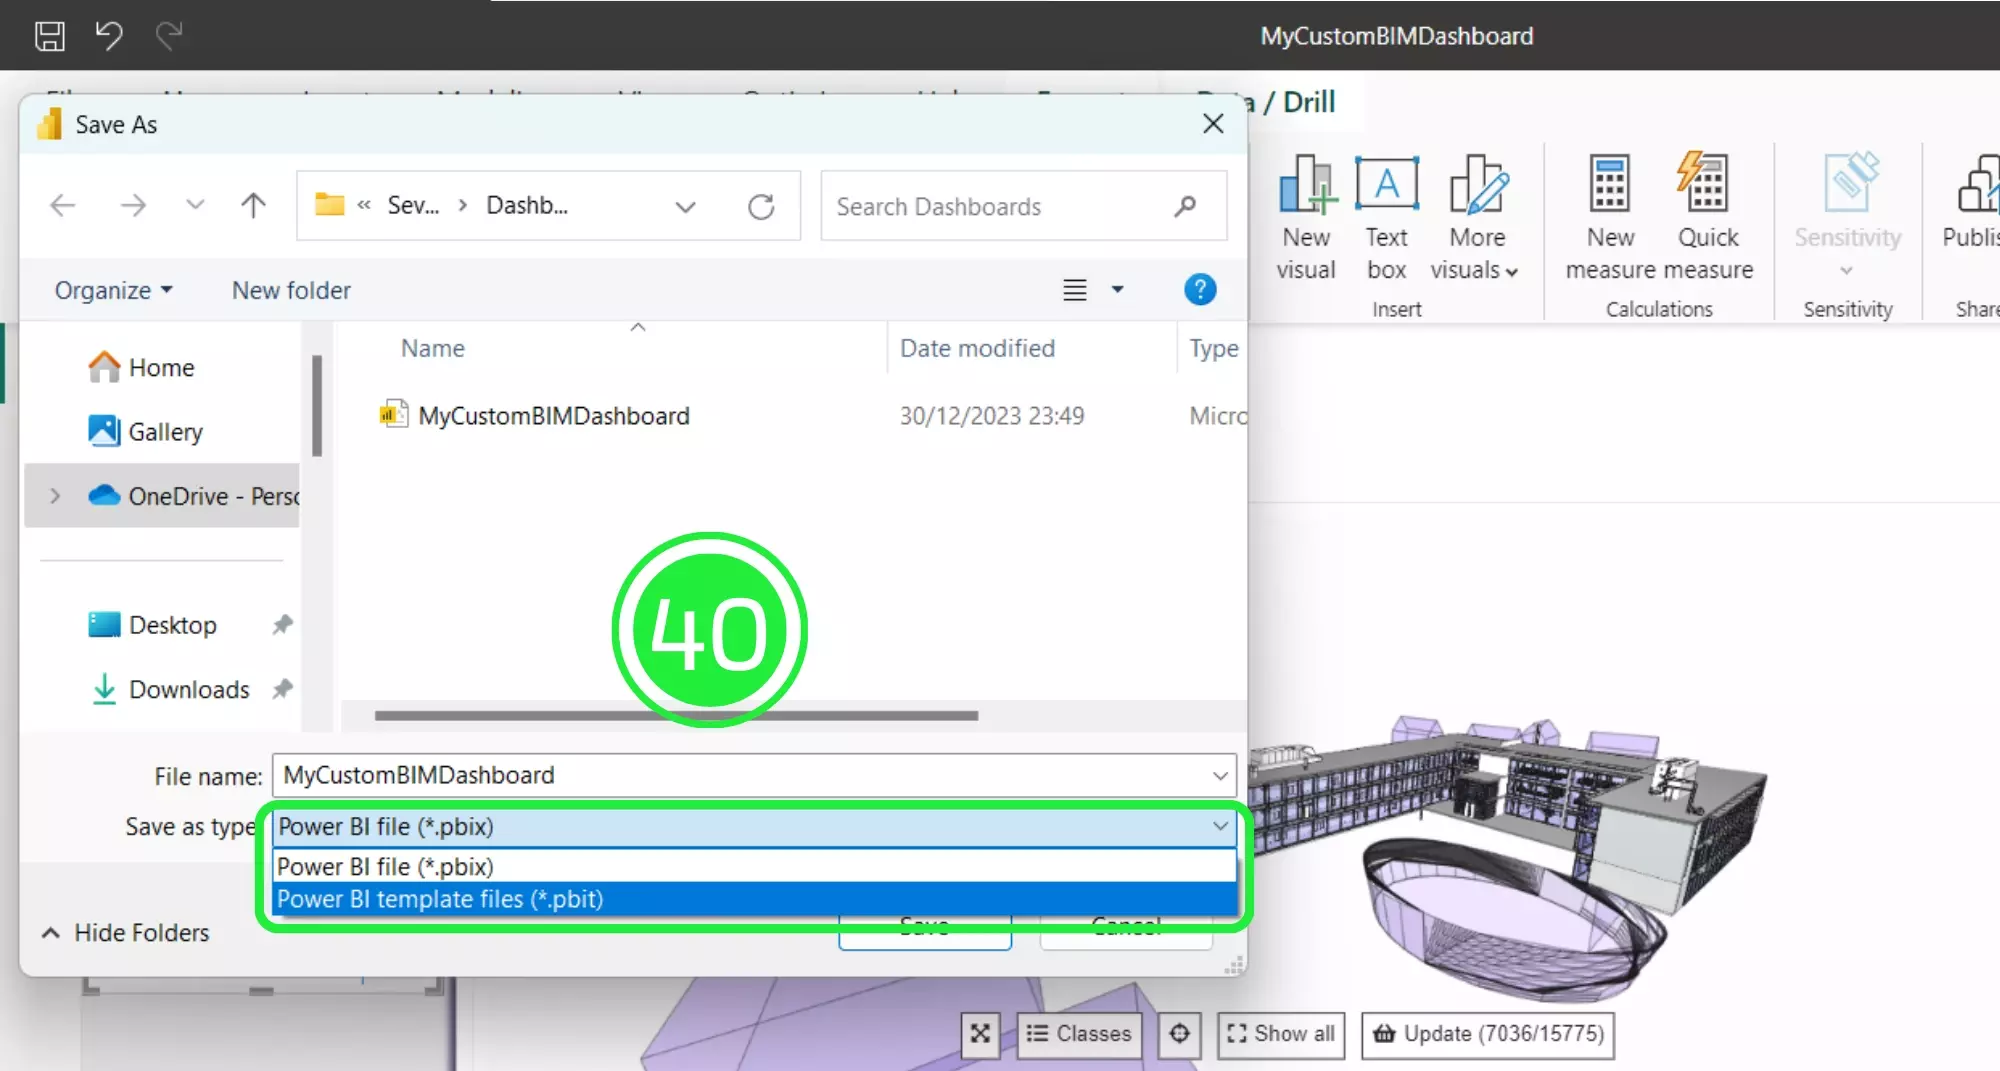
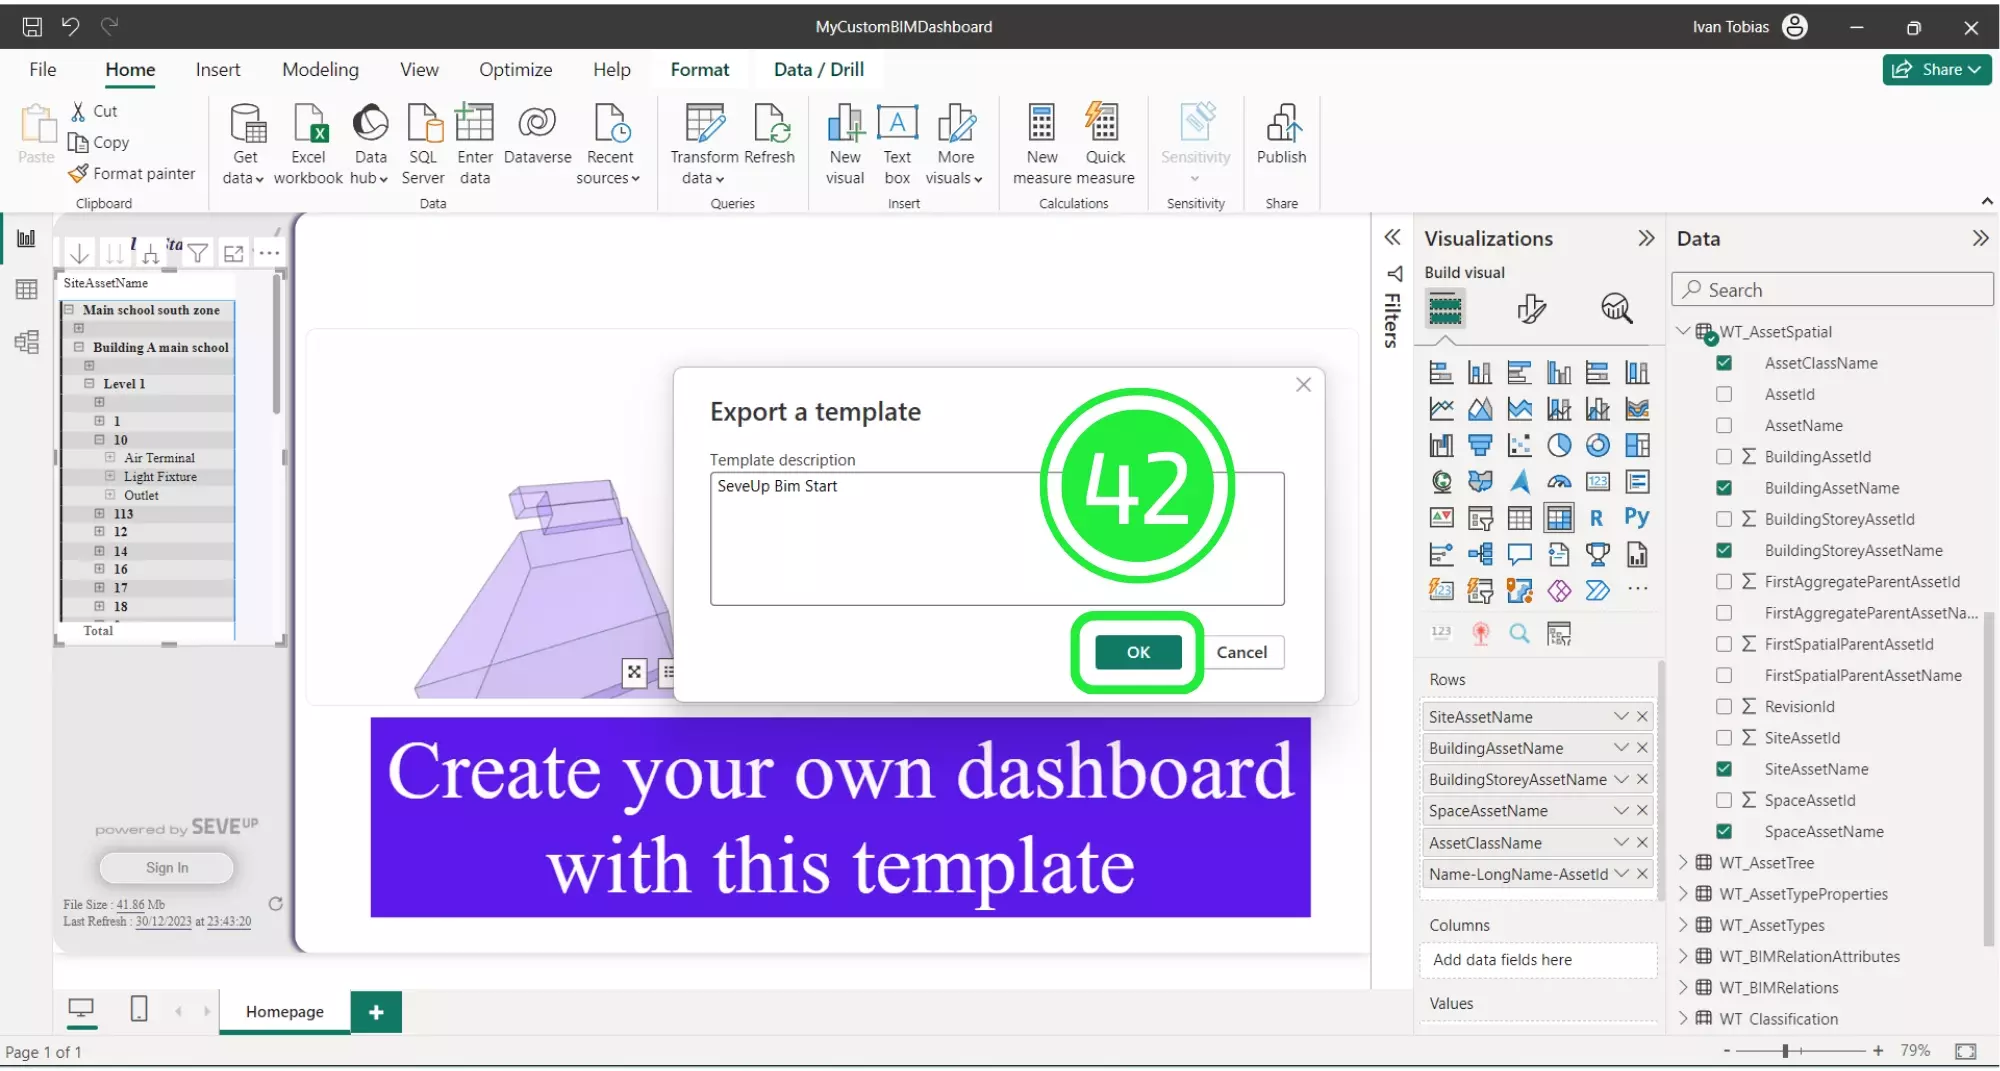
Before uploading the Power BI custom template back into the SeveUp app, it needs to be saved as a template file with the extension .PBIT. To do this click on “File” in the top left corner.
Select “Save As” from the drop down menu.
Click on “Browse this device” at the bottom of the screen.

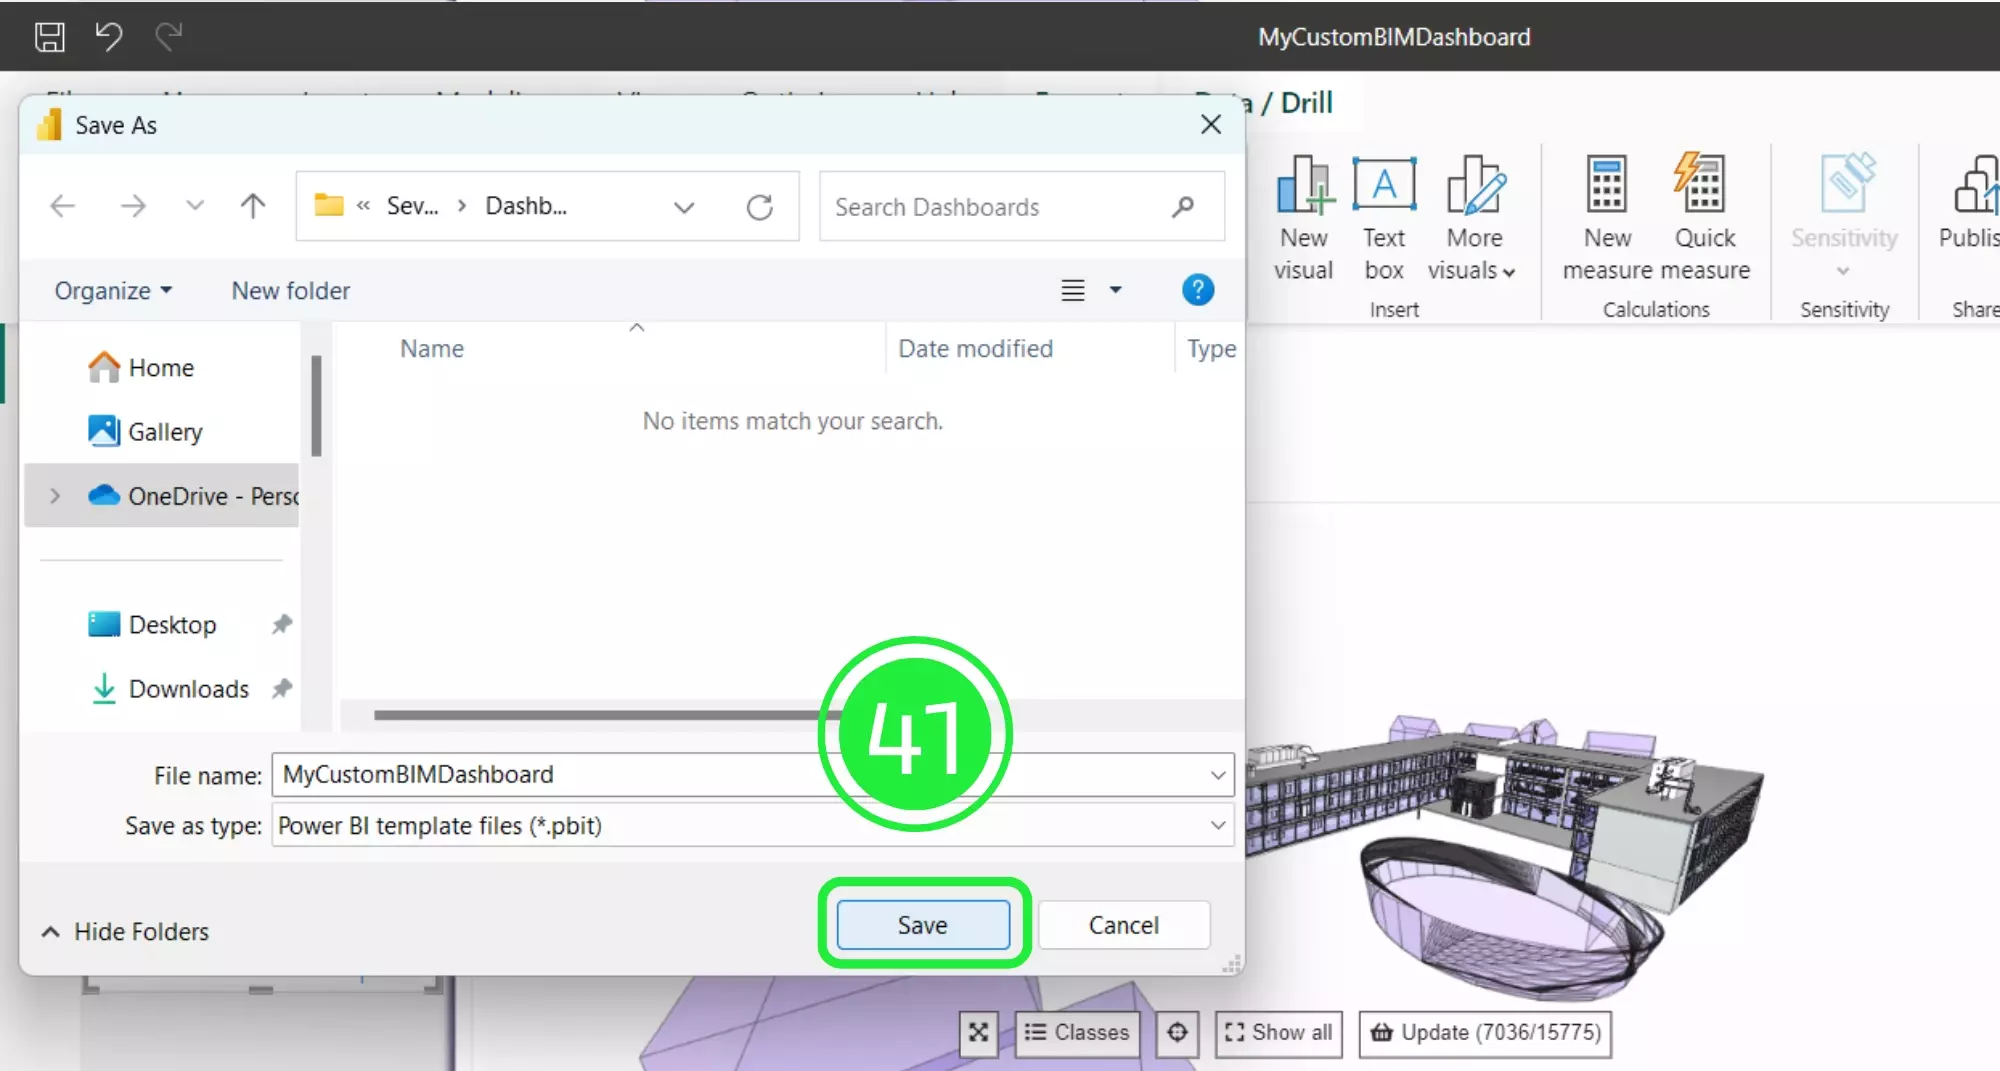
Choose to save the file as a Power BI template file (.pbit).
Click on the “Save” button to save your project to your computer.
Press on “ok” when the “Export a Template” pop-up appears.
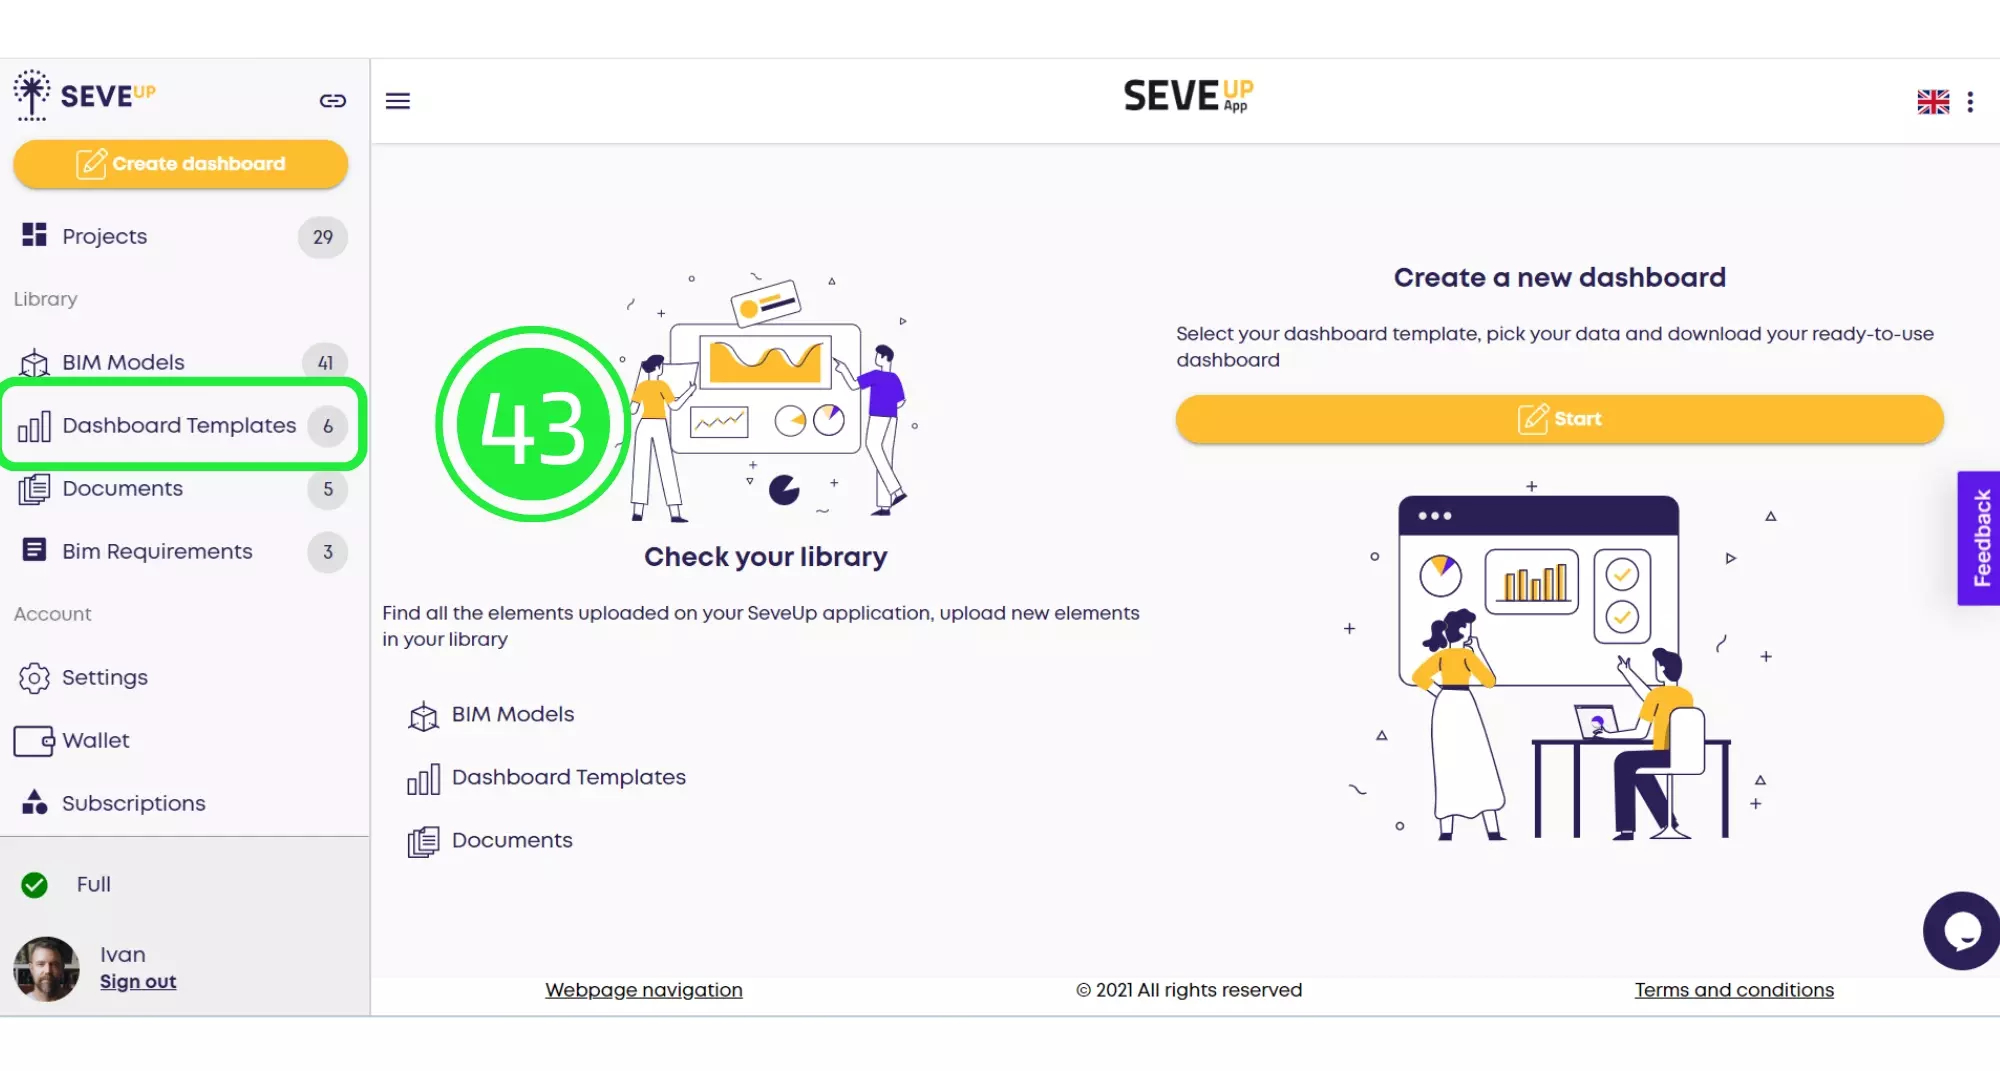
Open the SeveUp App and select Dashboard Templates on the left to begin your BIM Dashboard Configuration.
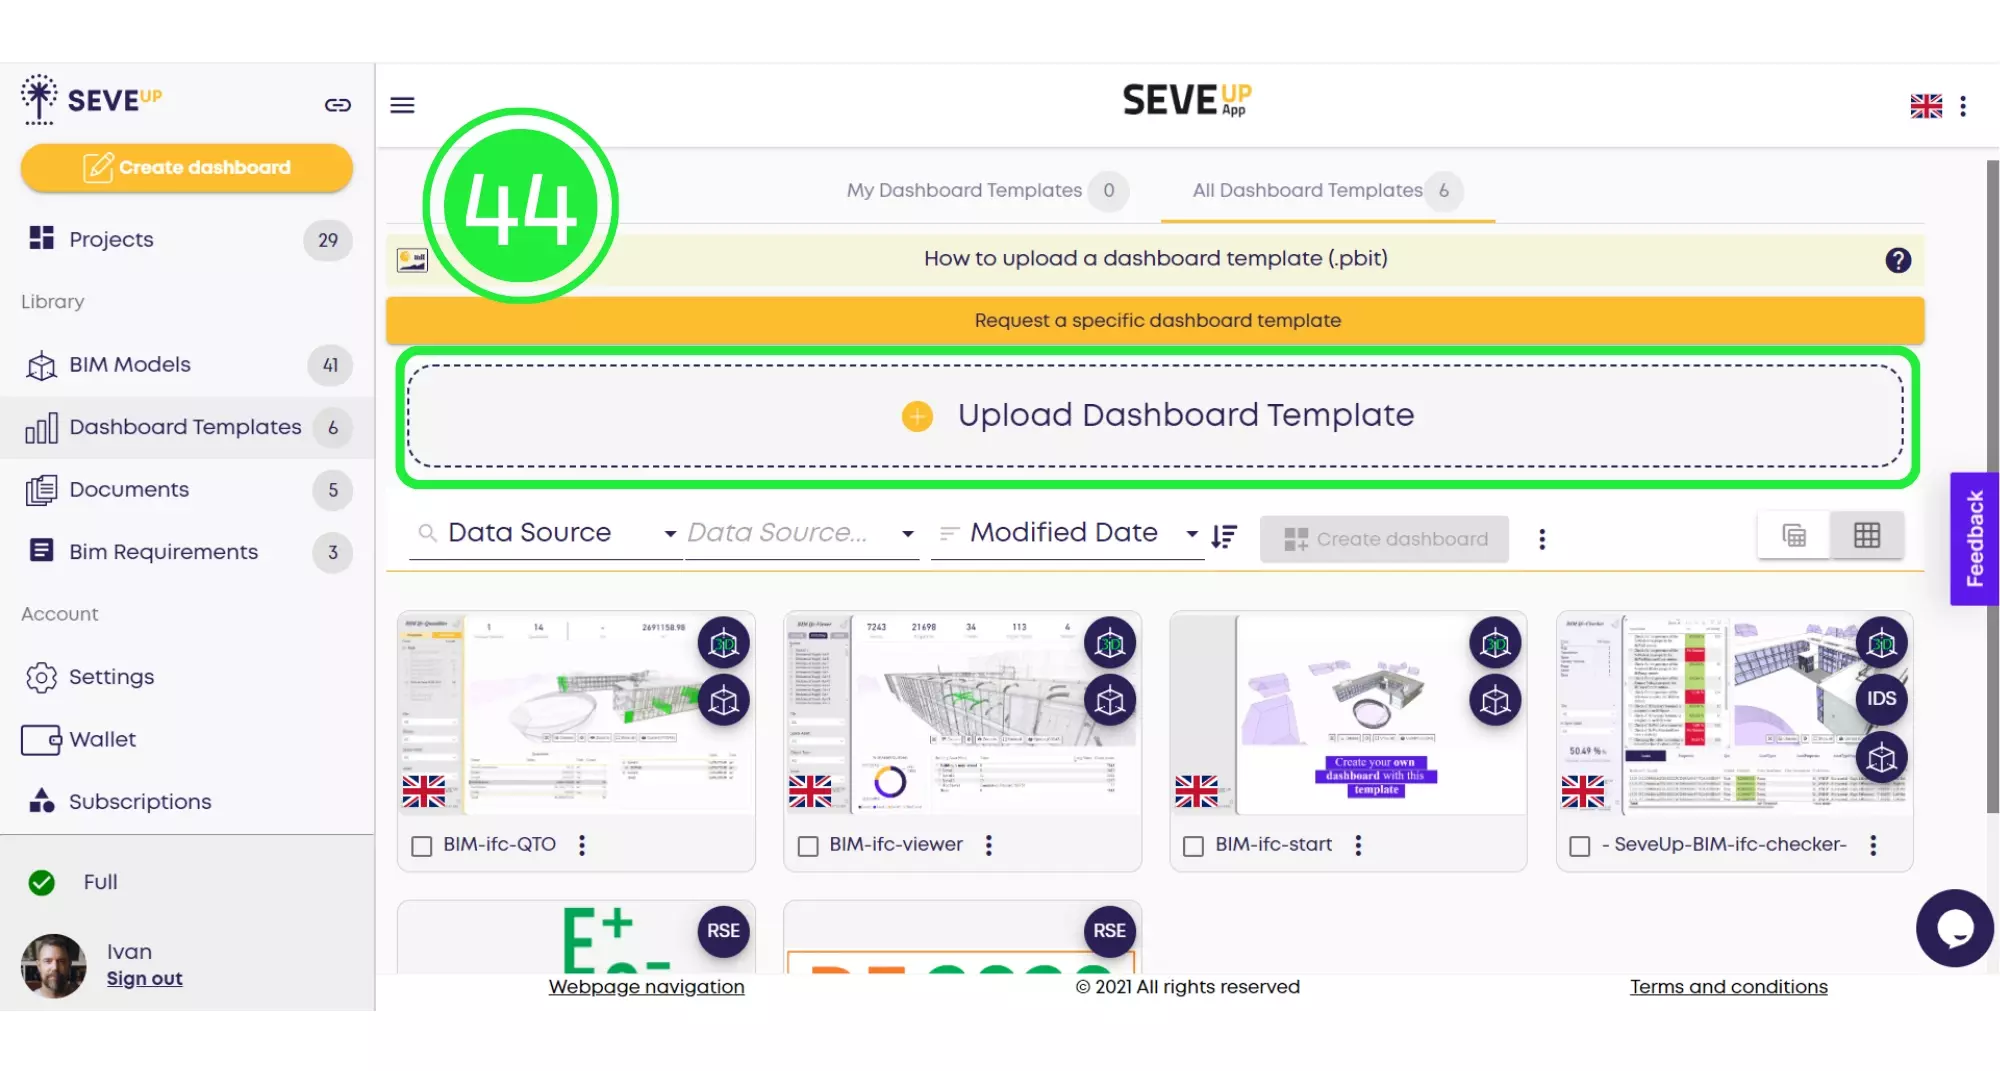
Hit the prominent Upload Dashboard Template button to integrate your custom dashboard.
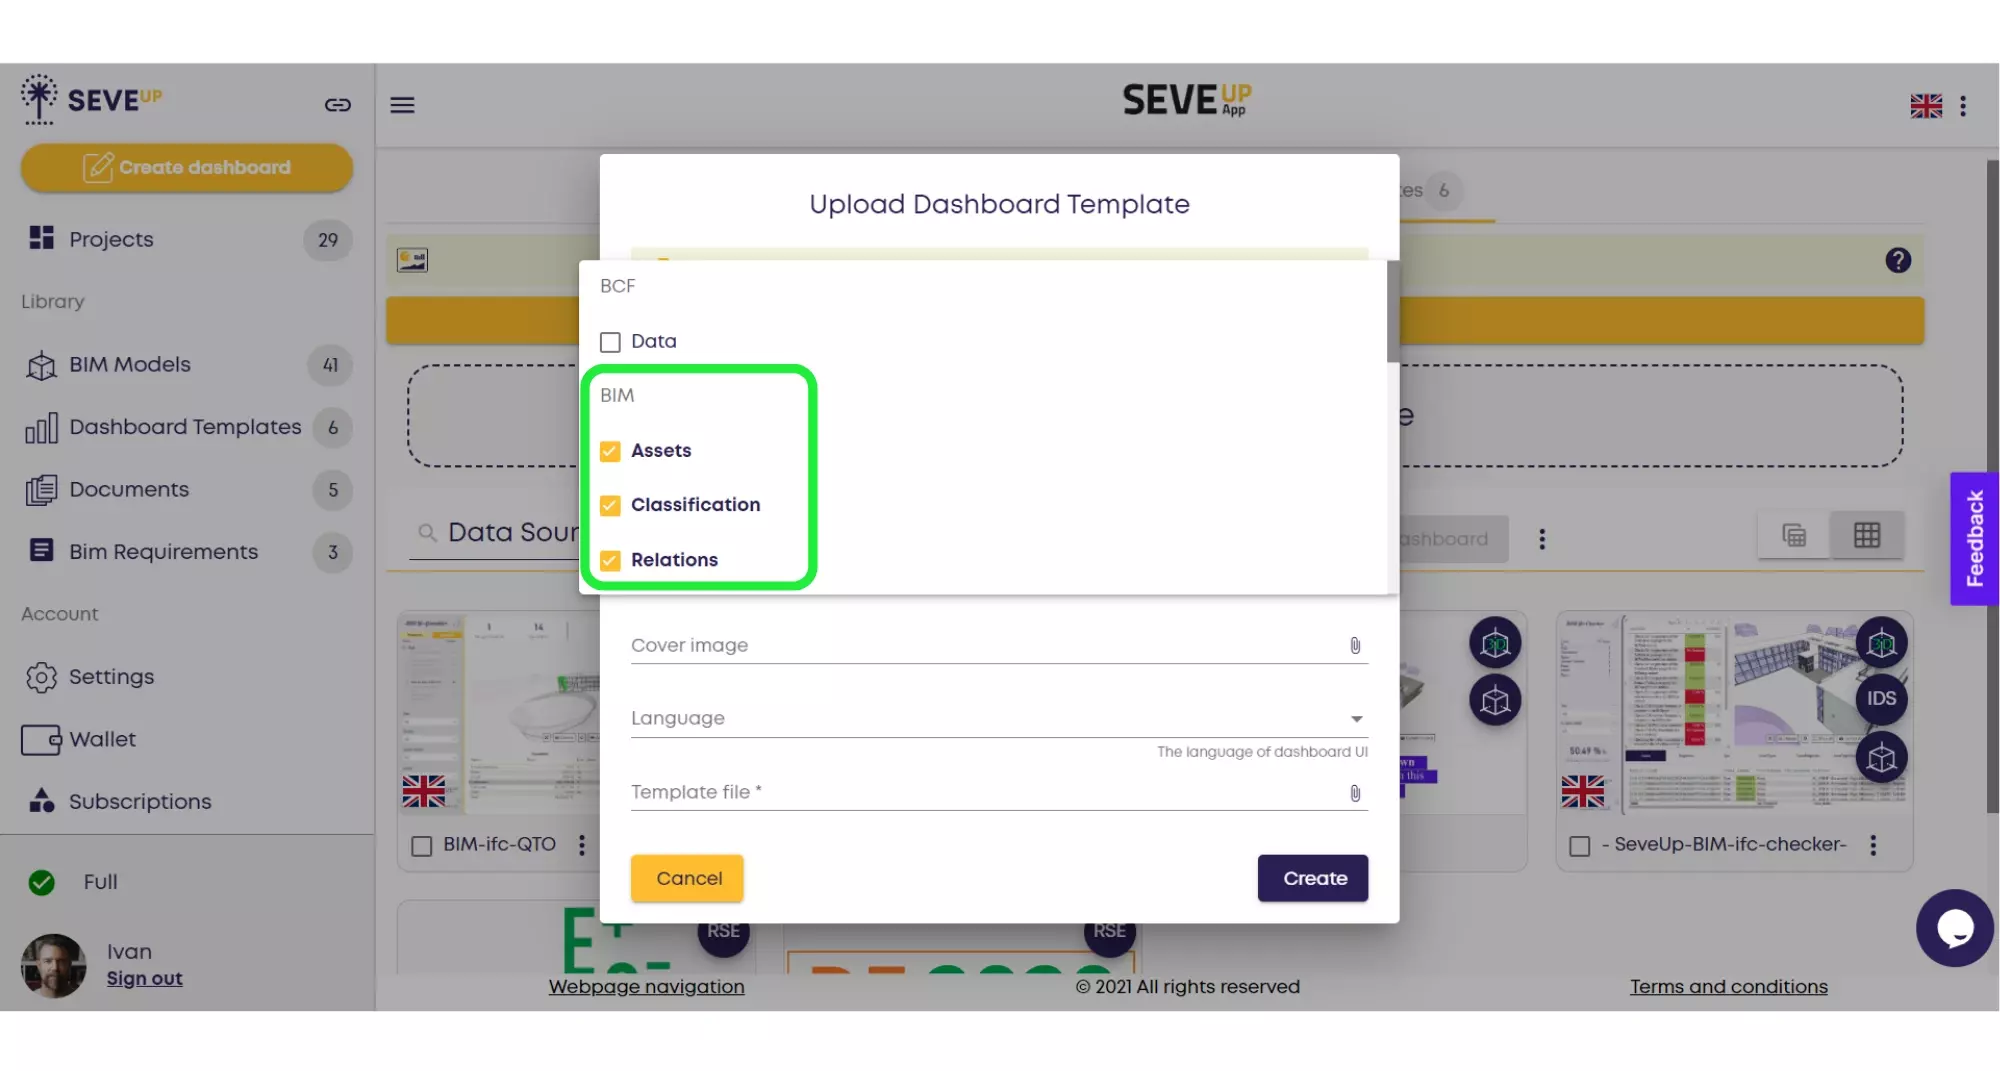
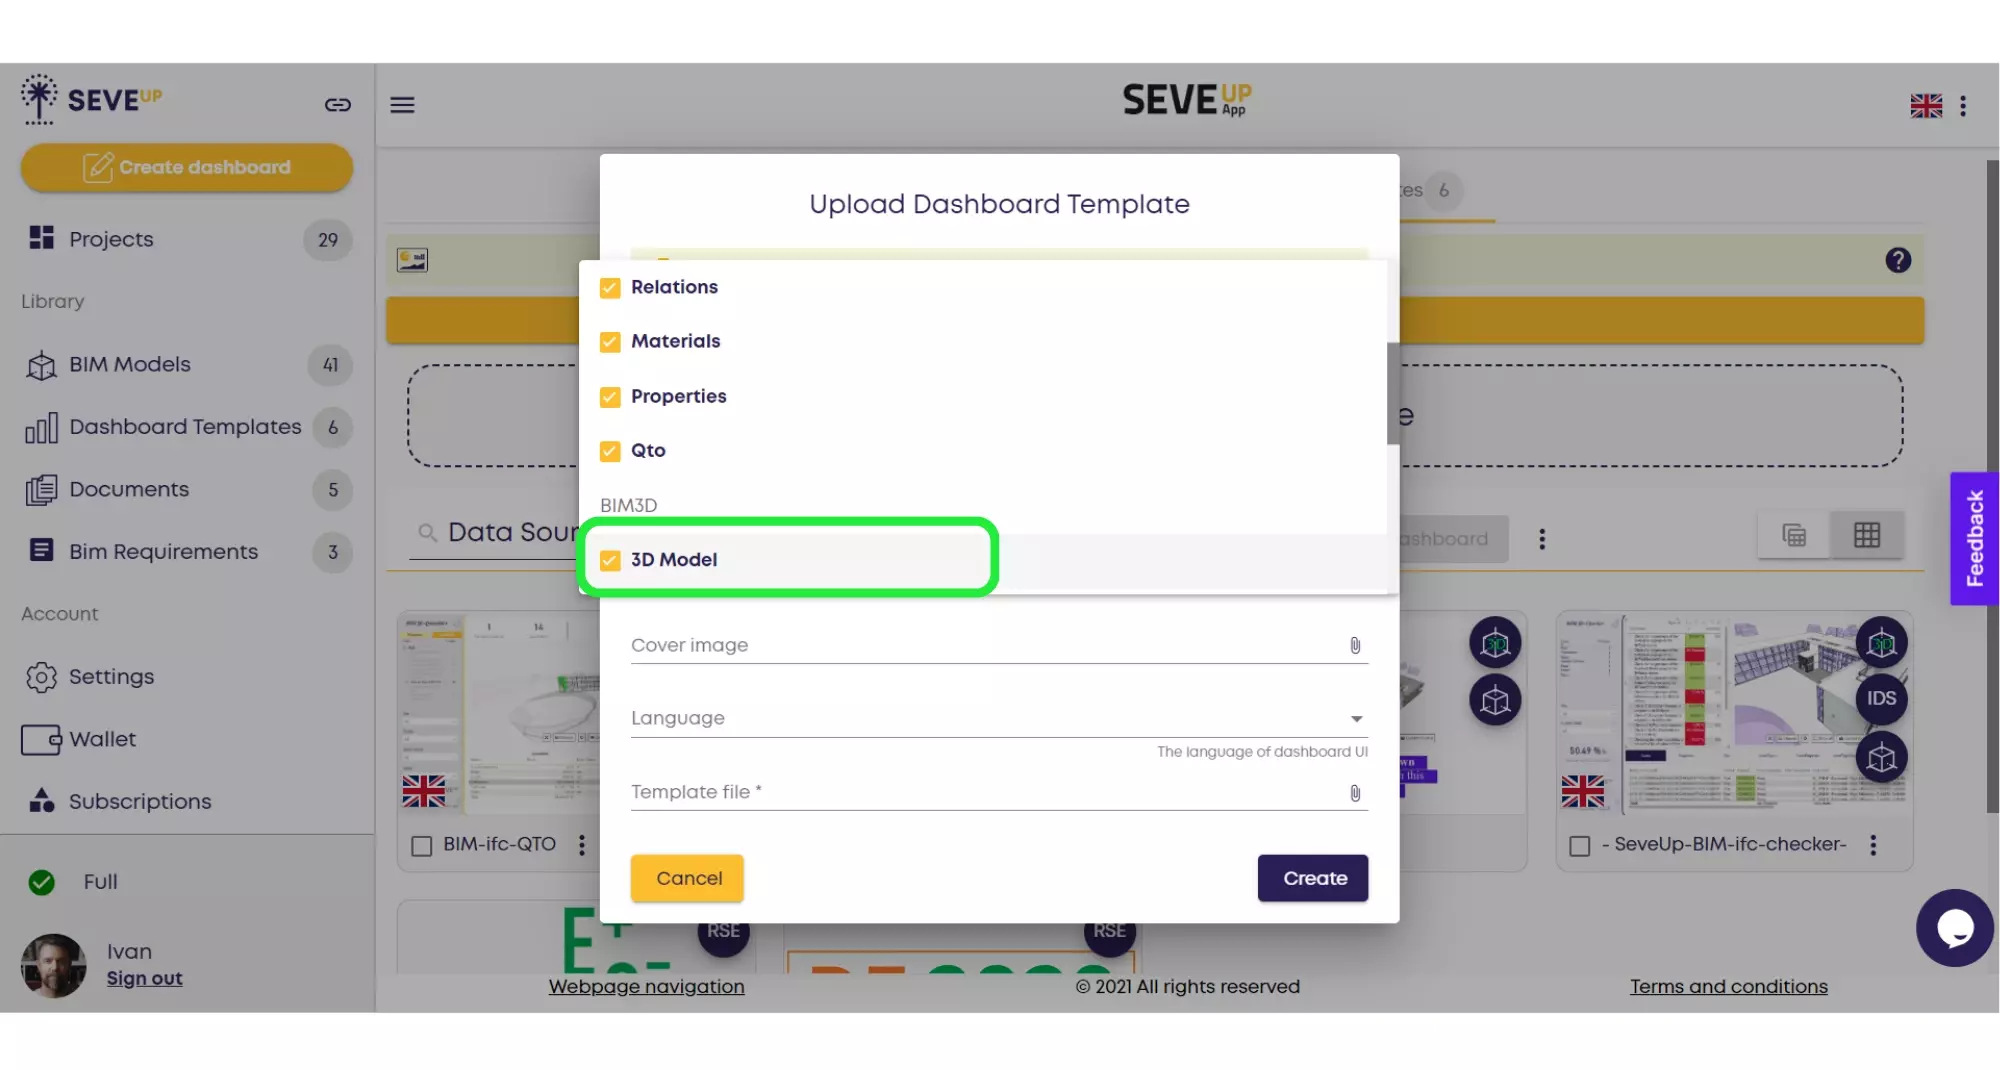
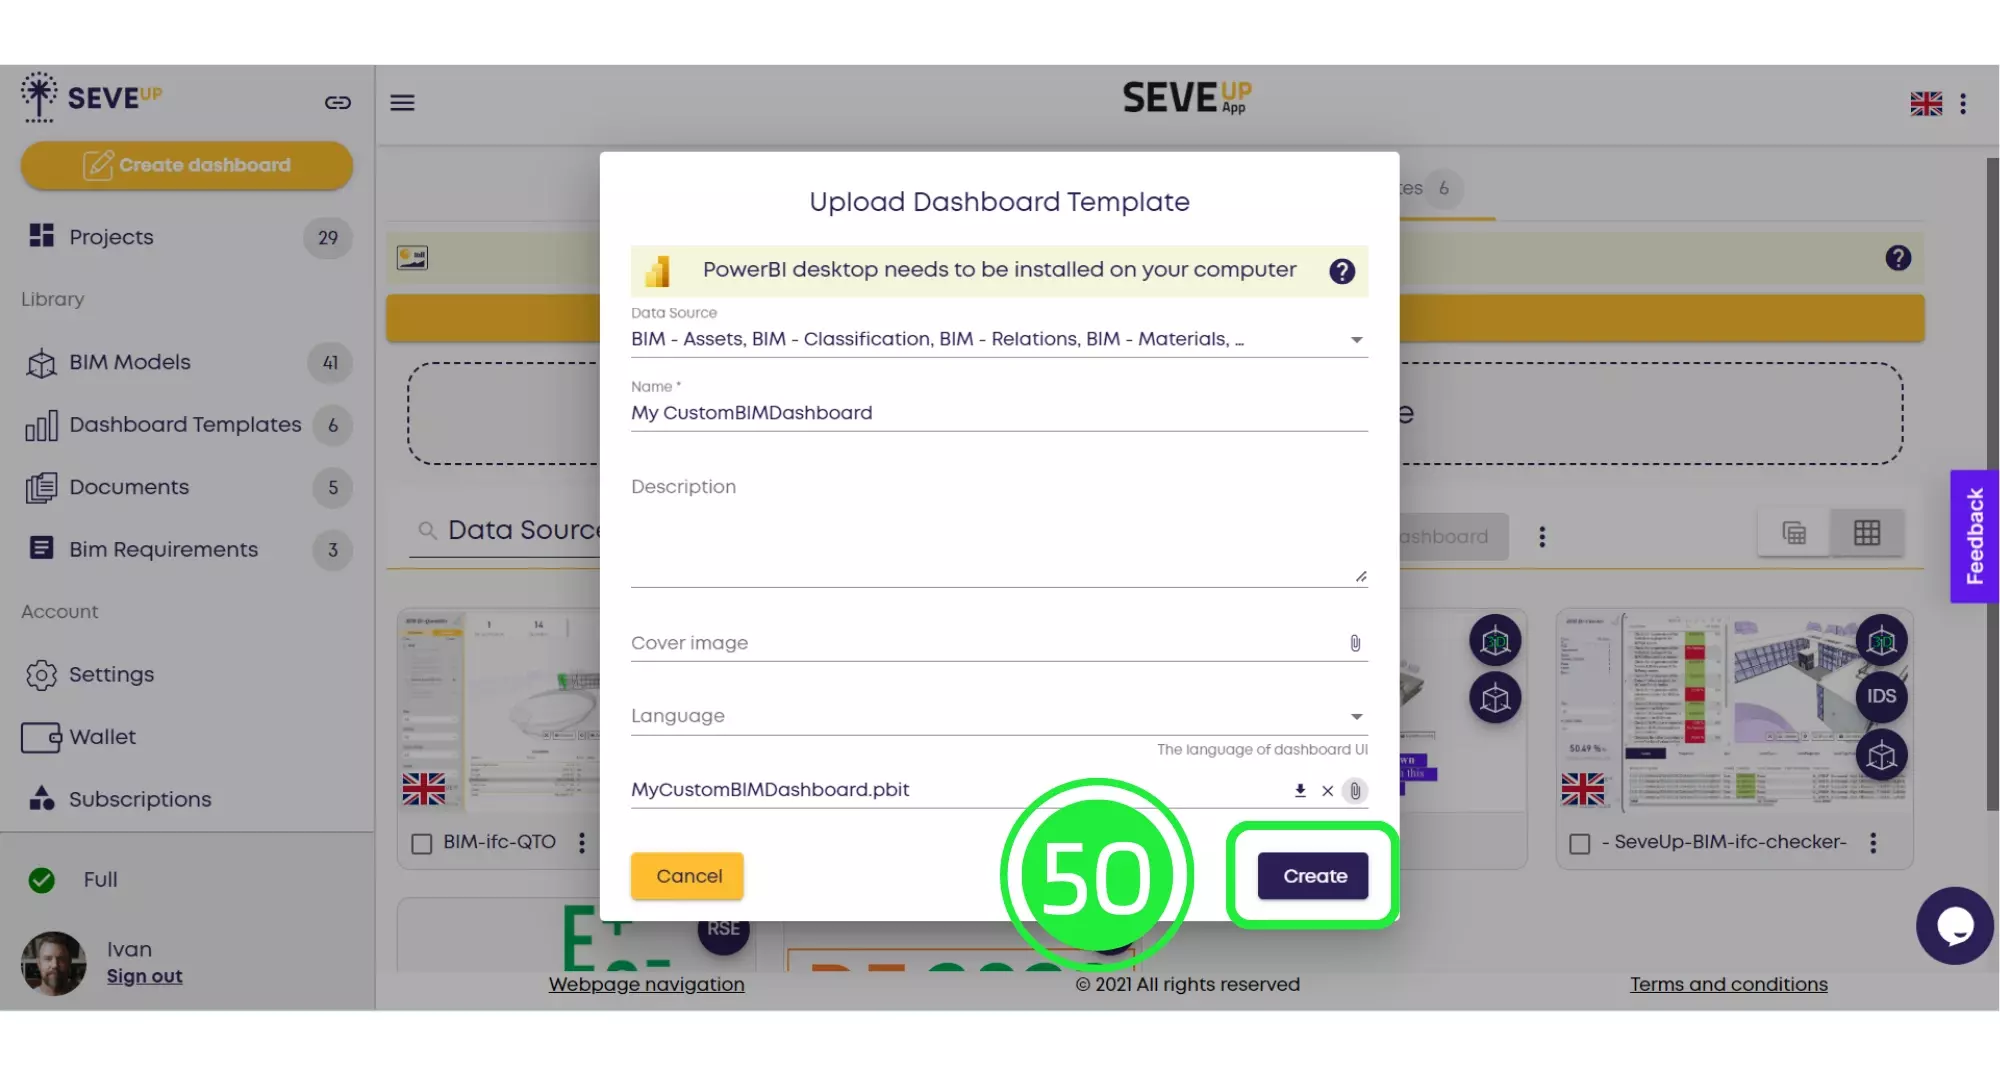
Click Data Source in the pop-up to ensure your Data Source Selection SeveUp aligns with BIM requirements.
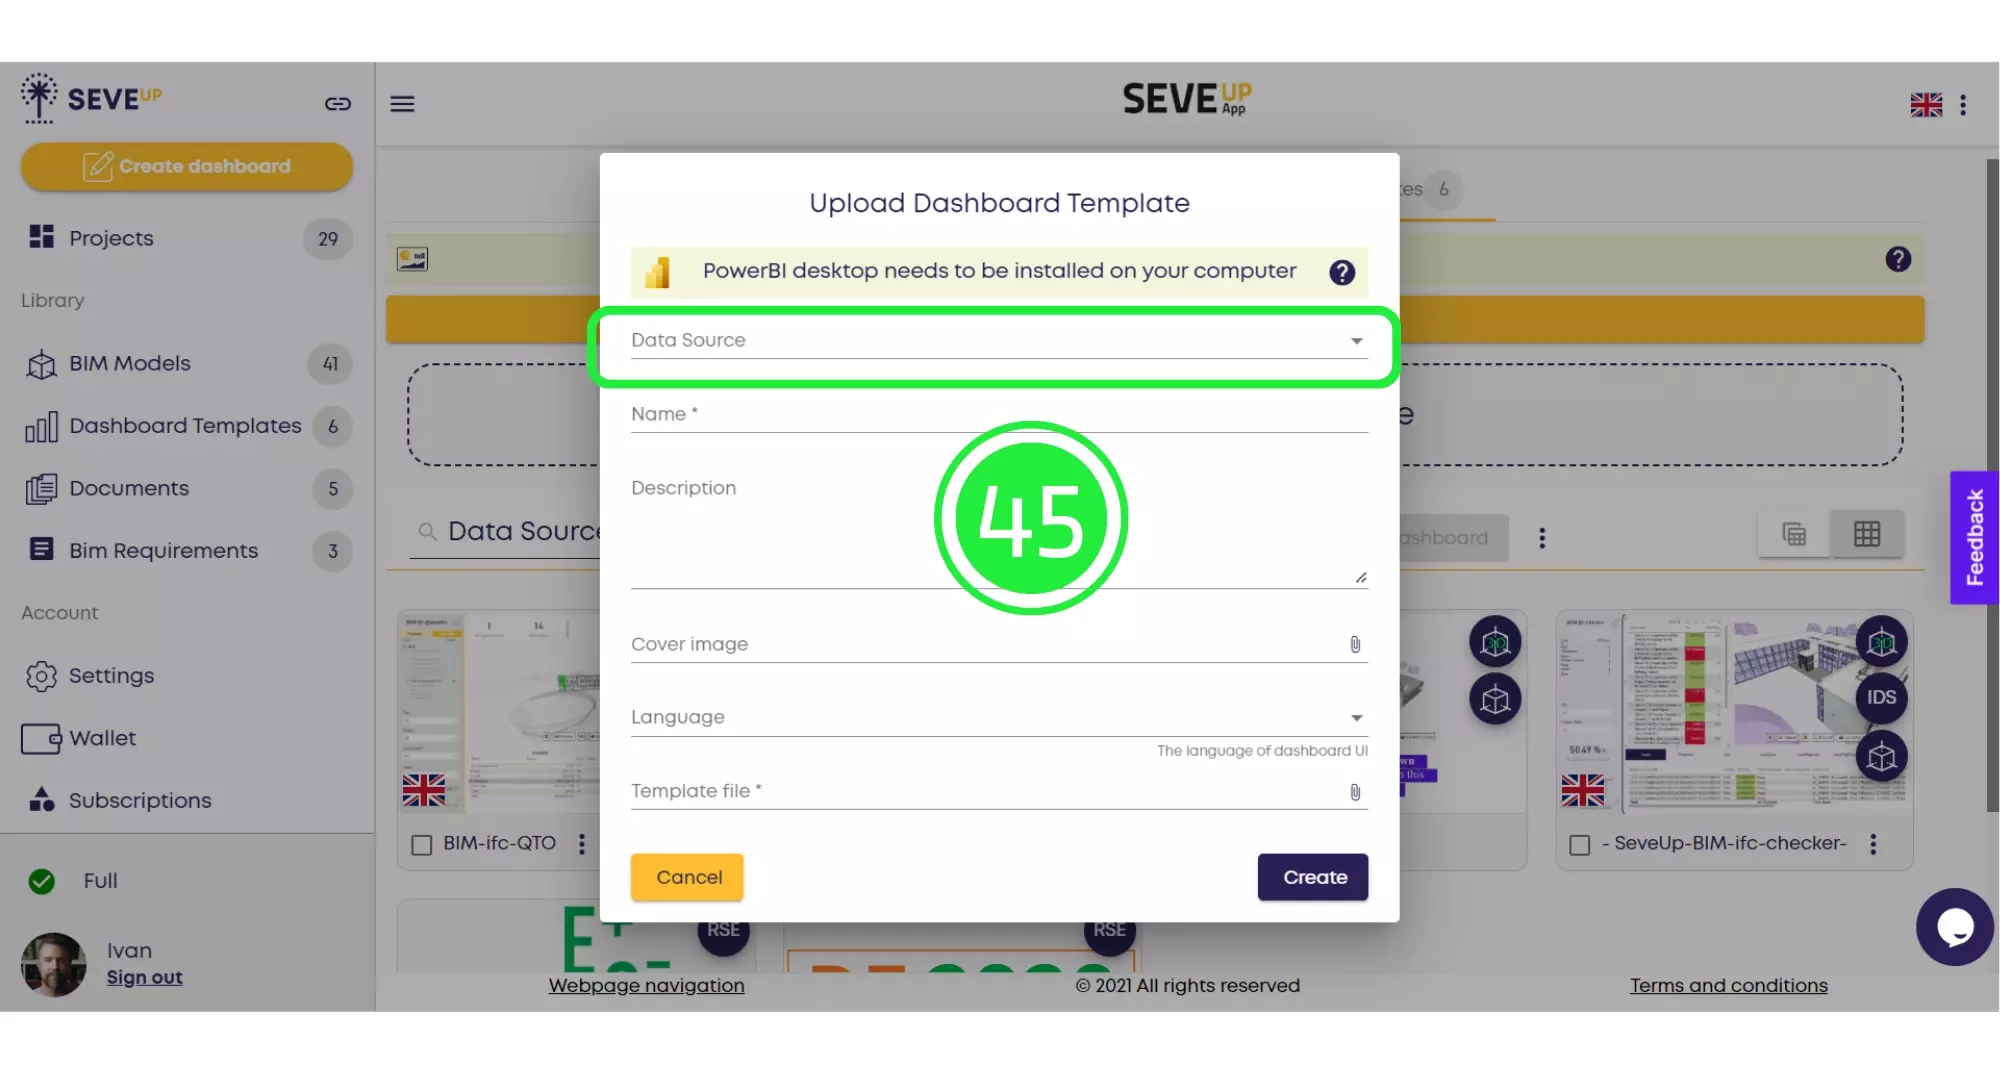
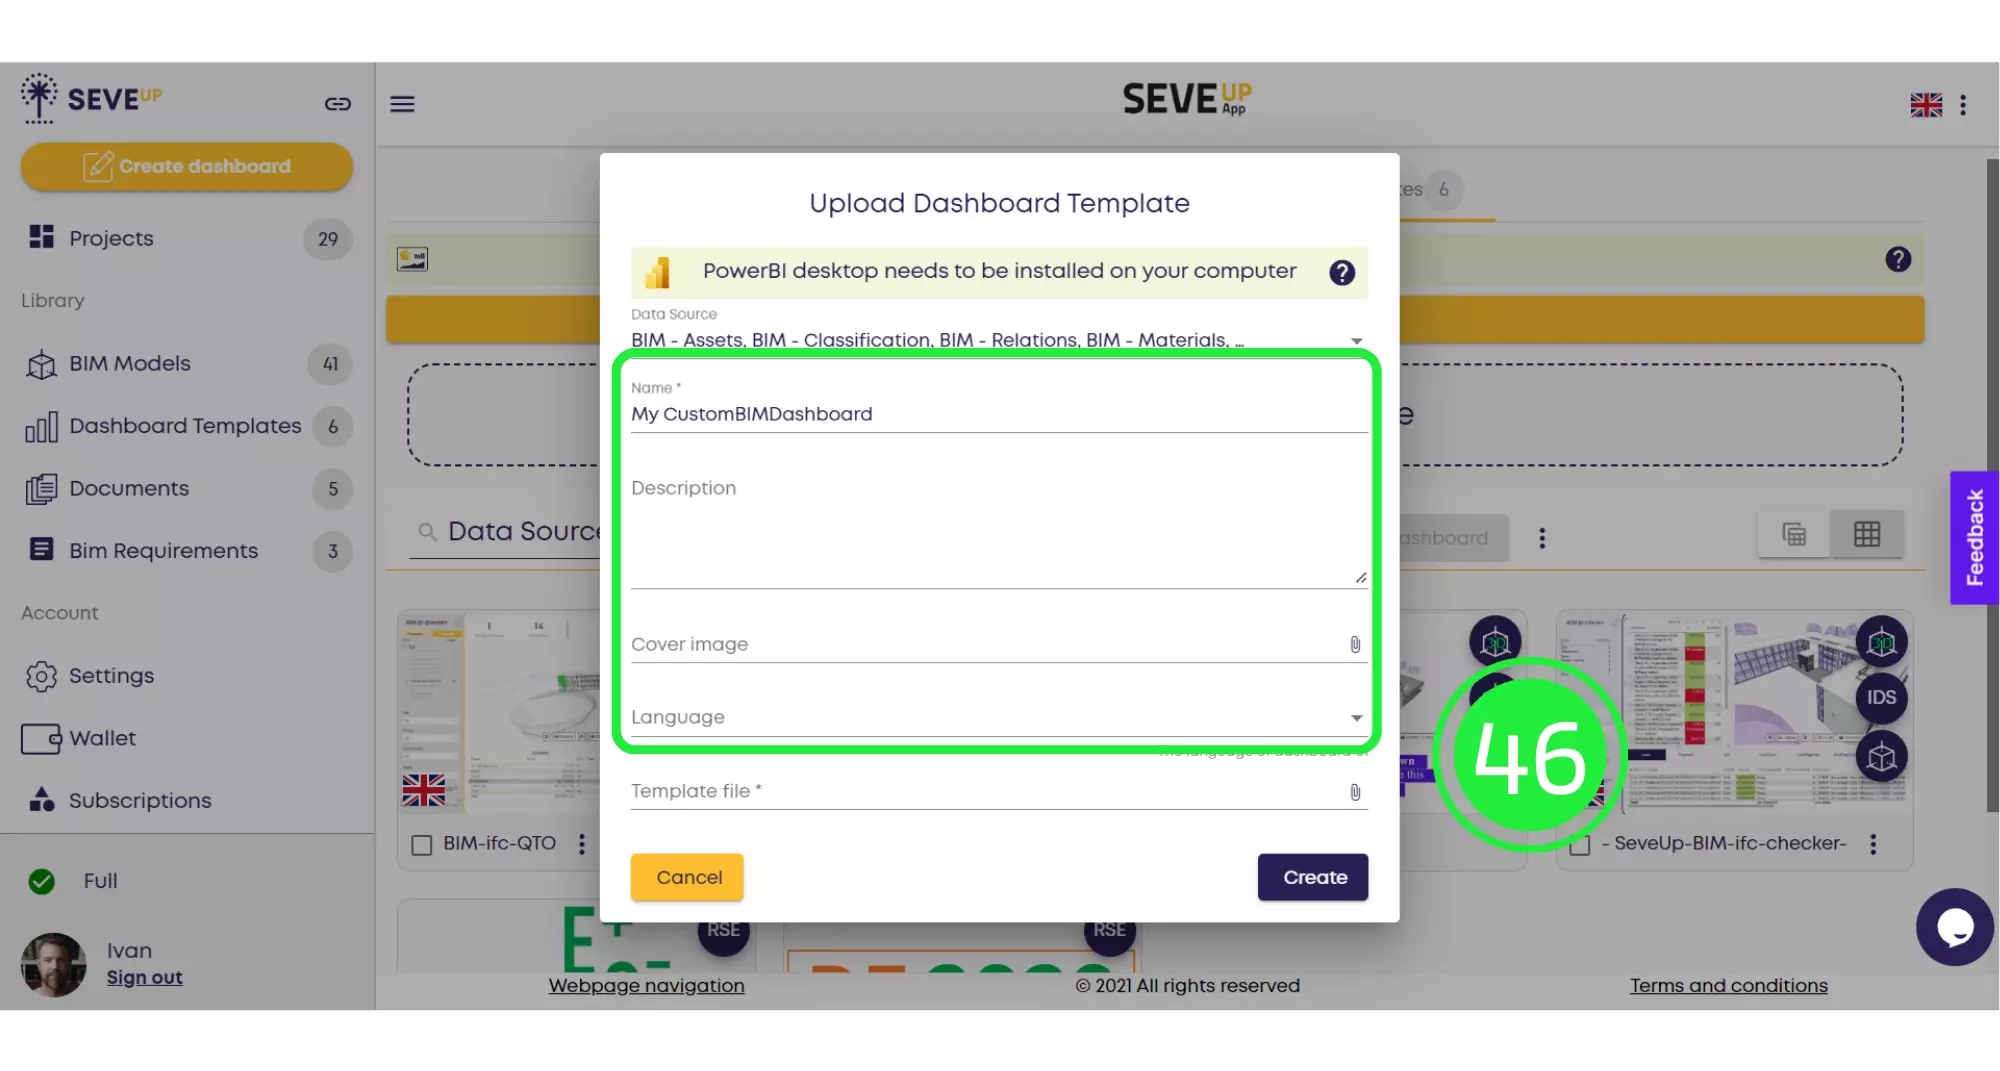
Input your template’s name and details, opting for a cover image or language preference for a tailored SeveUp template Setup.
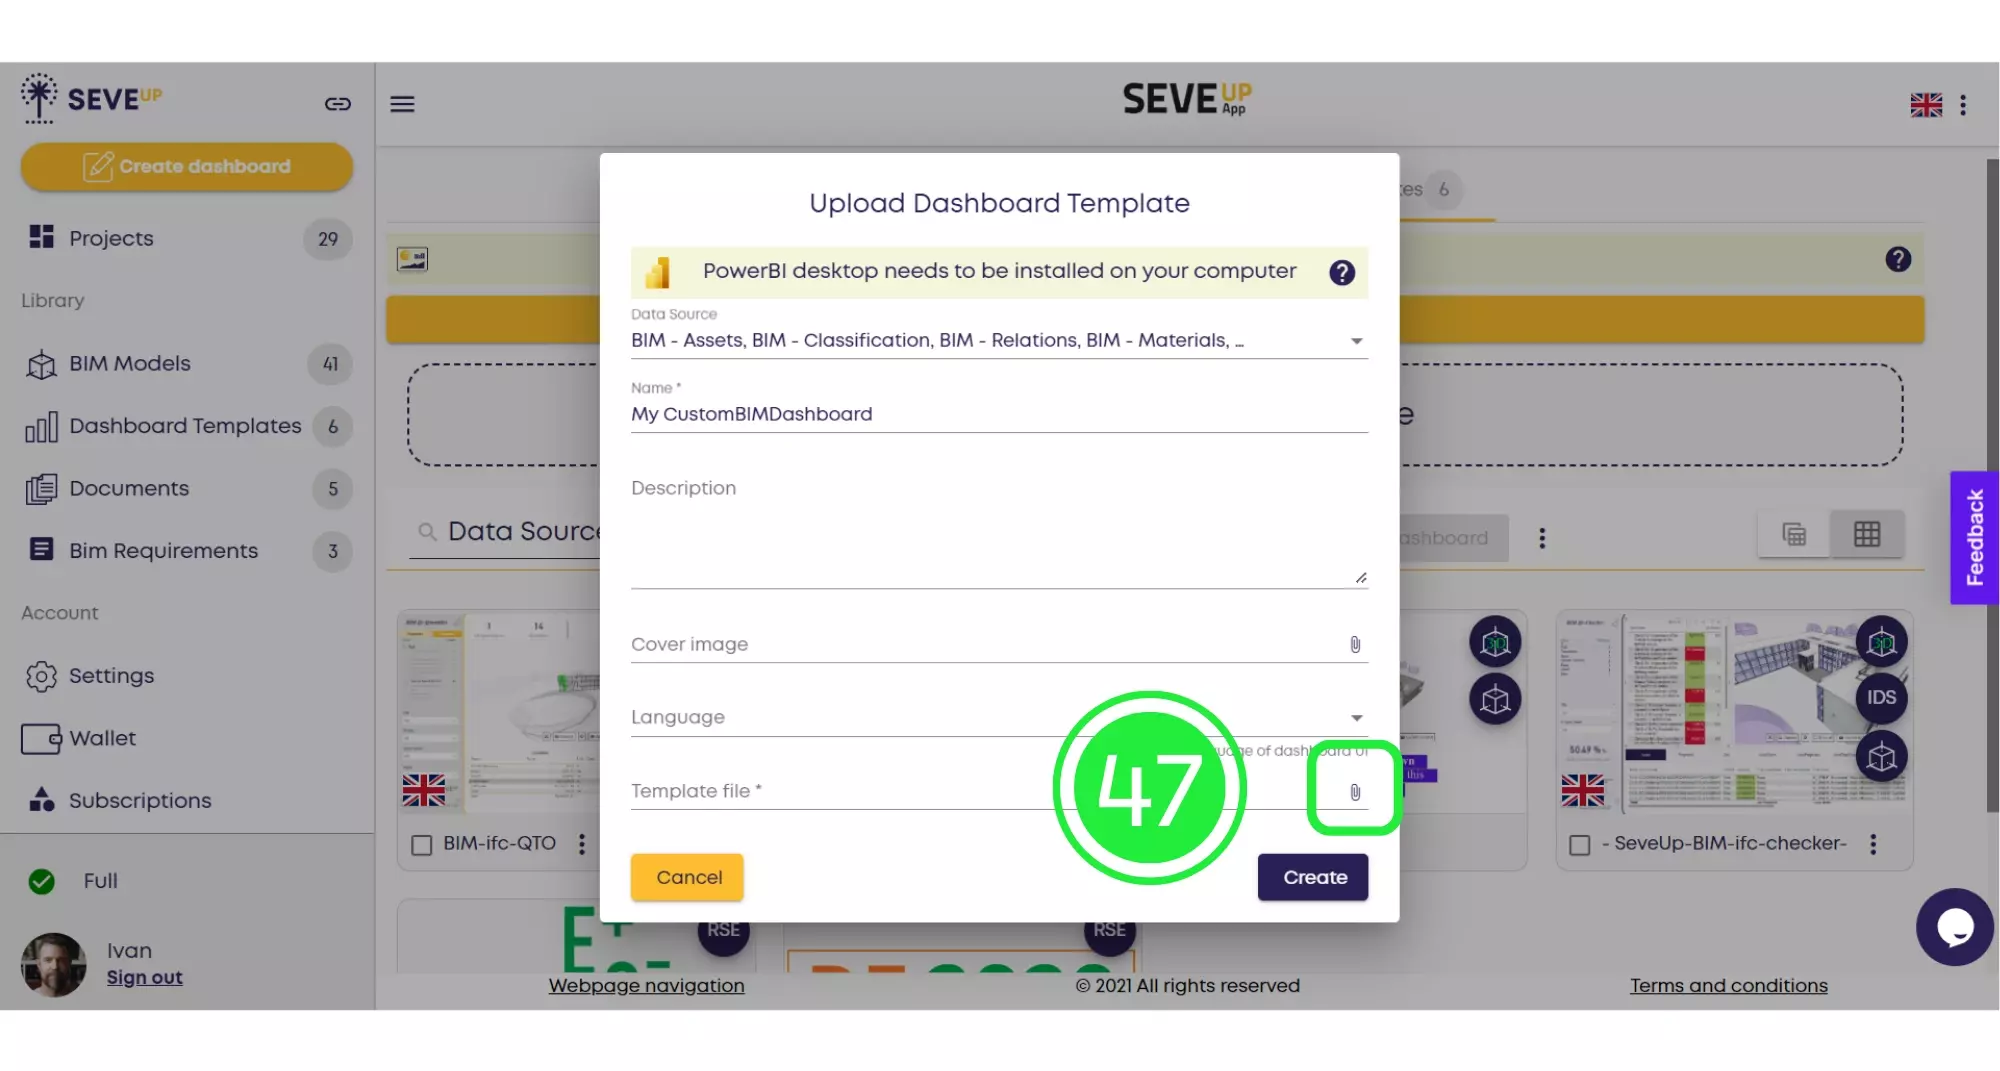
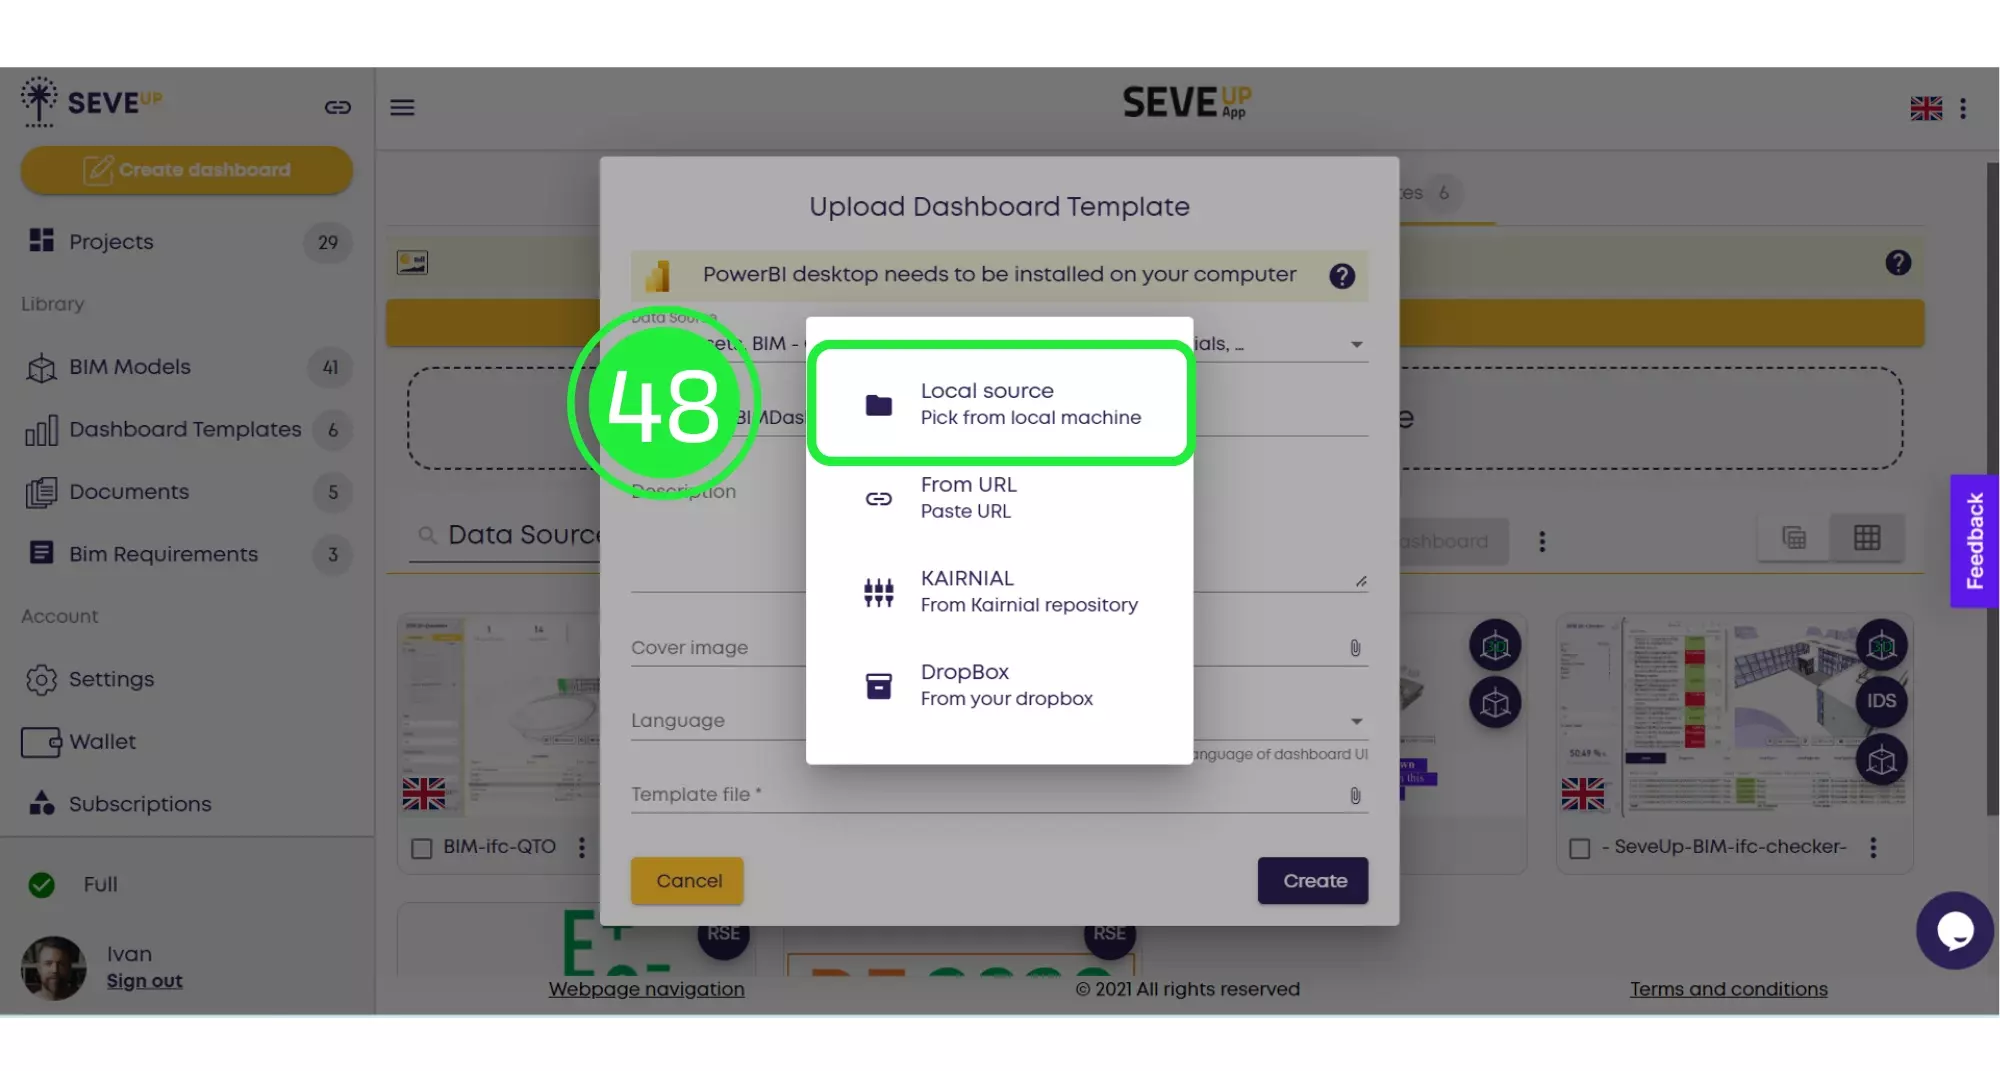
Use the “Attach File” icon to add your template file, a crucial step in Custom Dashboard Implementation.
Choose “Local Source” from the menu to upload the file from your computer, facilitating SeveUp Template Integration.
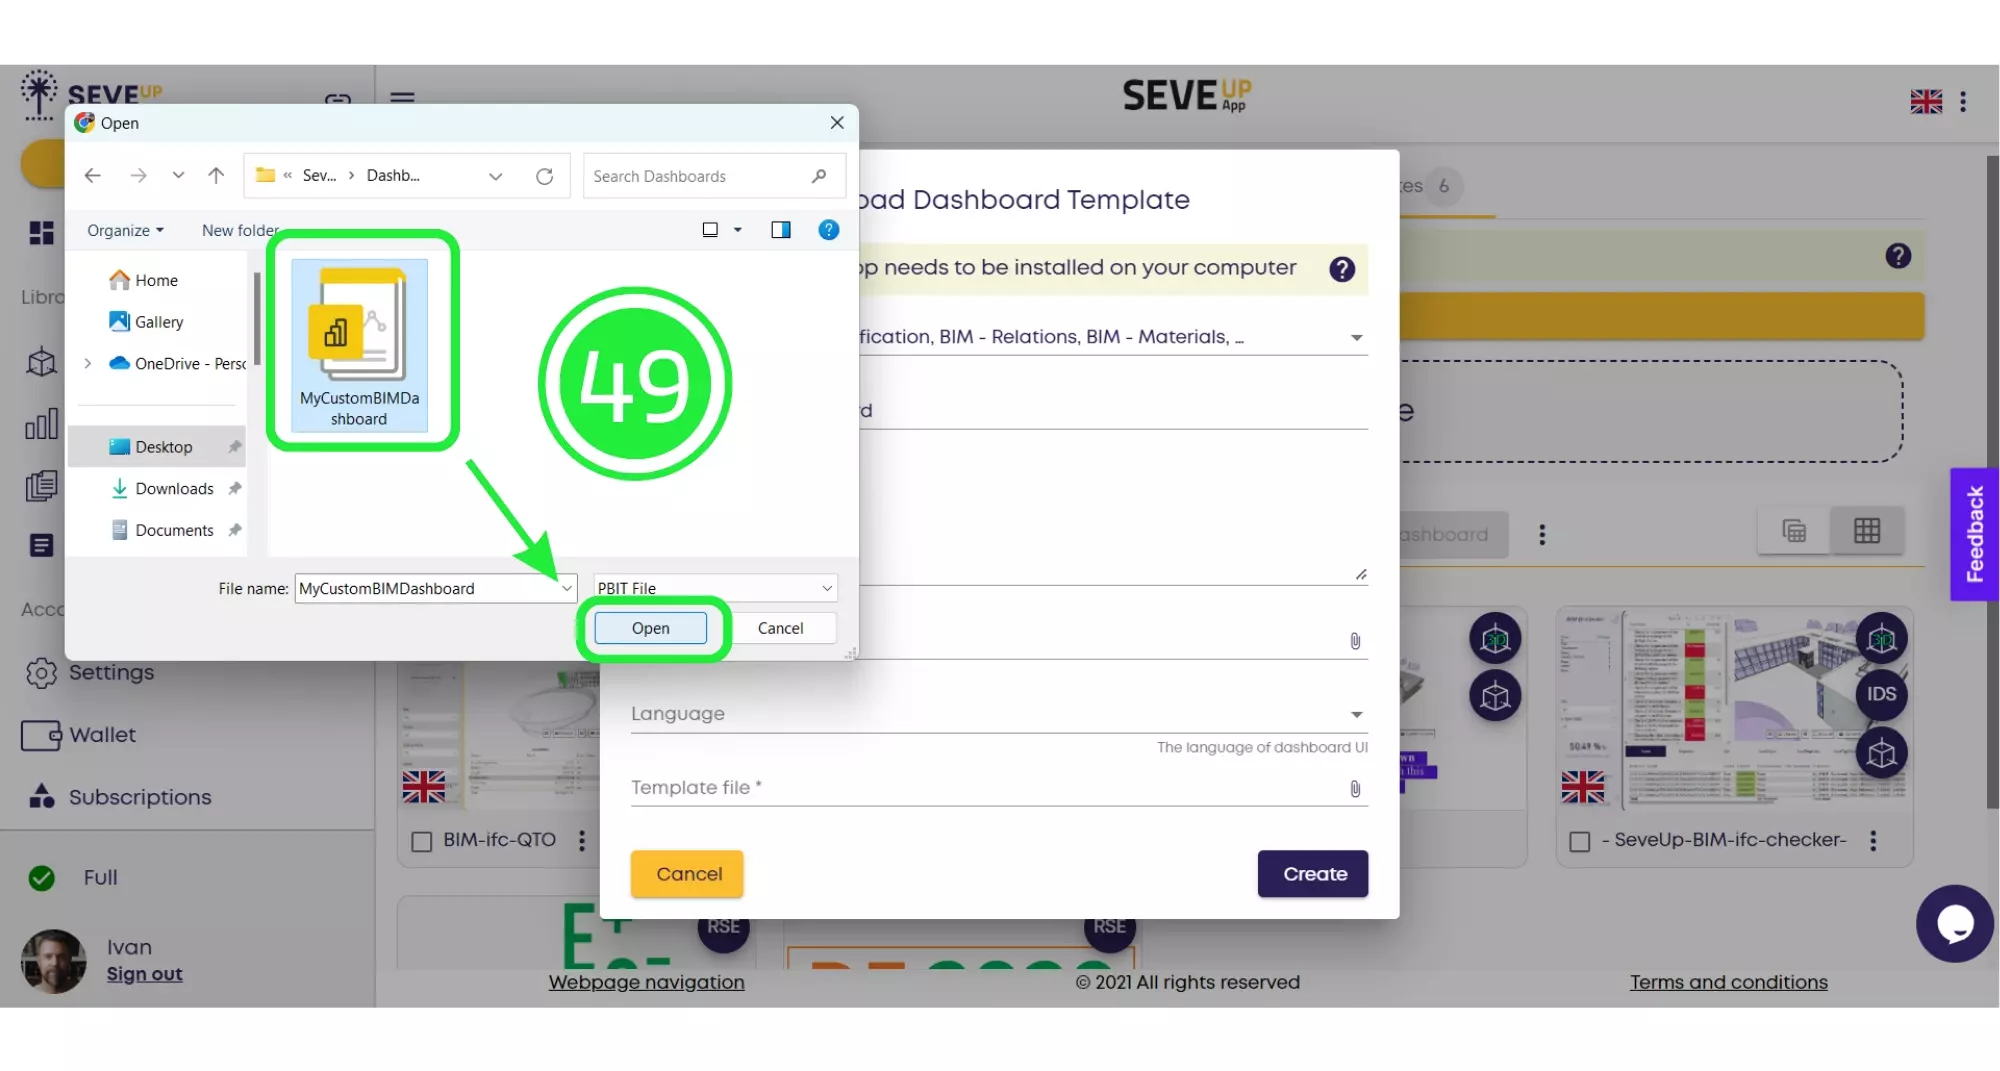
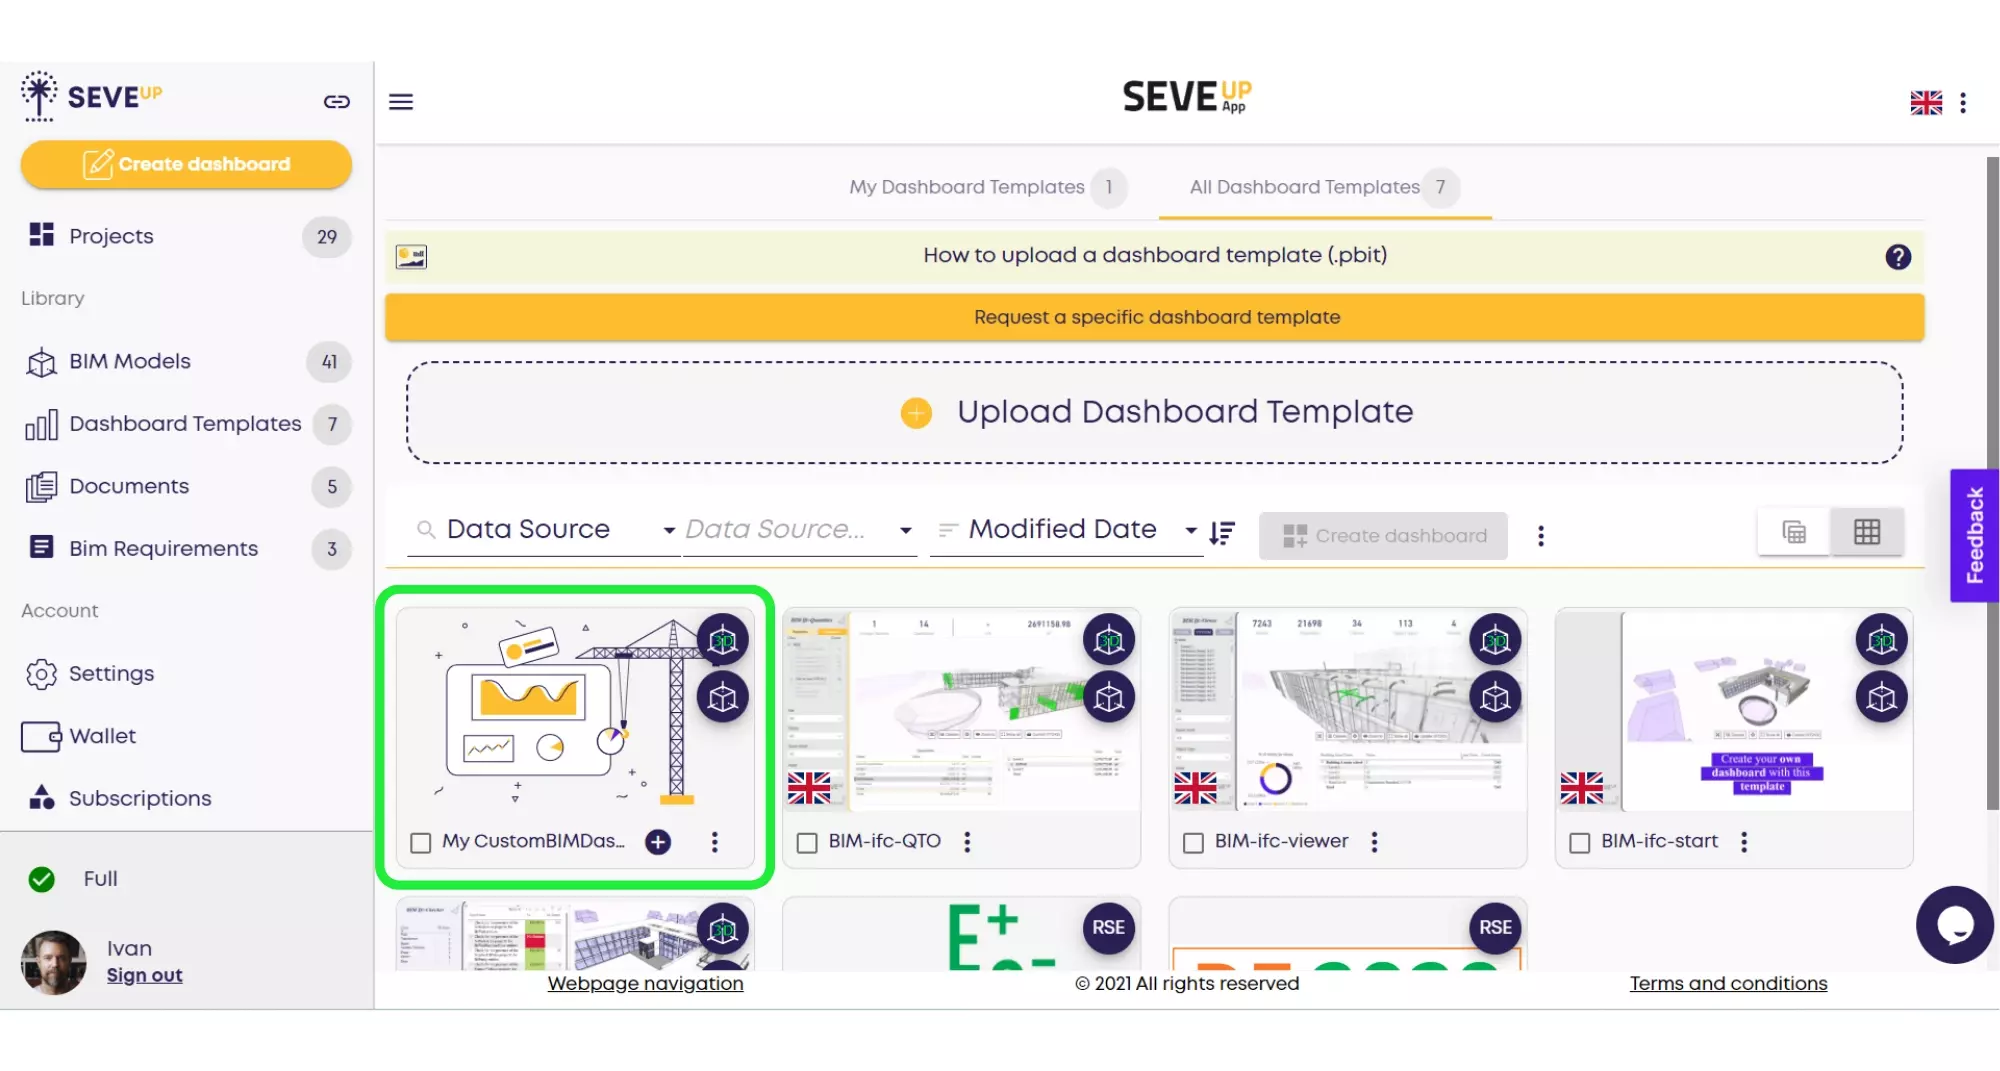
Select your template and finalize by clicking “Create,” concluding the Upload Dashboard Template SeveUp procedure.


Want to get started with your very own BIM project? You’ll be surprised by just how easy it is. Create your own free account is SeveUp today and give it a try.

Unlock the power of your building data with SeveUp. Tailored dashboards, seamless integration
🎓 Free BIM Checker Training Learn how to automate your BIM model checks and get certified. Register for Free Click
Learn More🎓 Free BIM Checker Training Learn how to automate your BIM model checks and get certified. Register for Free Click
Learn More🎓 Free BIM Checker Training Learn how to automate your BIM model checks and get certified. Register for Free Choose
Learn More