Trusted by companies
all over the world:
In the realm of architecture, engineering, and construction, organising and accessing BIM data based on specific levels is crucial for effective analysis and decision-making. How Does Filtering BIM Information Enhance Analysis? The tutorial will show you how to craft your dashboard interface.
Through the seamless integration of Power BI and SeveUp, we have the tools to navigate through complex BIM datasets with ease. The focus of this tutorial is on utilising Power BI's Slicer visual to filter BIM information by level, enabling you to isolate and analyse data pertinent to specific floors or levels within your building models.
Whether you're a project manager needing to assess the structural integrity of individual floors or an architect analysing spatial relationships within a specific level, this tutorial is tailored to equip you with the skills and knowledge needed to navigate and filter BIM information effectively.
Upon completing this tutorial, you'll gain the skills and knowledge necessary to effectively filter BIM data by level, providing you with the capability to streamline your analysis process and uncover valuable insights within your BIM datasets.
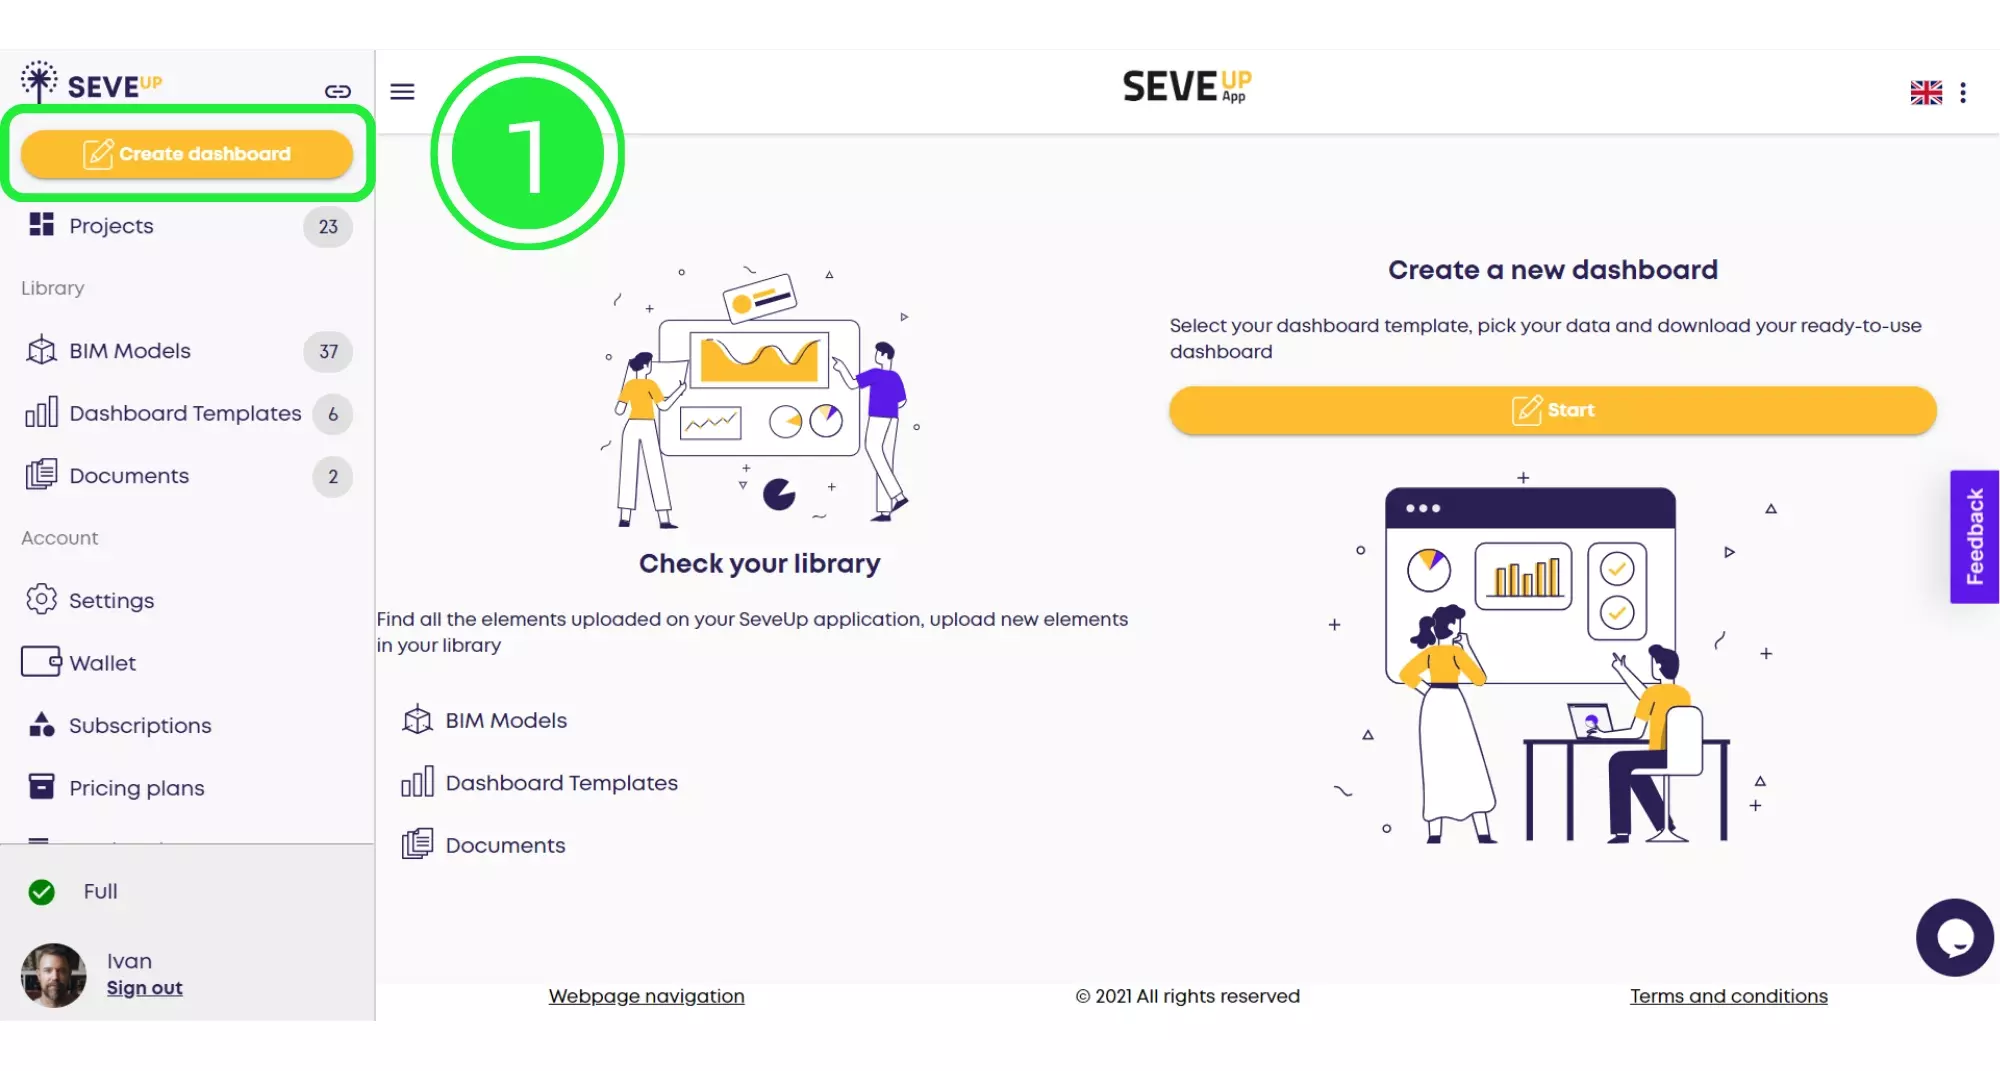
Start by logging into your SeveUp App account and then boldly click on the “Create Dashboard” button to begin the BIM dashboard creation process.
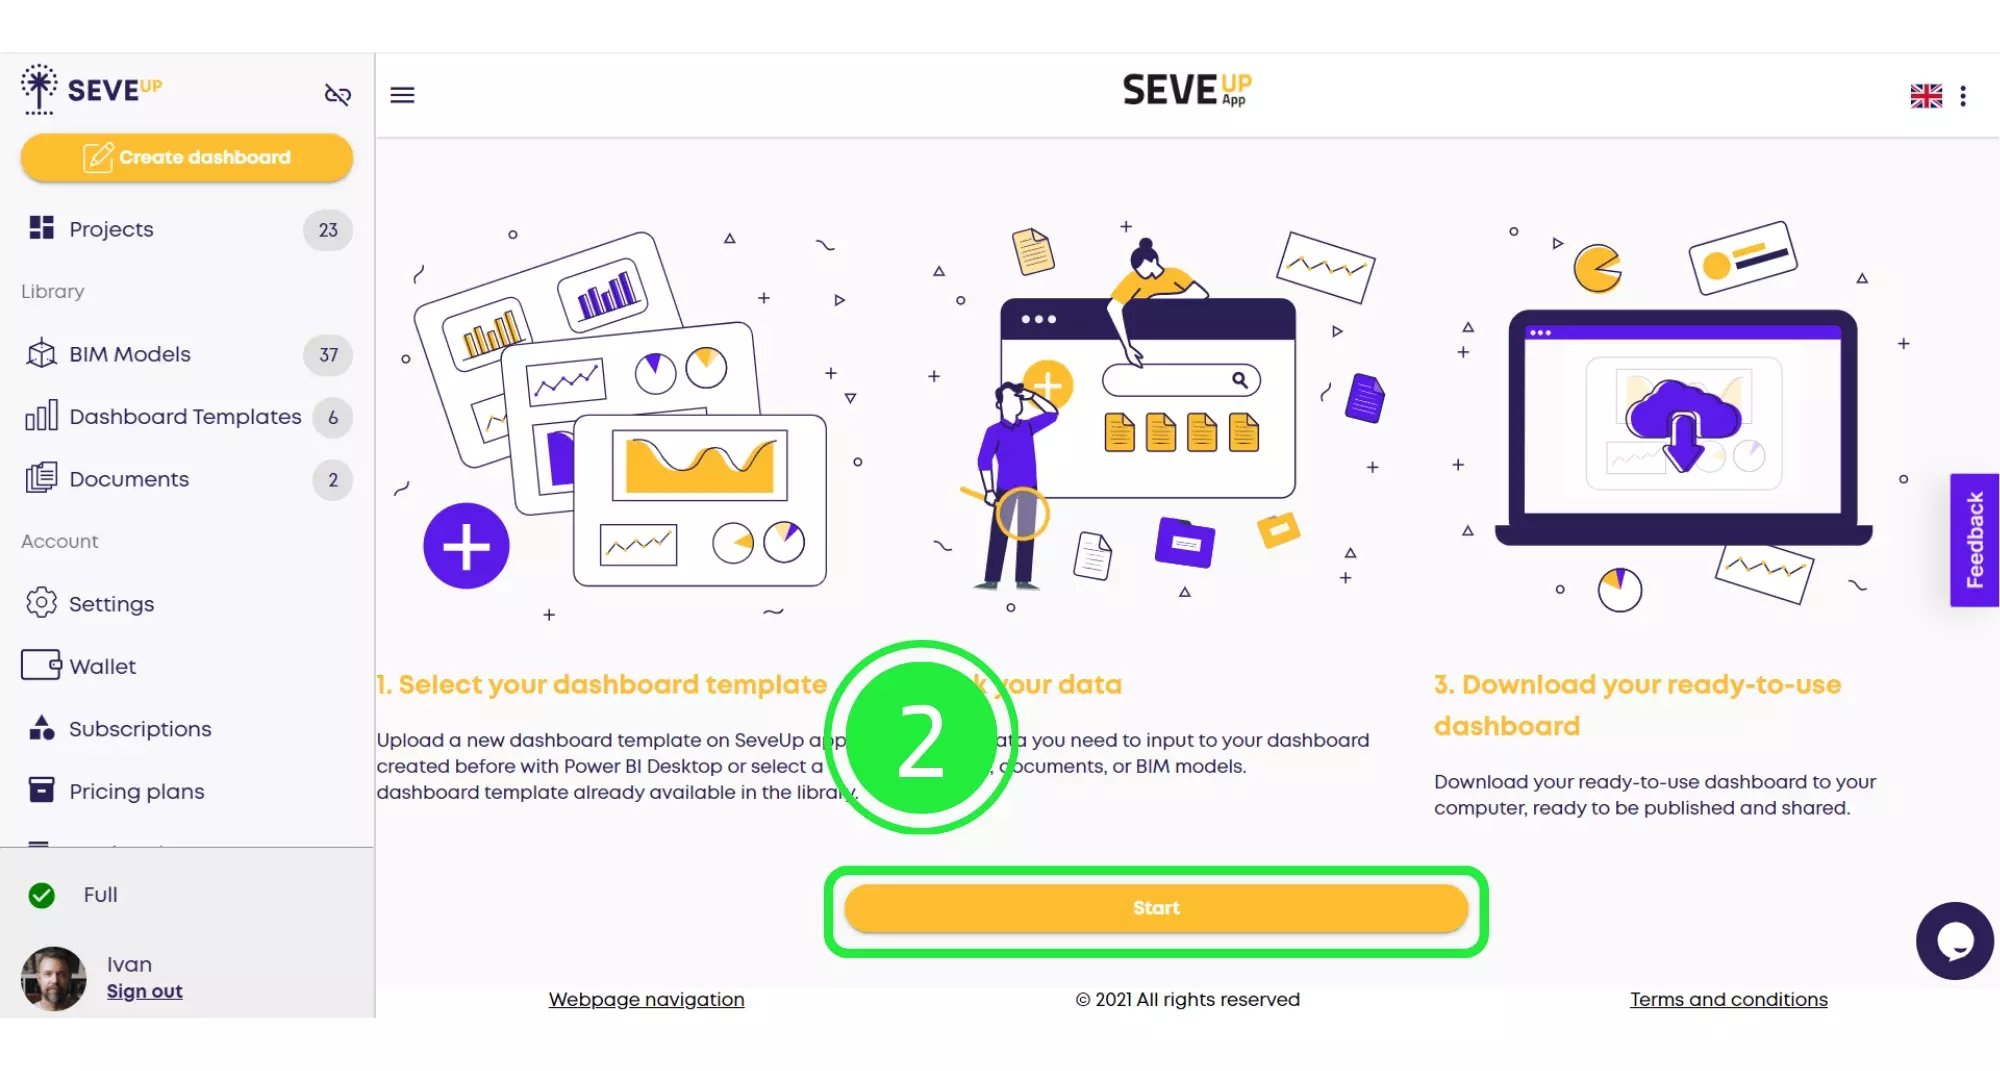
In the heart of the tutorial page, you’ll find the “Start” button. Clicking here propels you into crafting your new BIM dashboard.
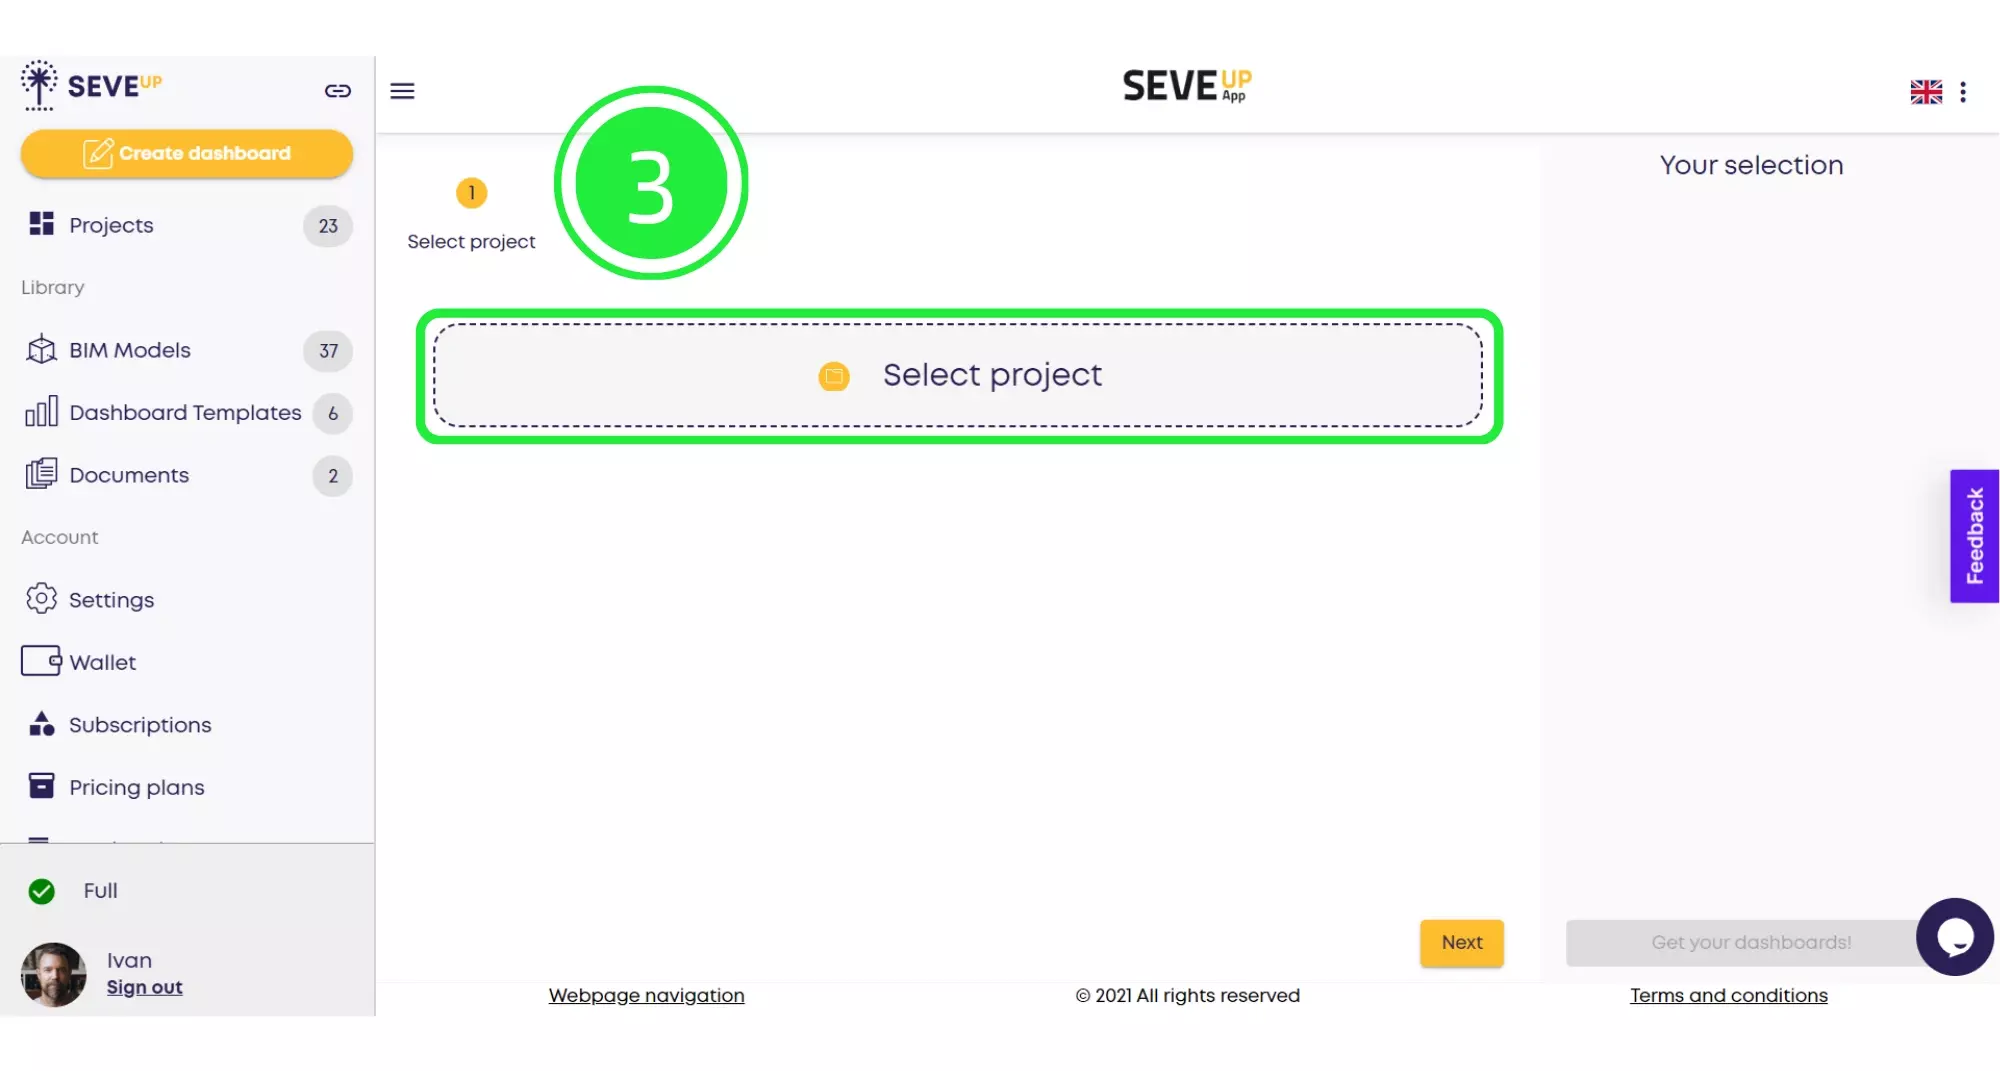
At this stage, your progress is visually represented. Hit the large “Select Project” button to dive deeper into BIM dashboard creation.
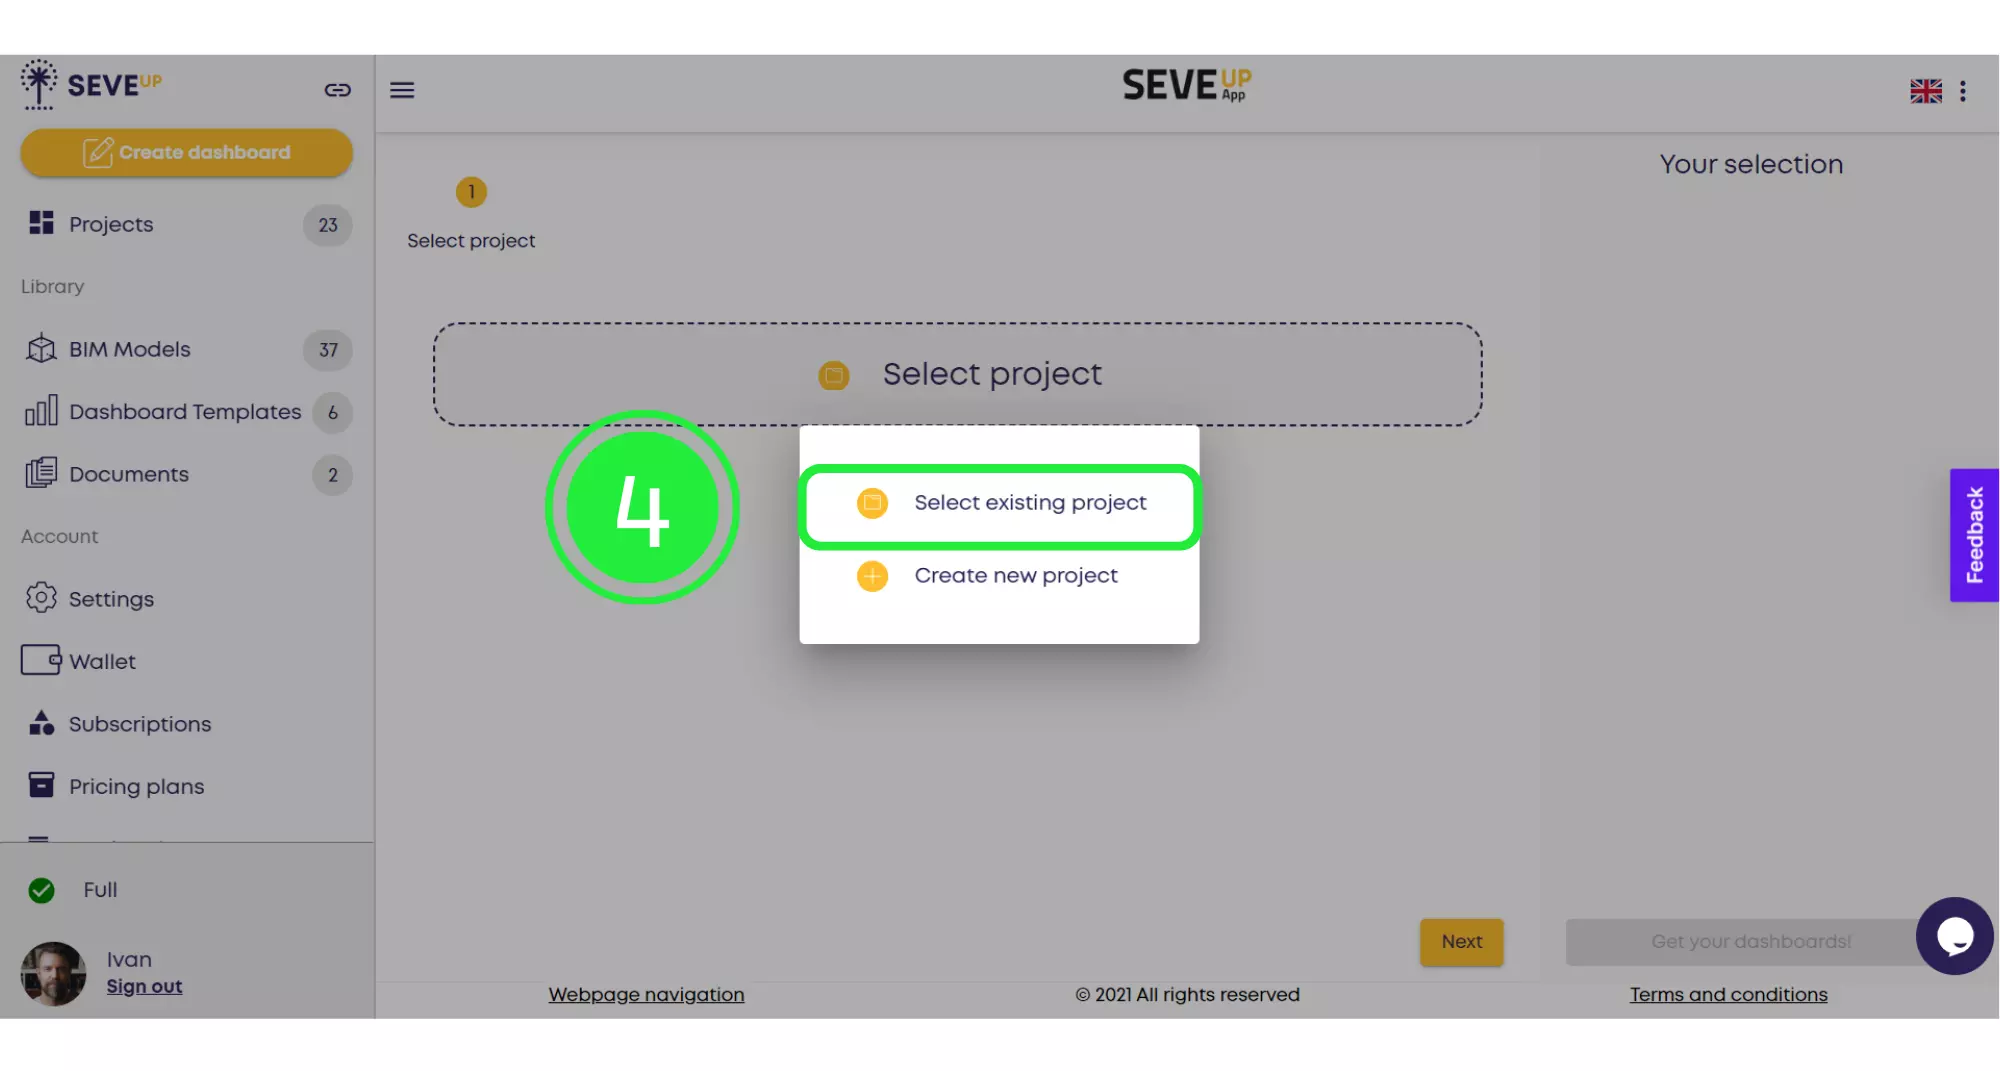
A popup emerges, offering a choice between existing projects or the creation of a new one. Opt for “Select Existing Project” to proceed with BIM dashboard creation.
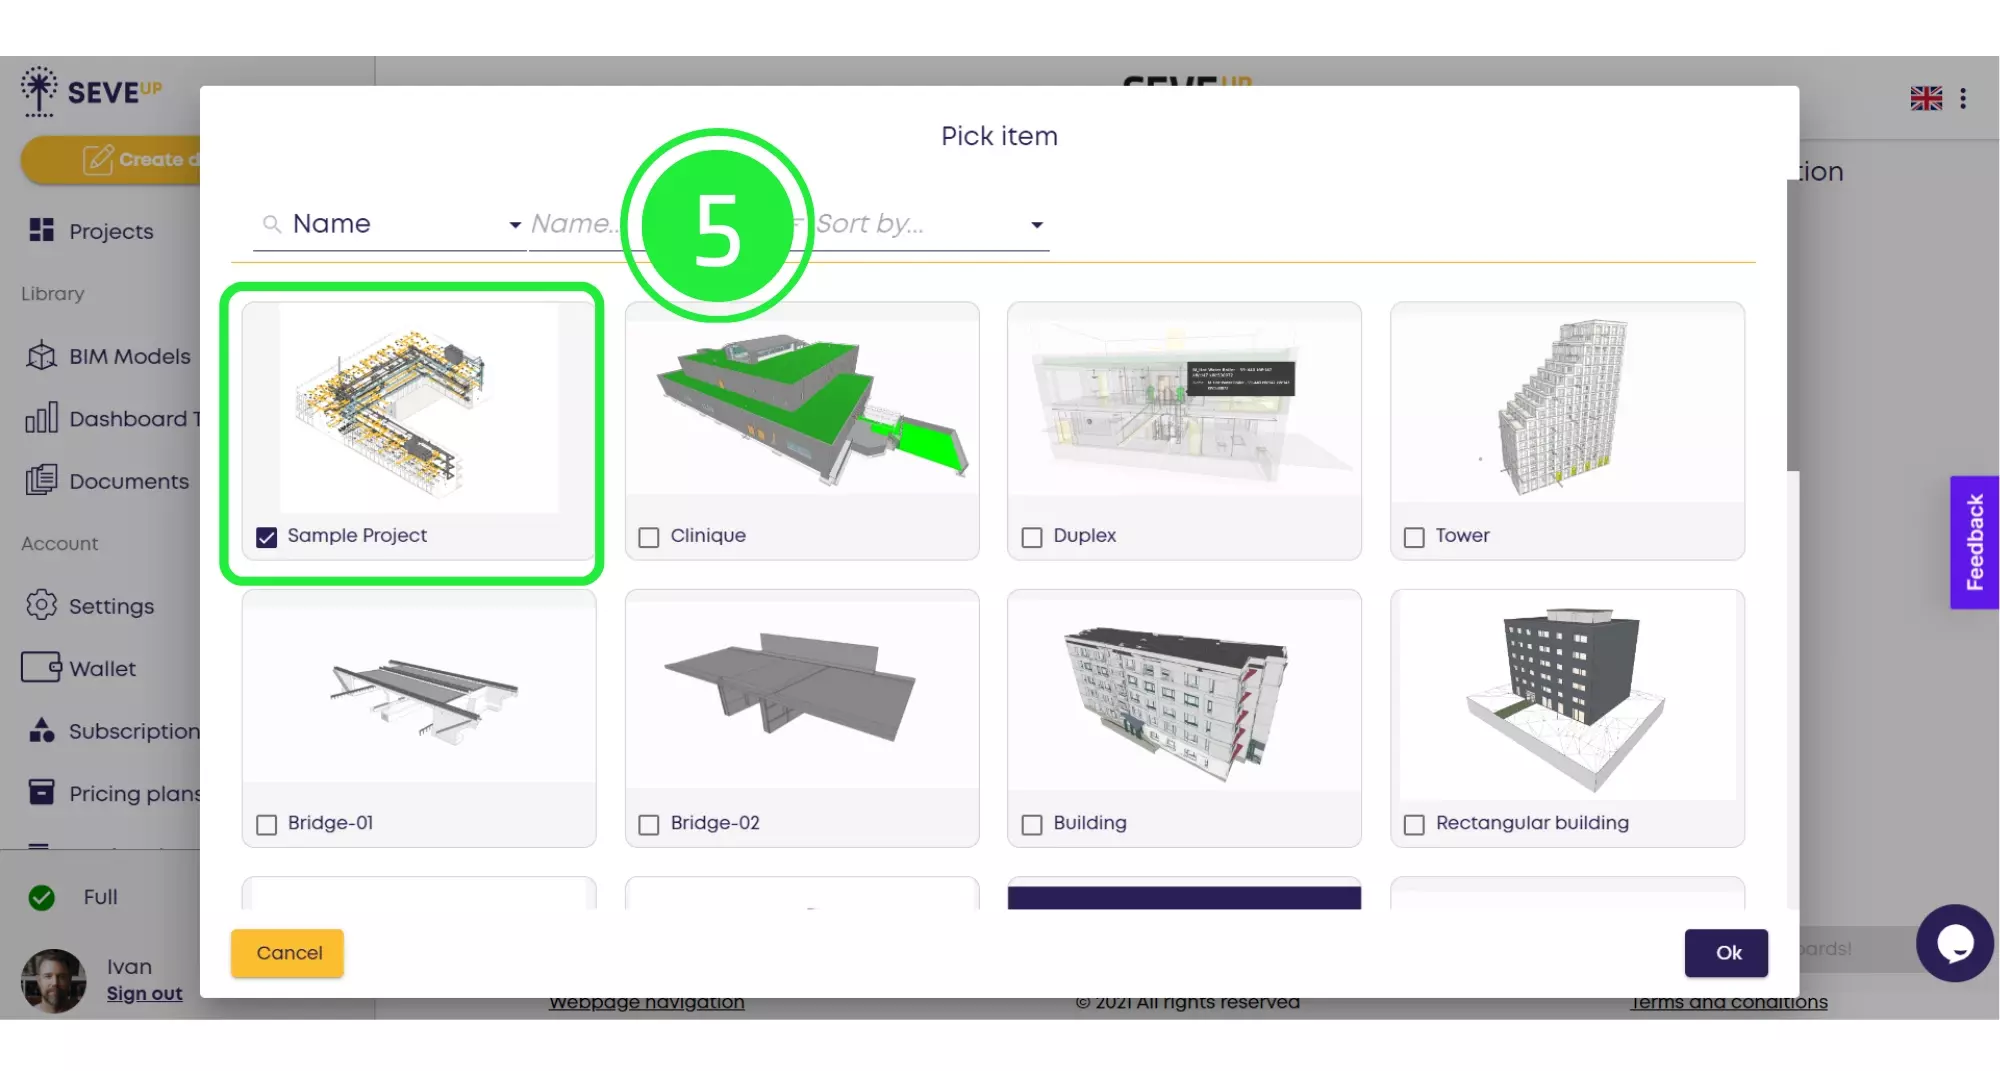
A popup box will present your projects. Select your desired project to mark it with a tick, moving forward with your BIM dashboard.
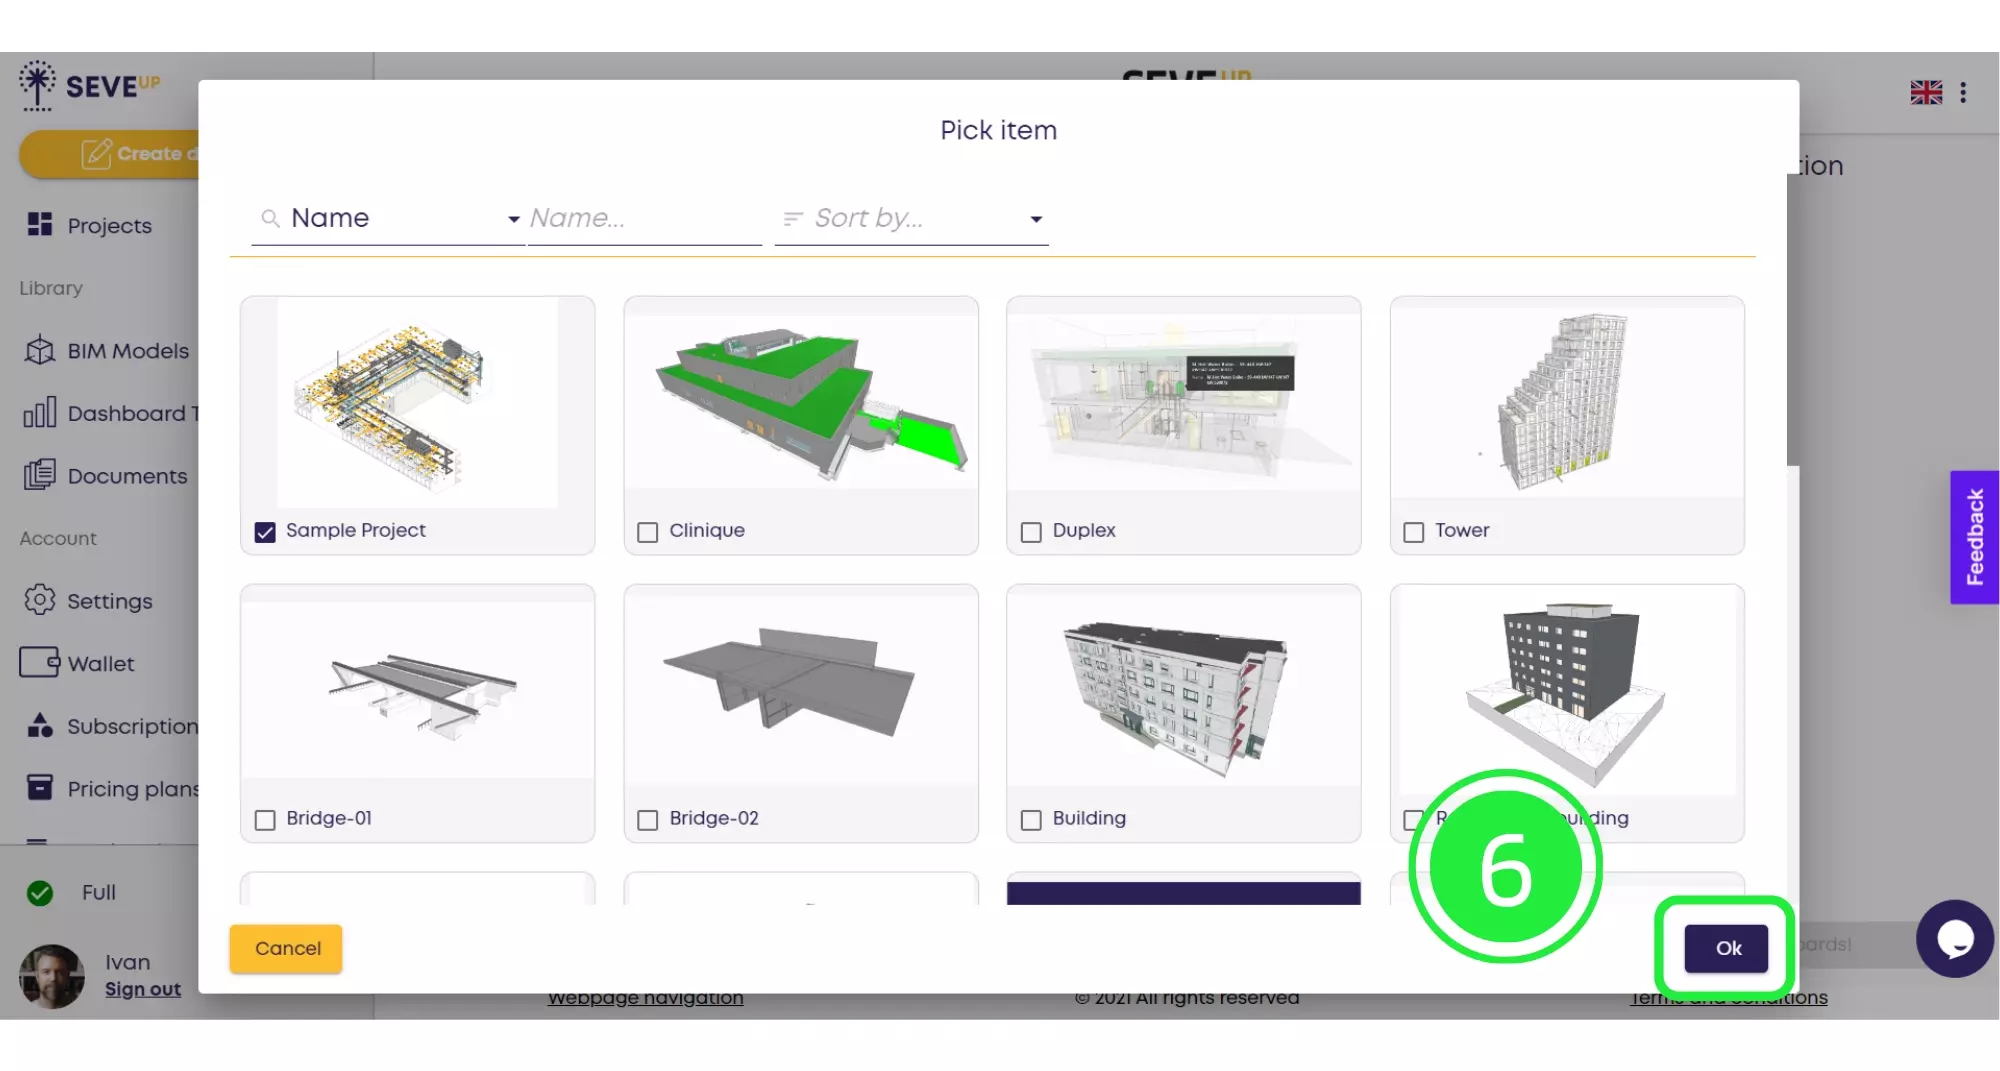
Proceed by clicking the “OK” button, located strategically in the bottom right corner, advancing your journey in BIM dashboard creation.
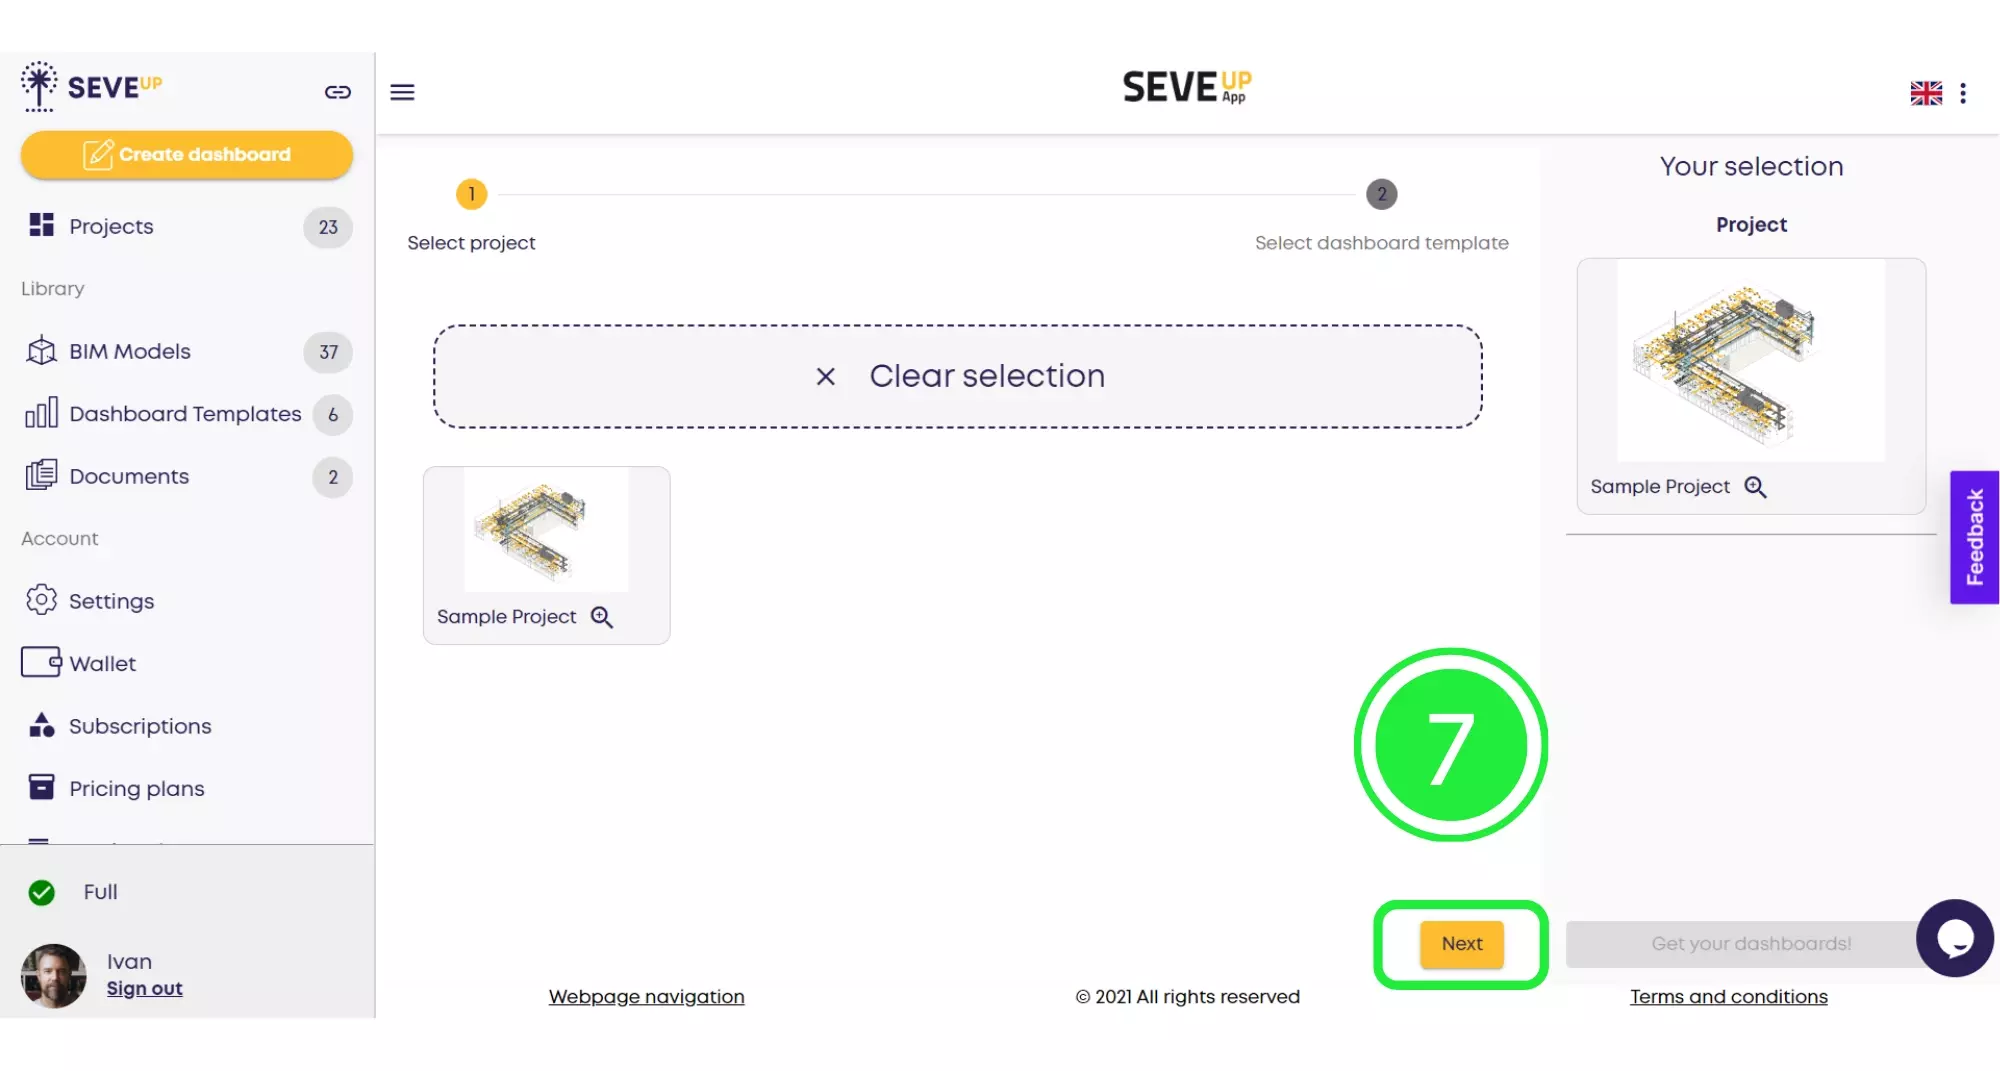
With your project now visible, click “Next” at the bottom to seamlessly transition to the subsequent stage of BIM dashboard integration.
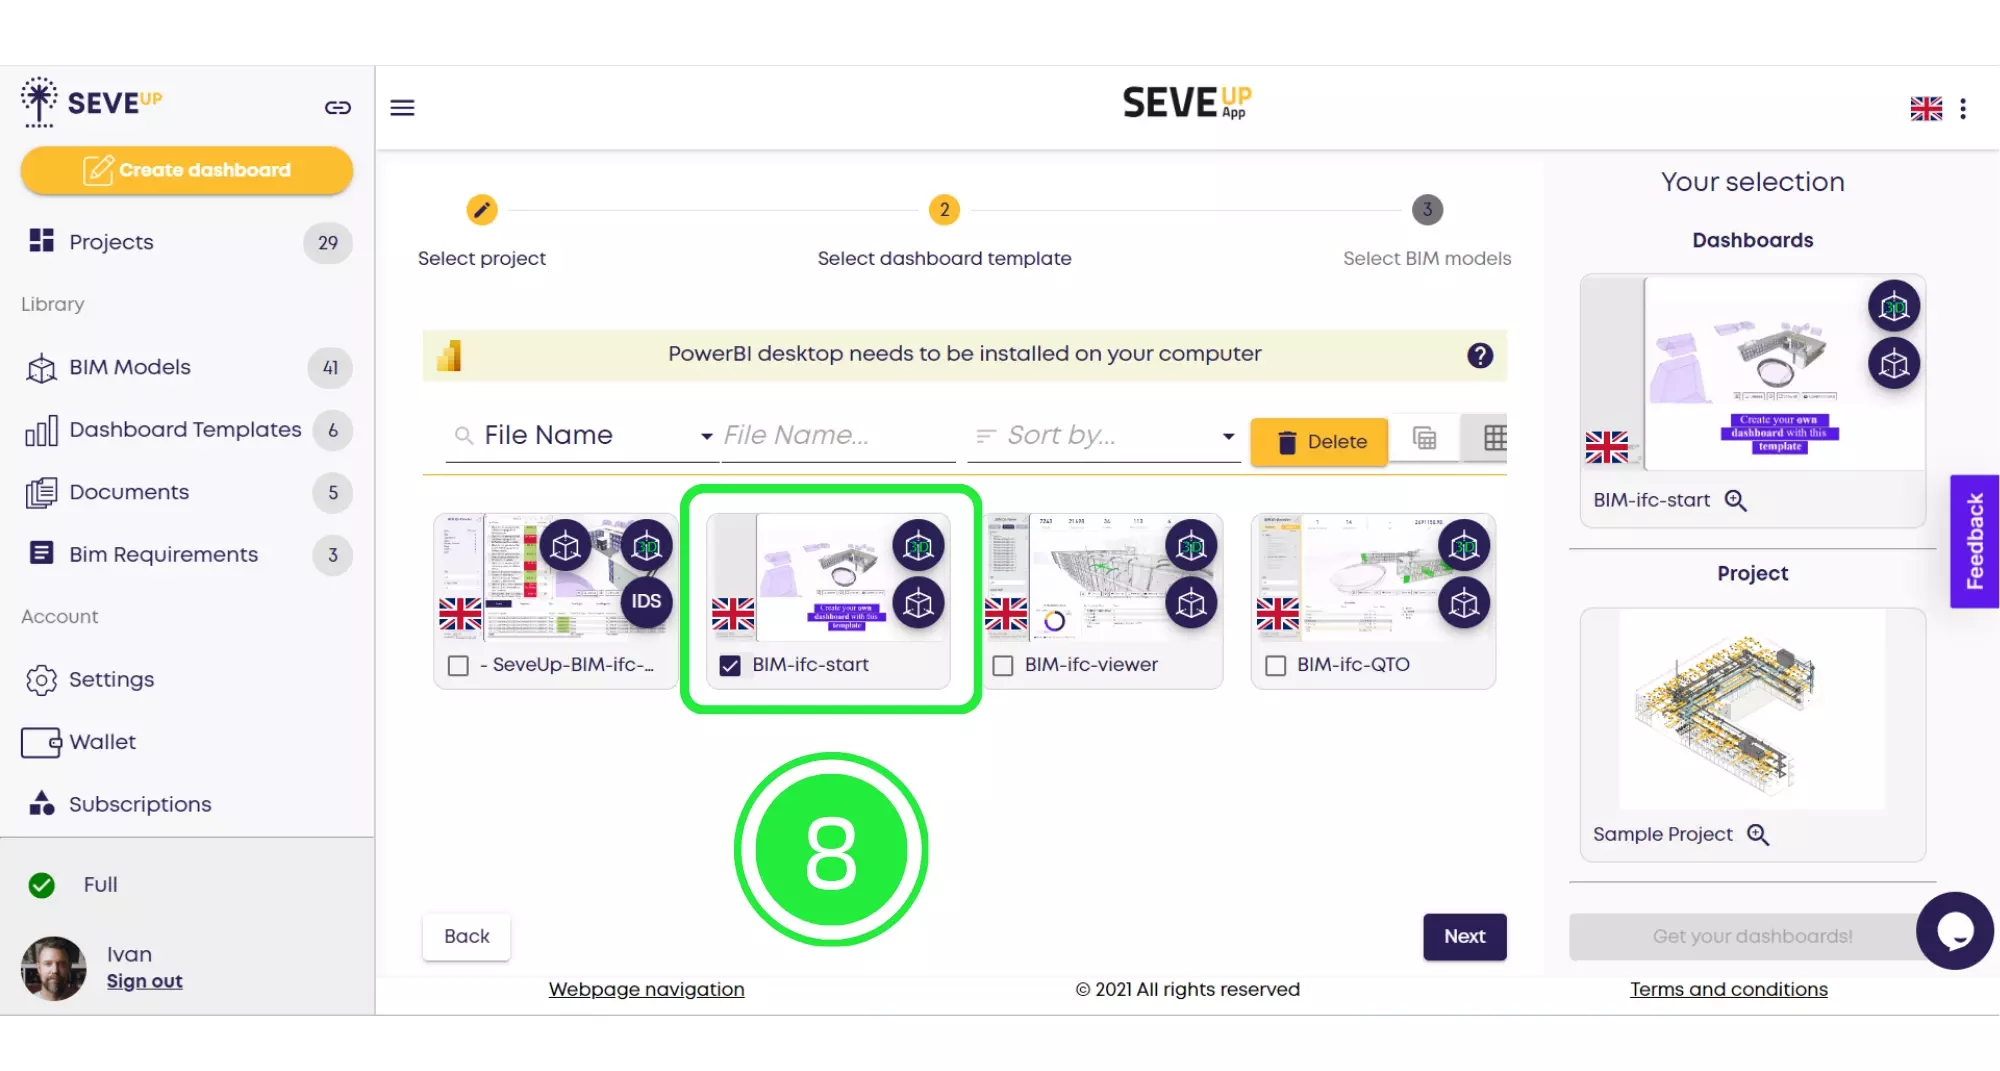
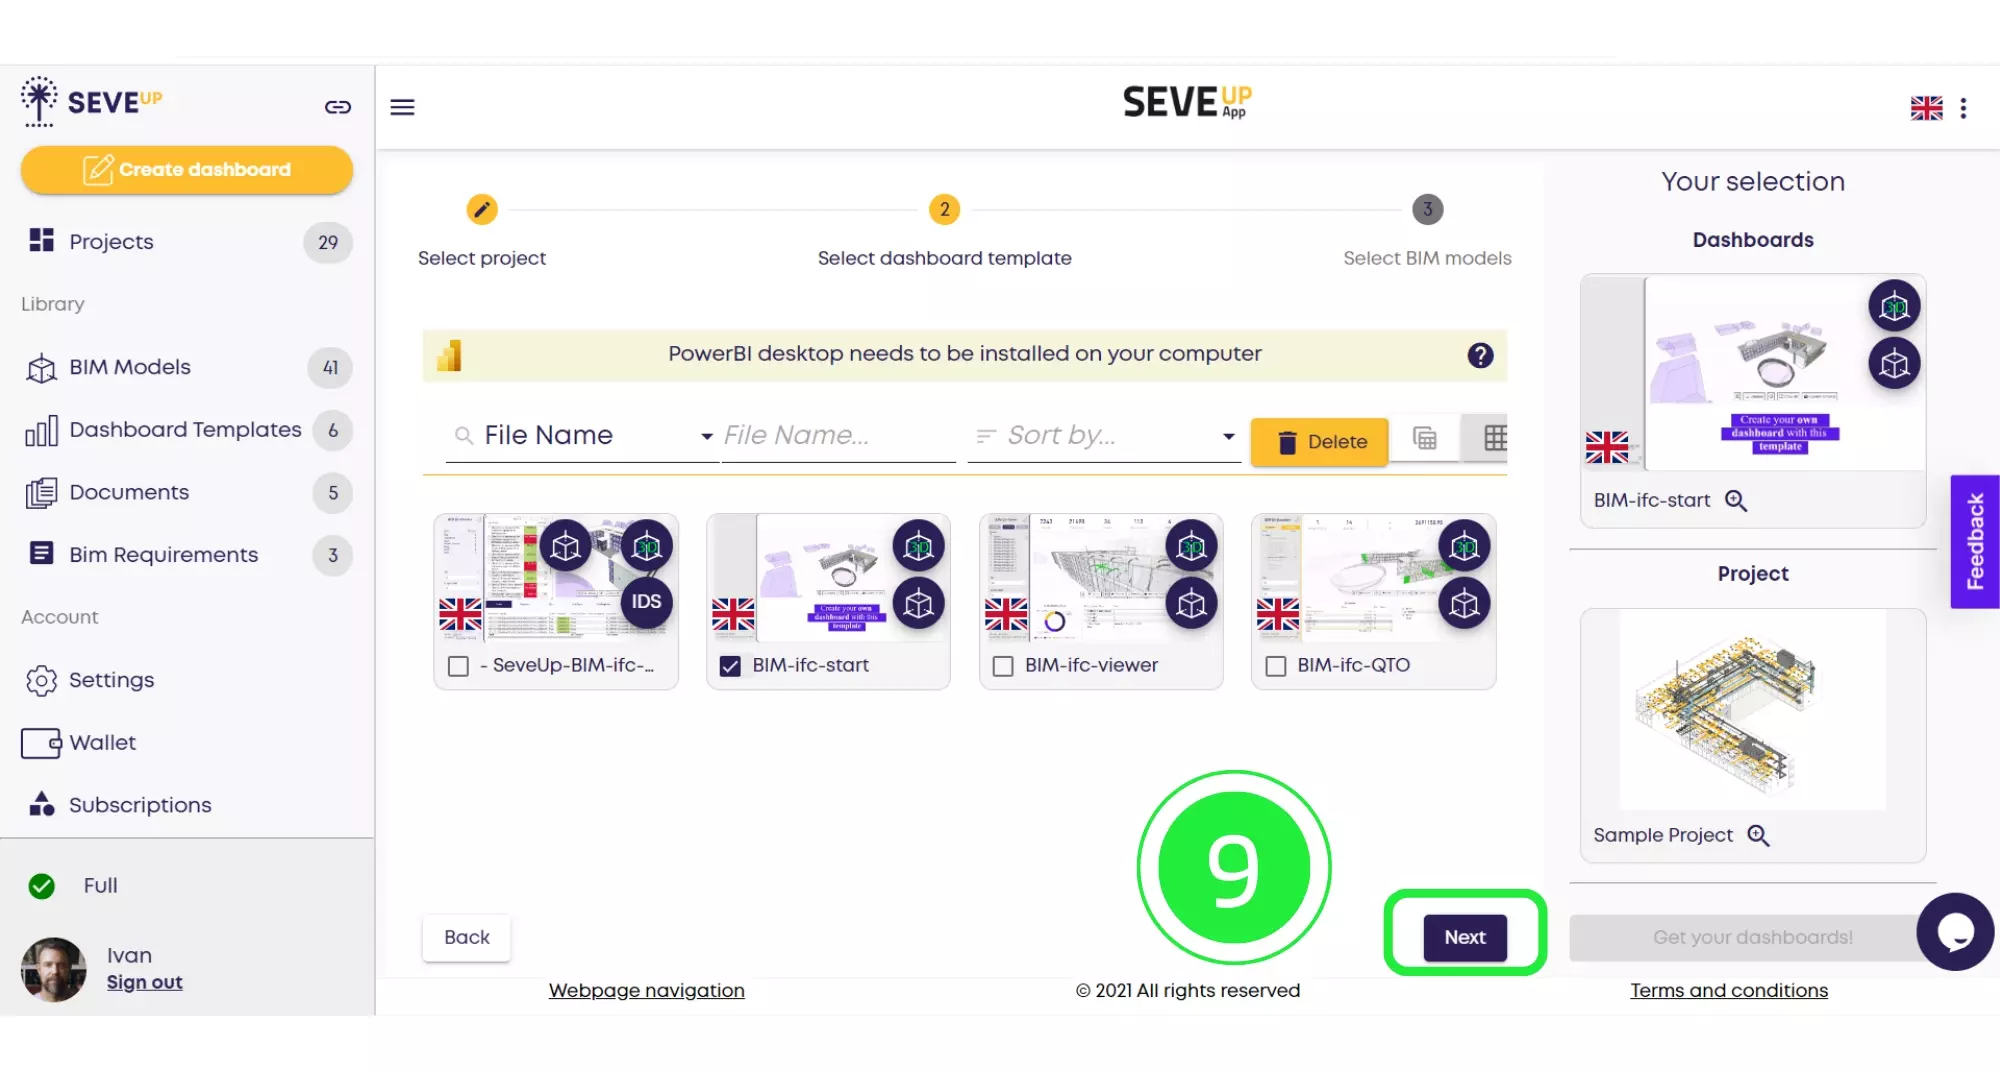
You’re now at the “Select Dashboard Template” tab. Choose your template by marking it, showcasing your project in the right pane, a pivotal moment in BIM dashboard creation.
Click “Next” to proceed, a step closer to finalizing your BIM dashboard in the SeveUp App. You are about to extract BIM insights.
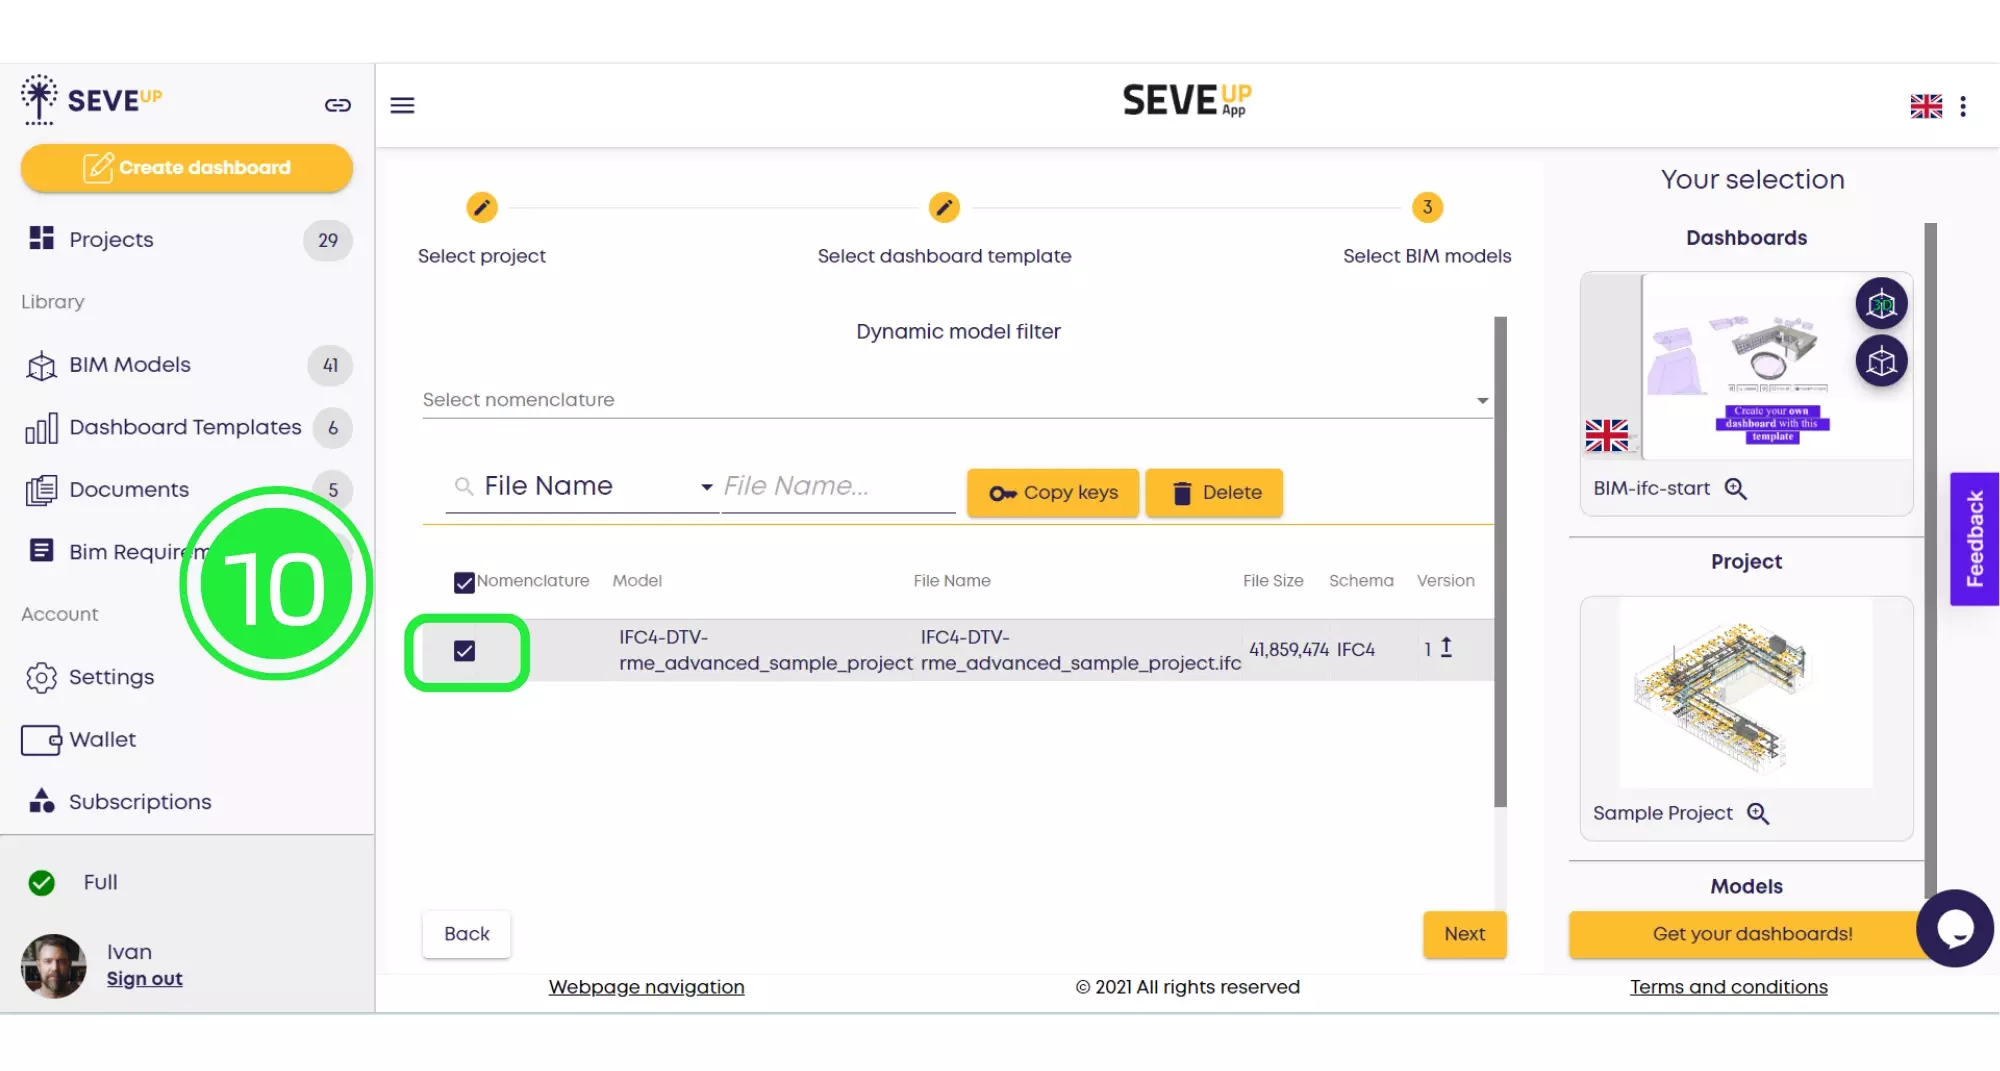
The wizard now brings you to “Select BIM Models” tab. Select the desired BIM model to incorporate, enriching your bim data management strategy.
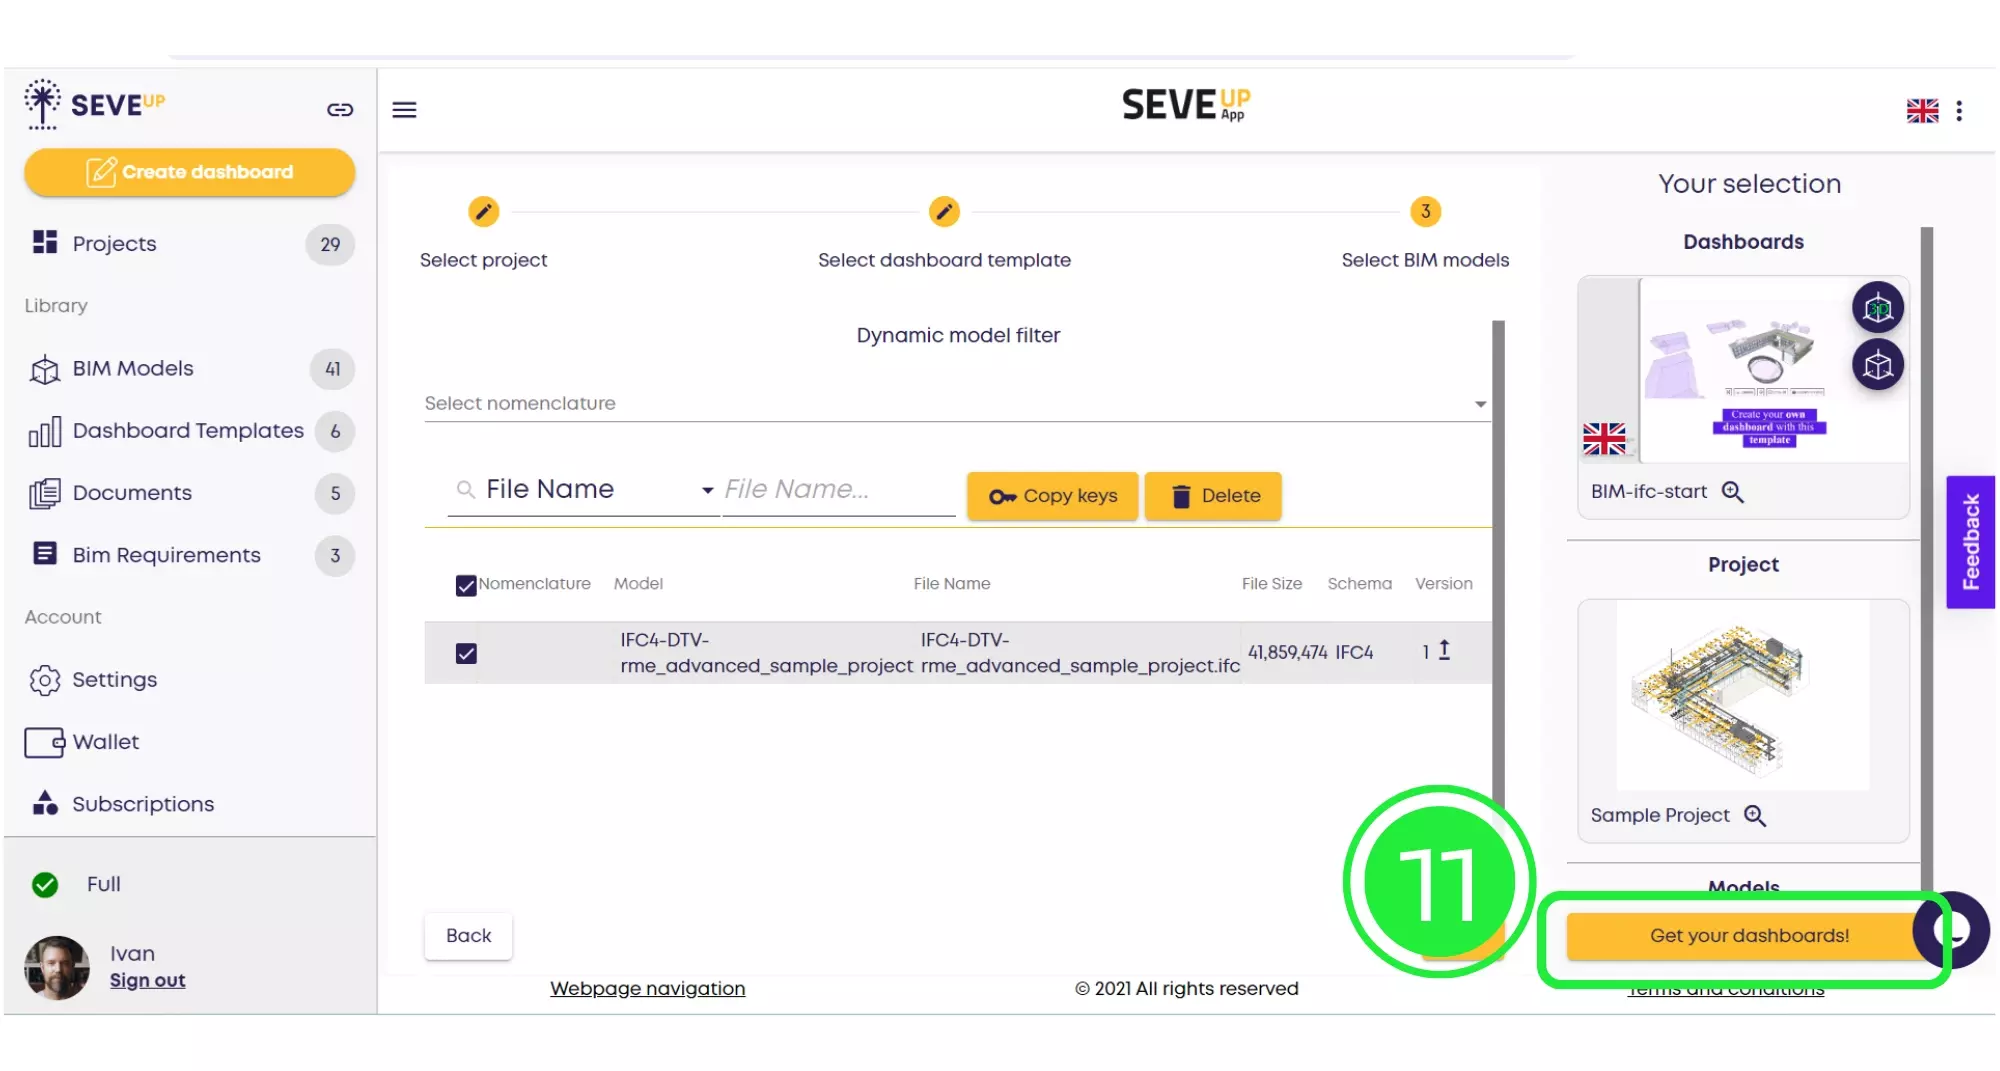
Click on “Get Your Dashboards!” to download your tailored dashboard, a significant milestone in BIM dashboard creation.
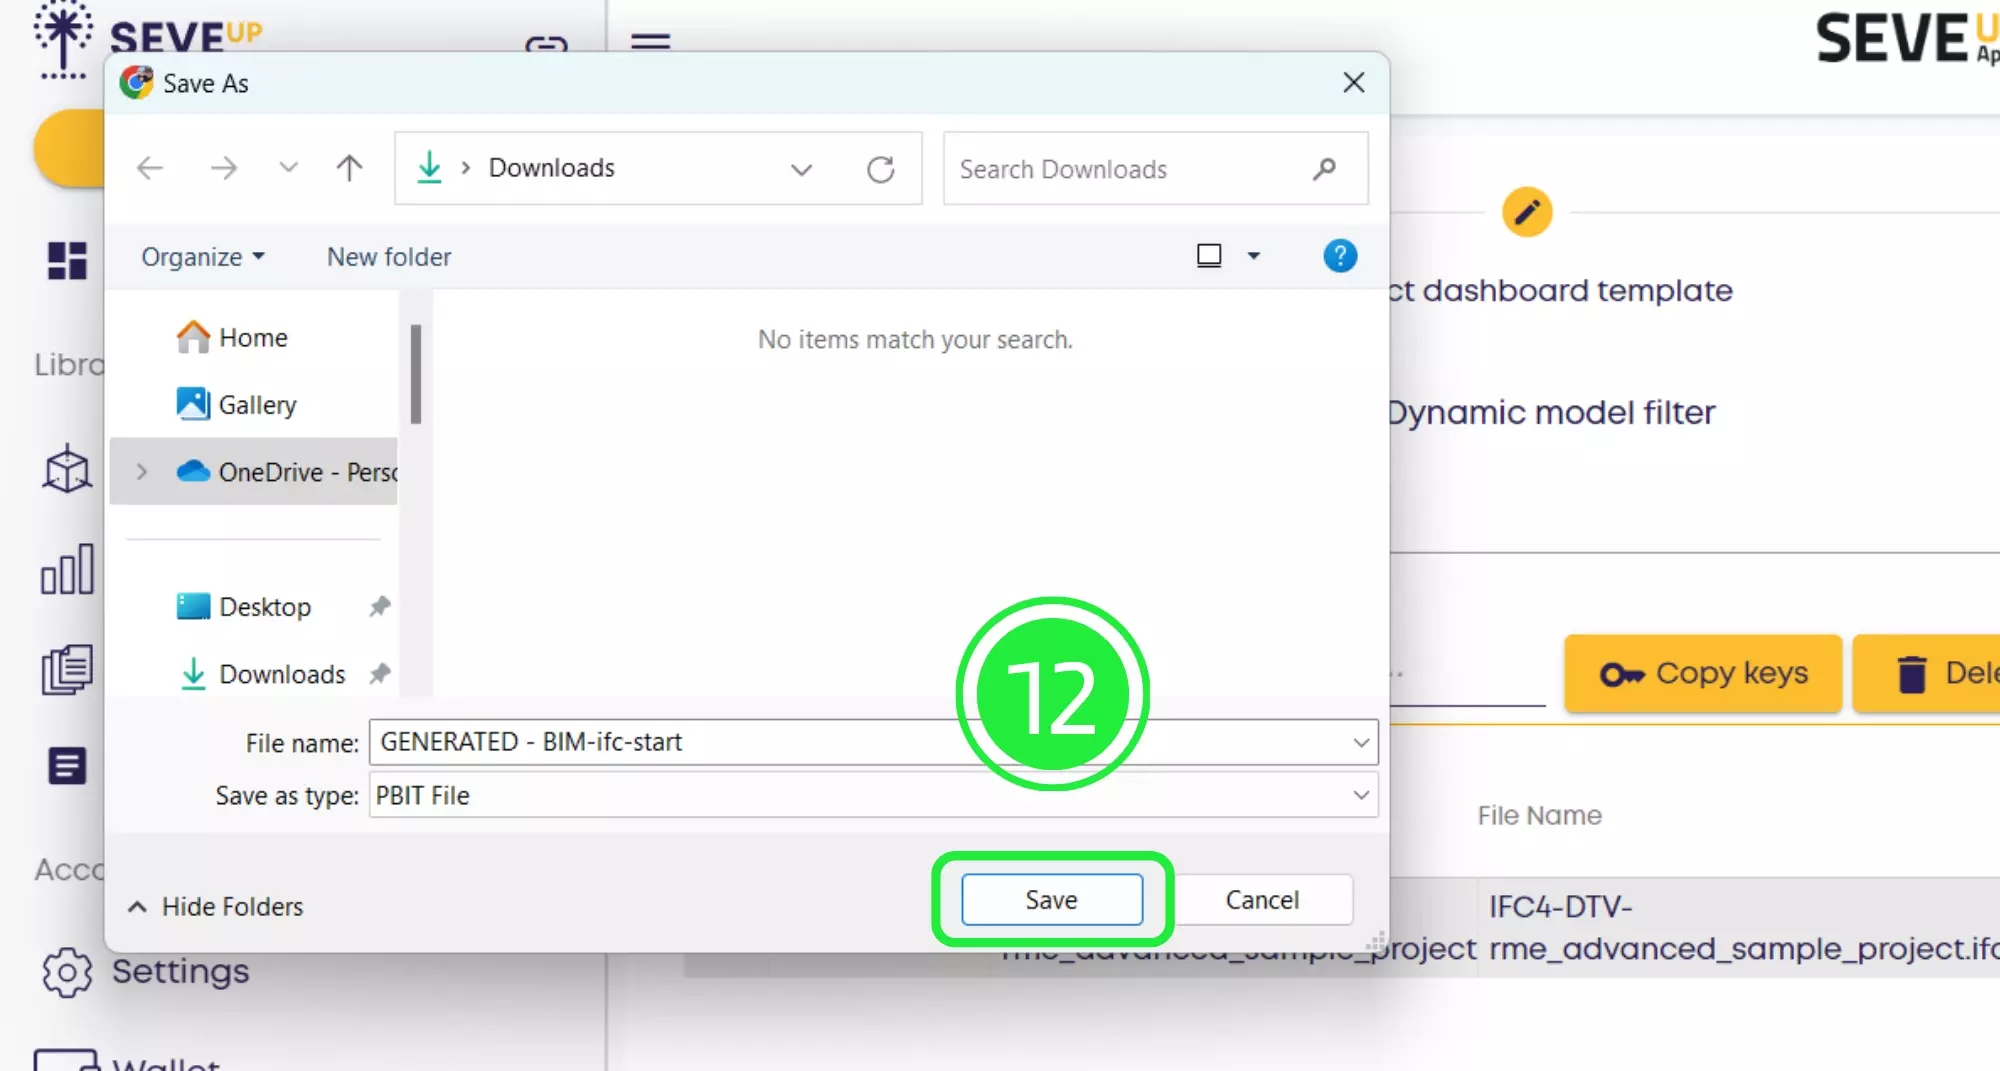
Use the “Save” button to preserve your project on your computer, ensuring all your BIM dashboard efforts are stored securely.
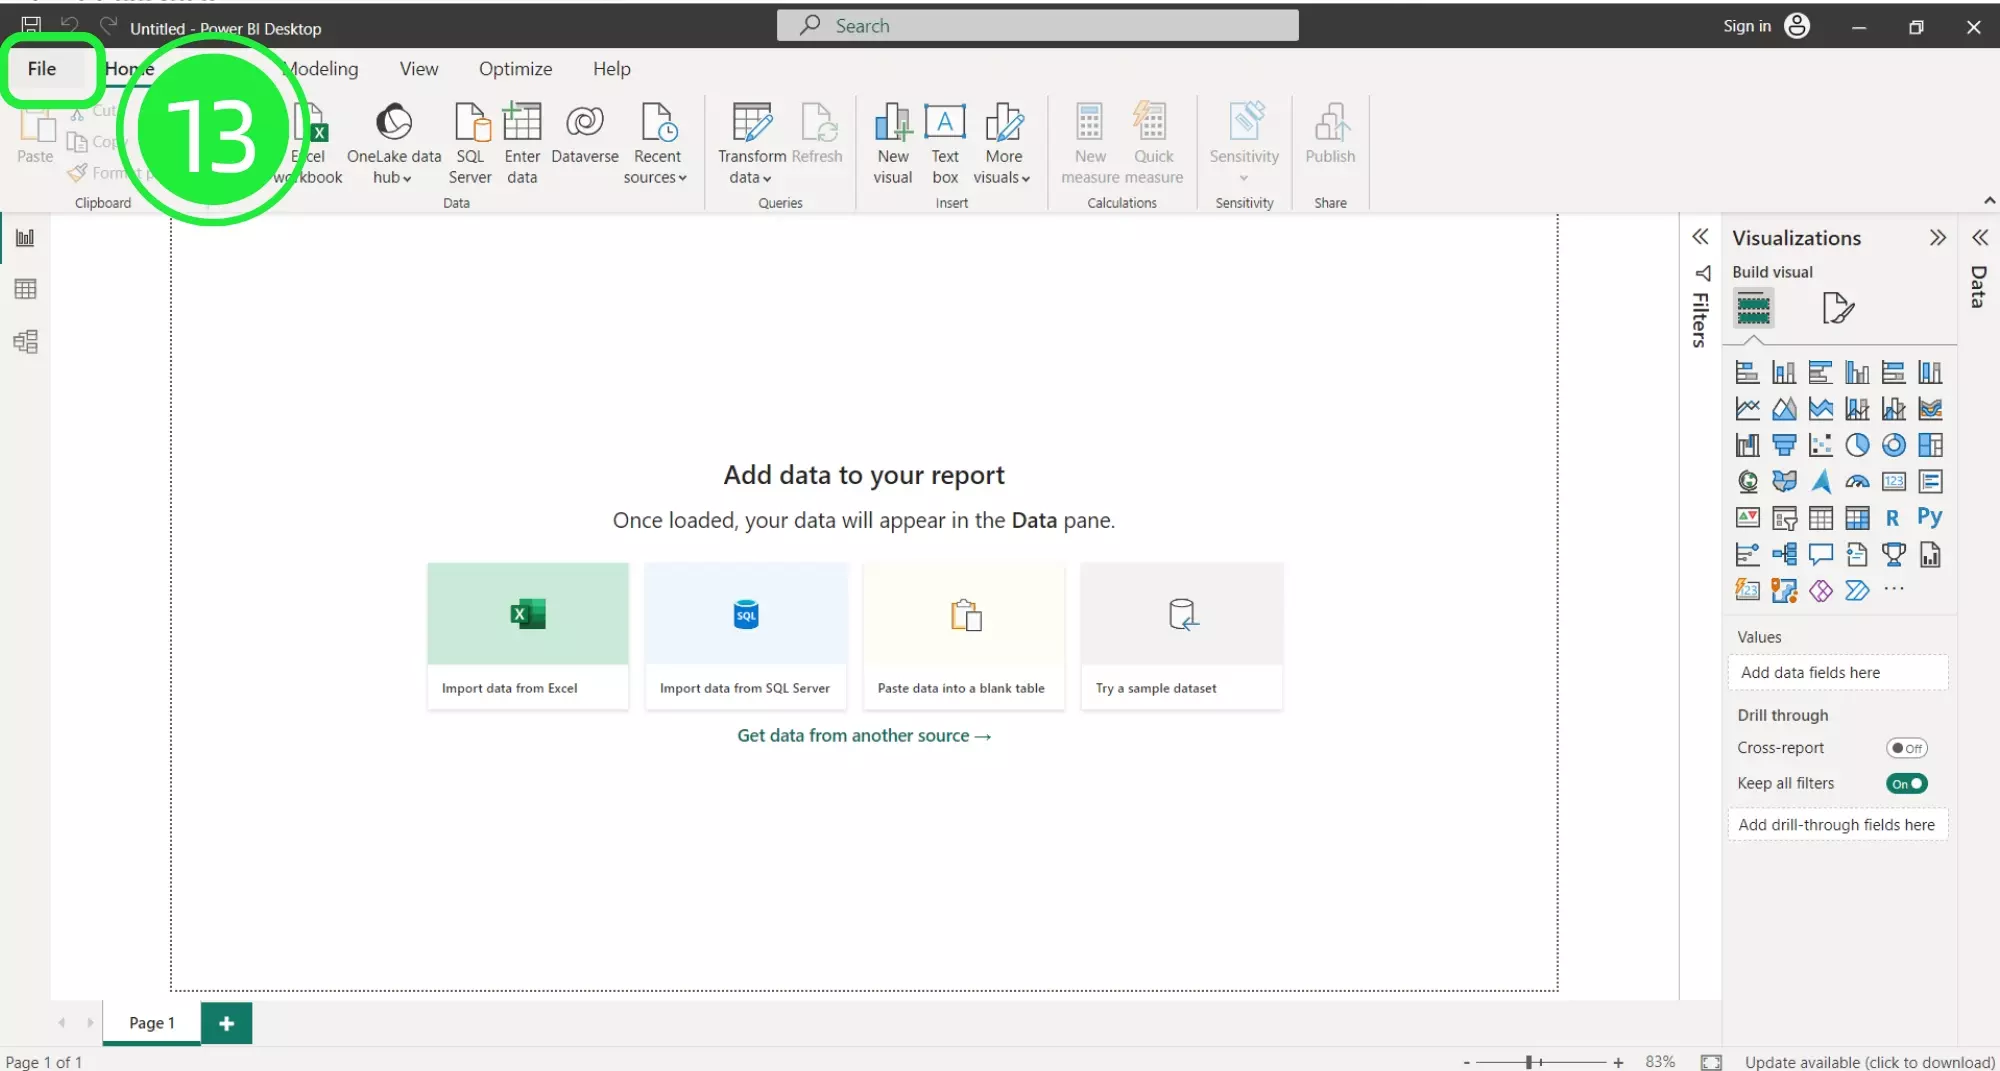
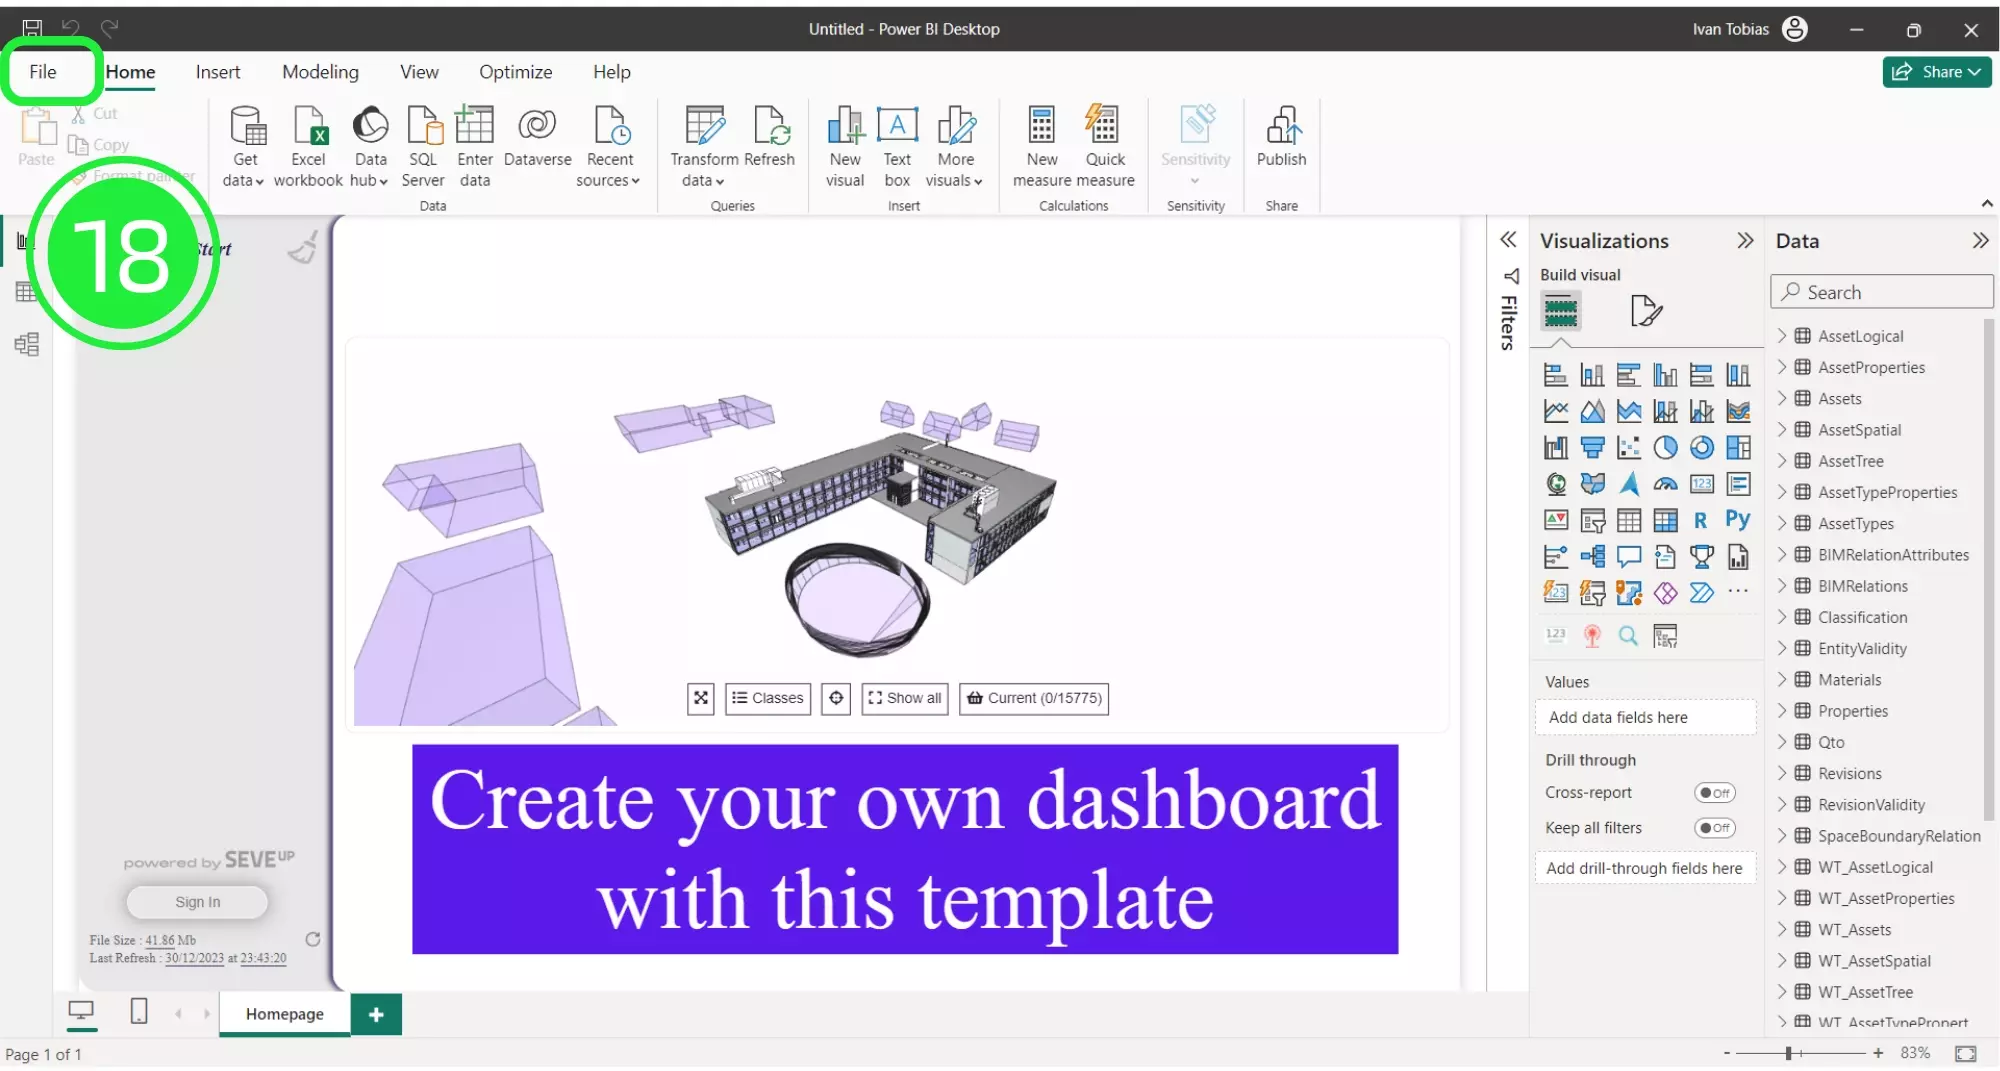
Launch Microsoft Power BI and select “File”, initiating the enhancement process for your BIM dashboard with advanced analytics capabilities.
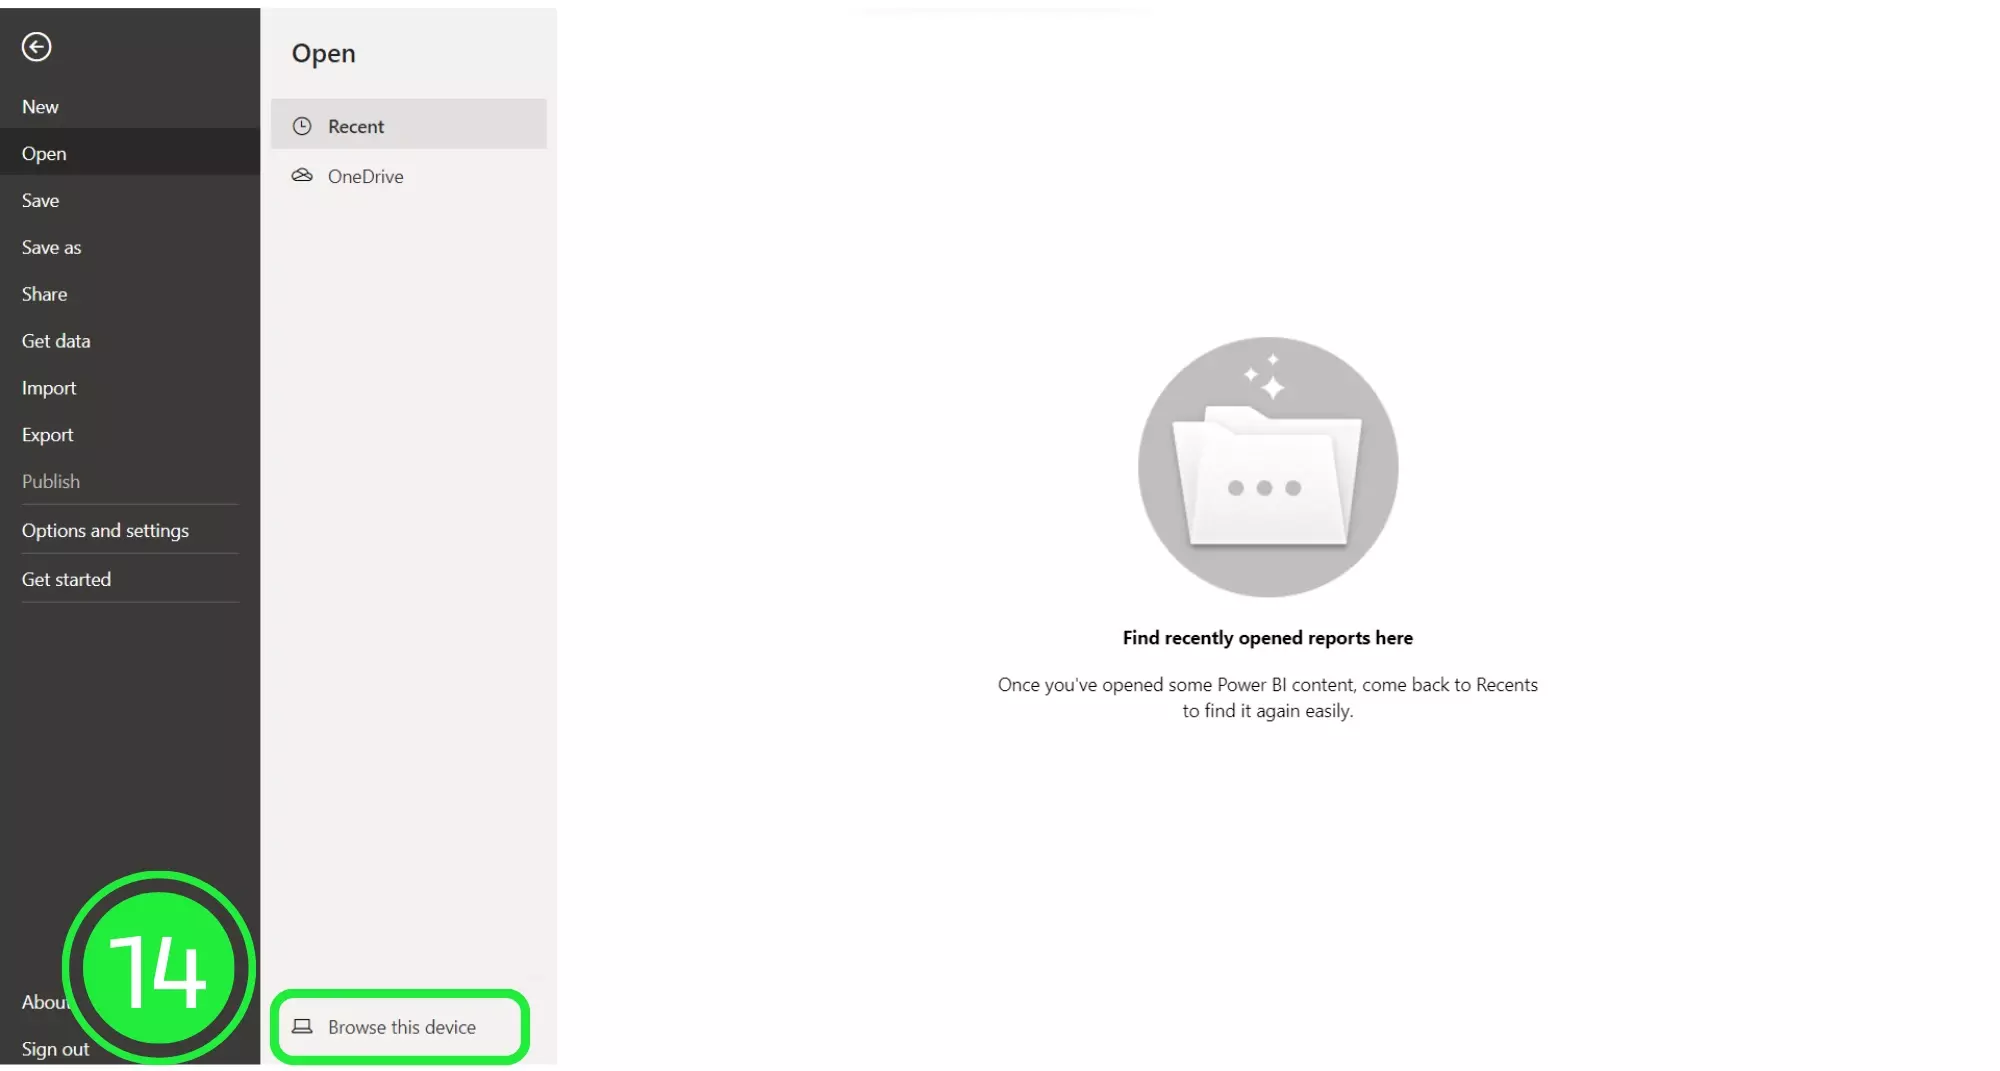
Choose “Browse this device” to locate your dashboard file, a necessary step for integrating advanced BIM data management techniques.
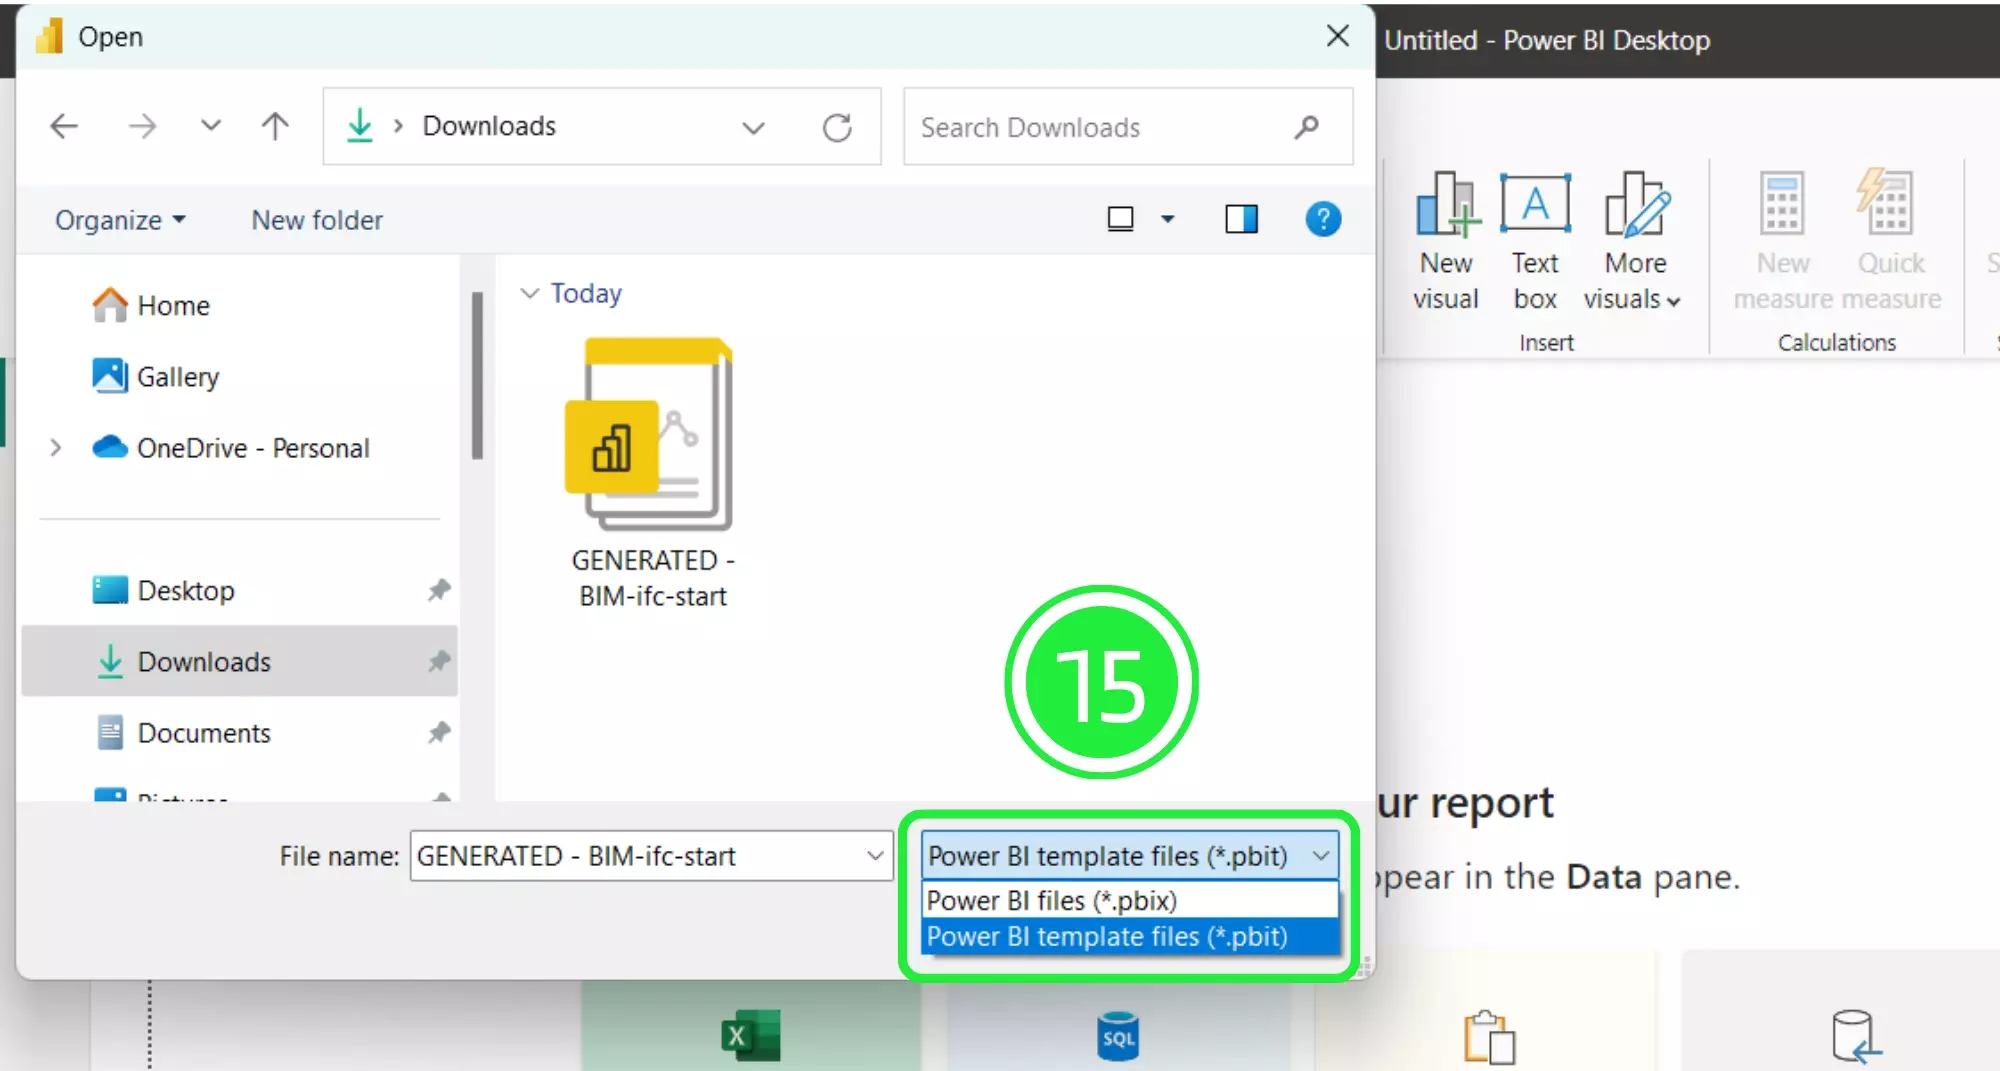
Navigate to the “Open” window’s bottom right in Power BI and select the suitable file extension, focusing on “Power BI Template Files (*pbit),” a strategic move for BIM data visualization.
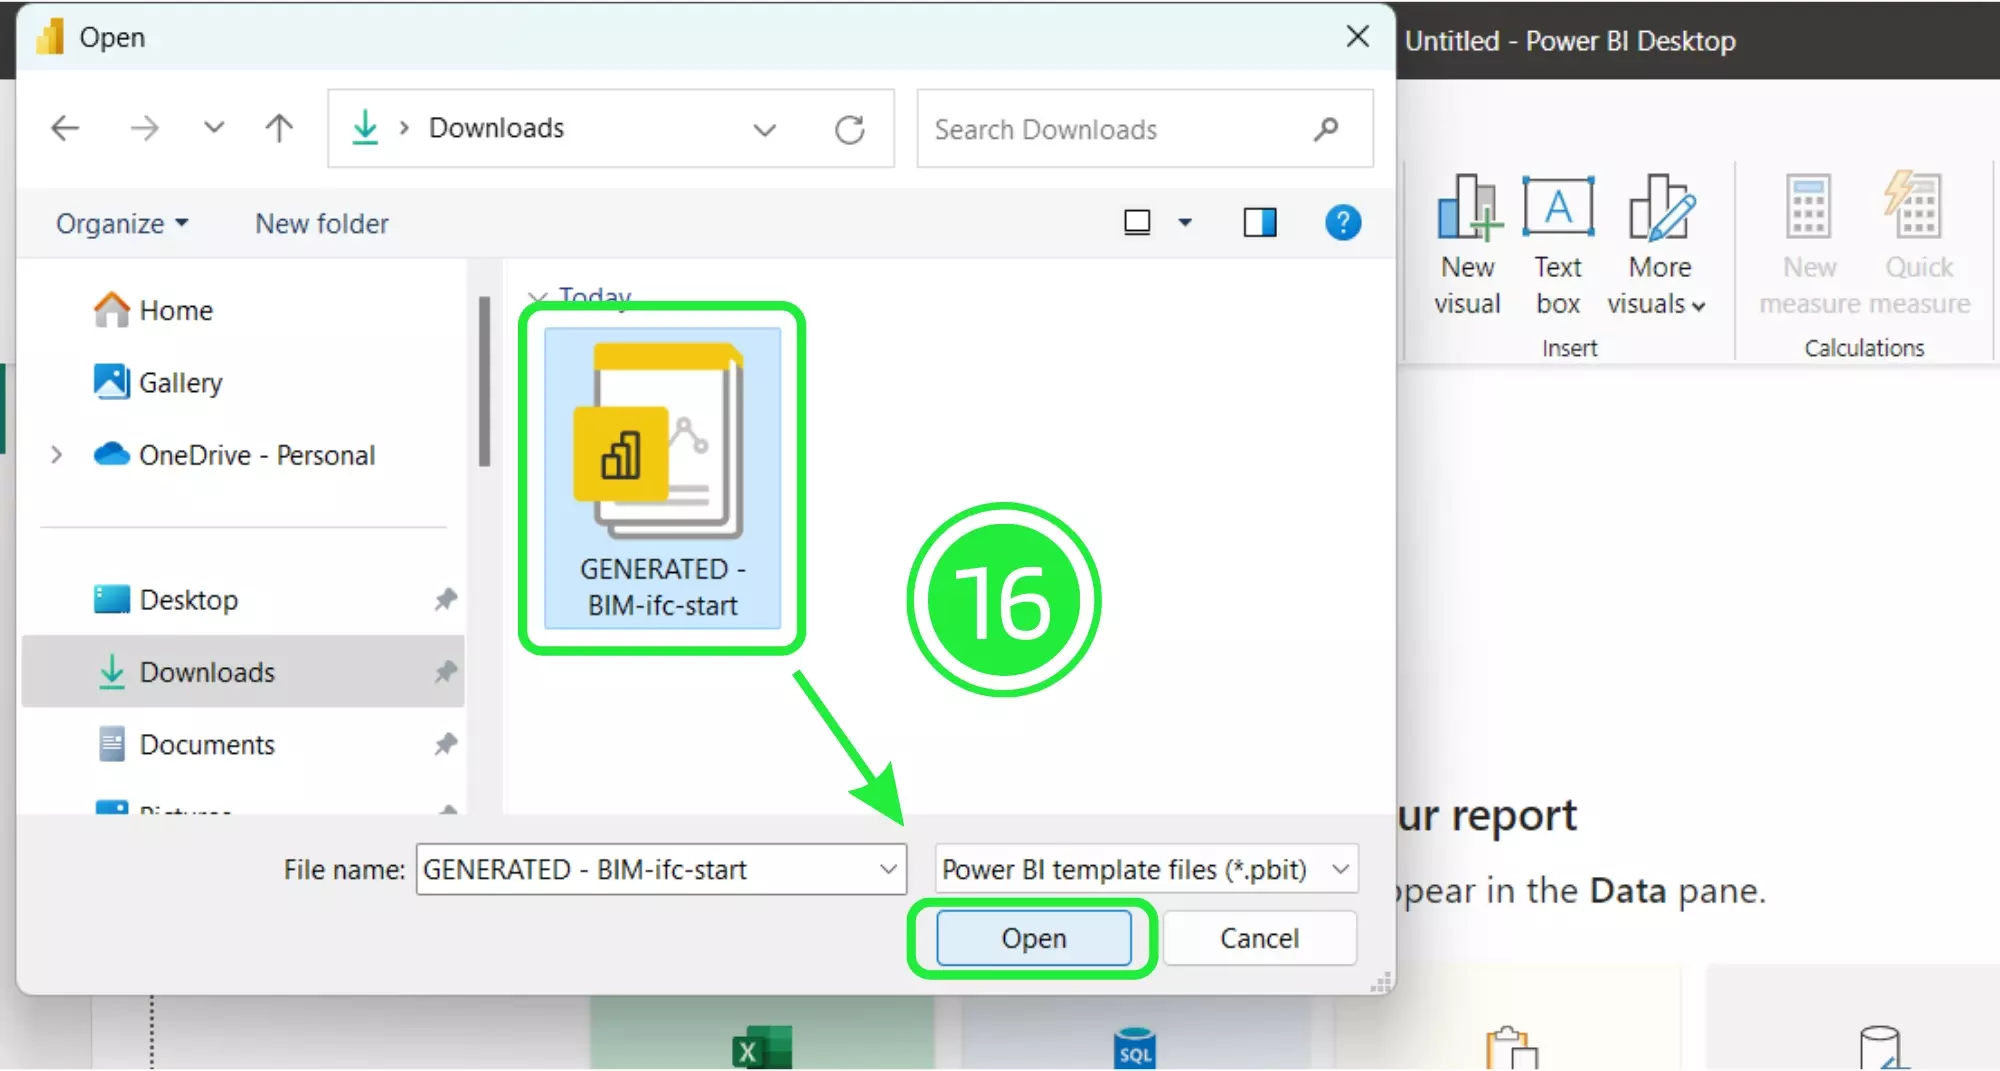
Choose your freshly downloaded dashboard file and press “Open,” seamlessly integrating it into Power BI for a comprehensive BIM dashboard analysis. You are obtaining BIM Insights.
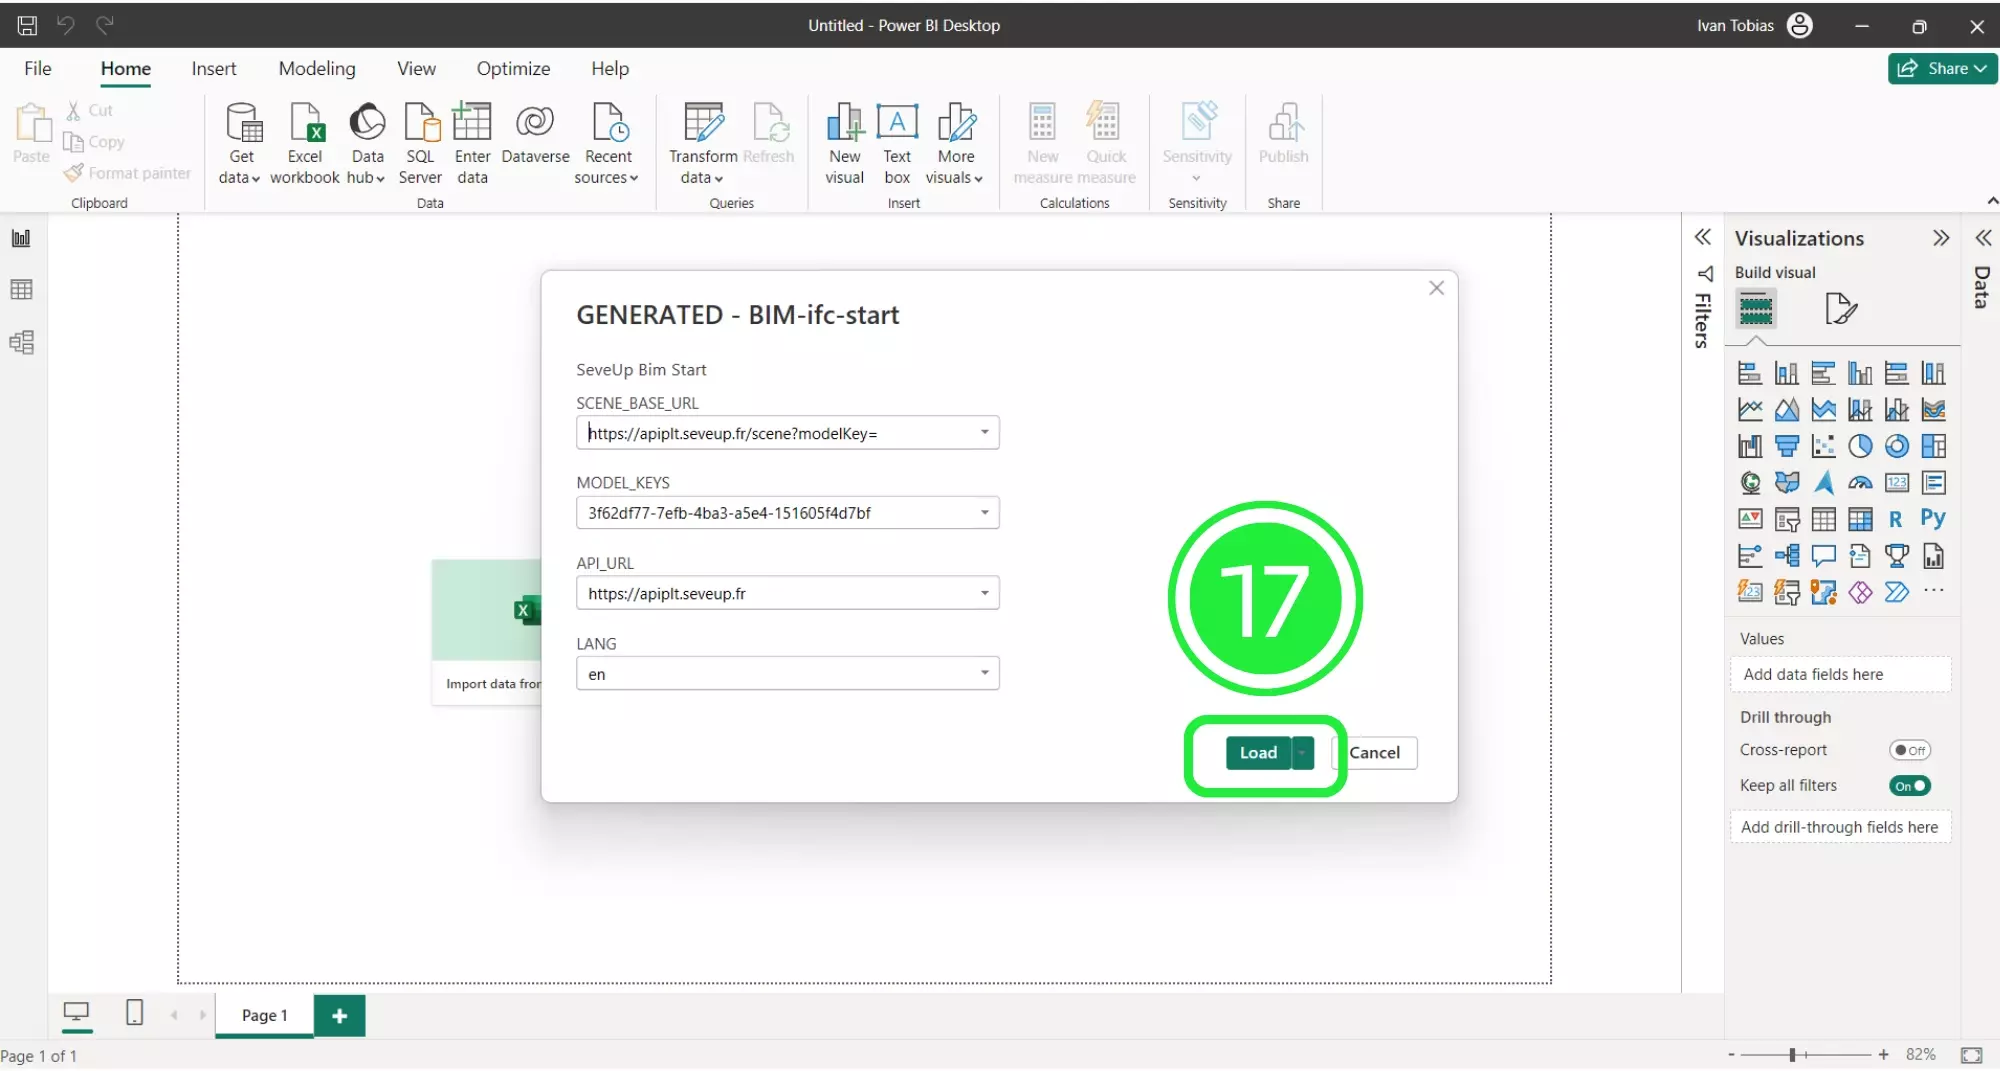
Upon selecting your file, a “Load” popup will appear. Clicking “Load” initiates the integration of your dashboard template file into Power BI, a pivotal moment in BIM data management.
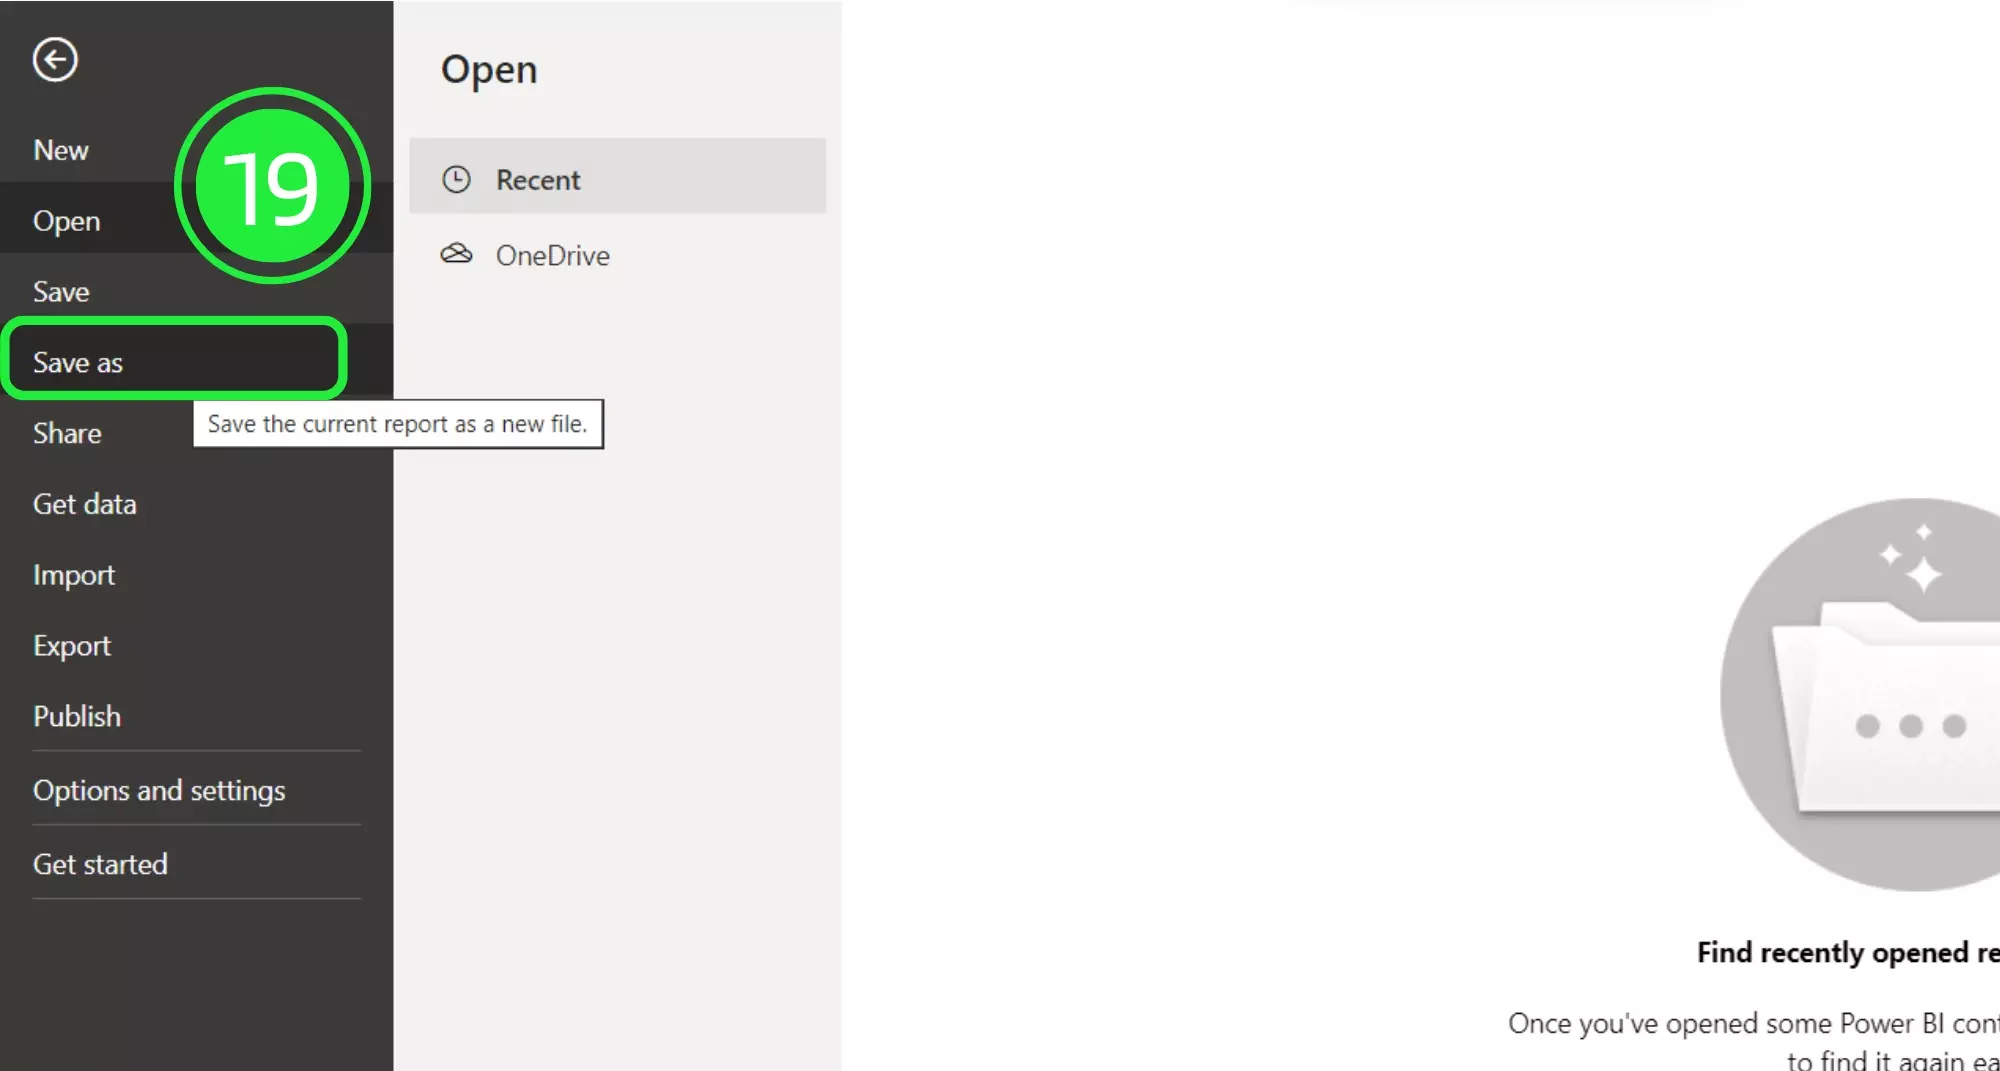
To save your enhanced dashboard as a Power BI file (.pbix), click on “File” and then select “Save As”, ensuring your BIM dashboard is securely stored and accessible.
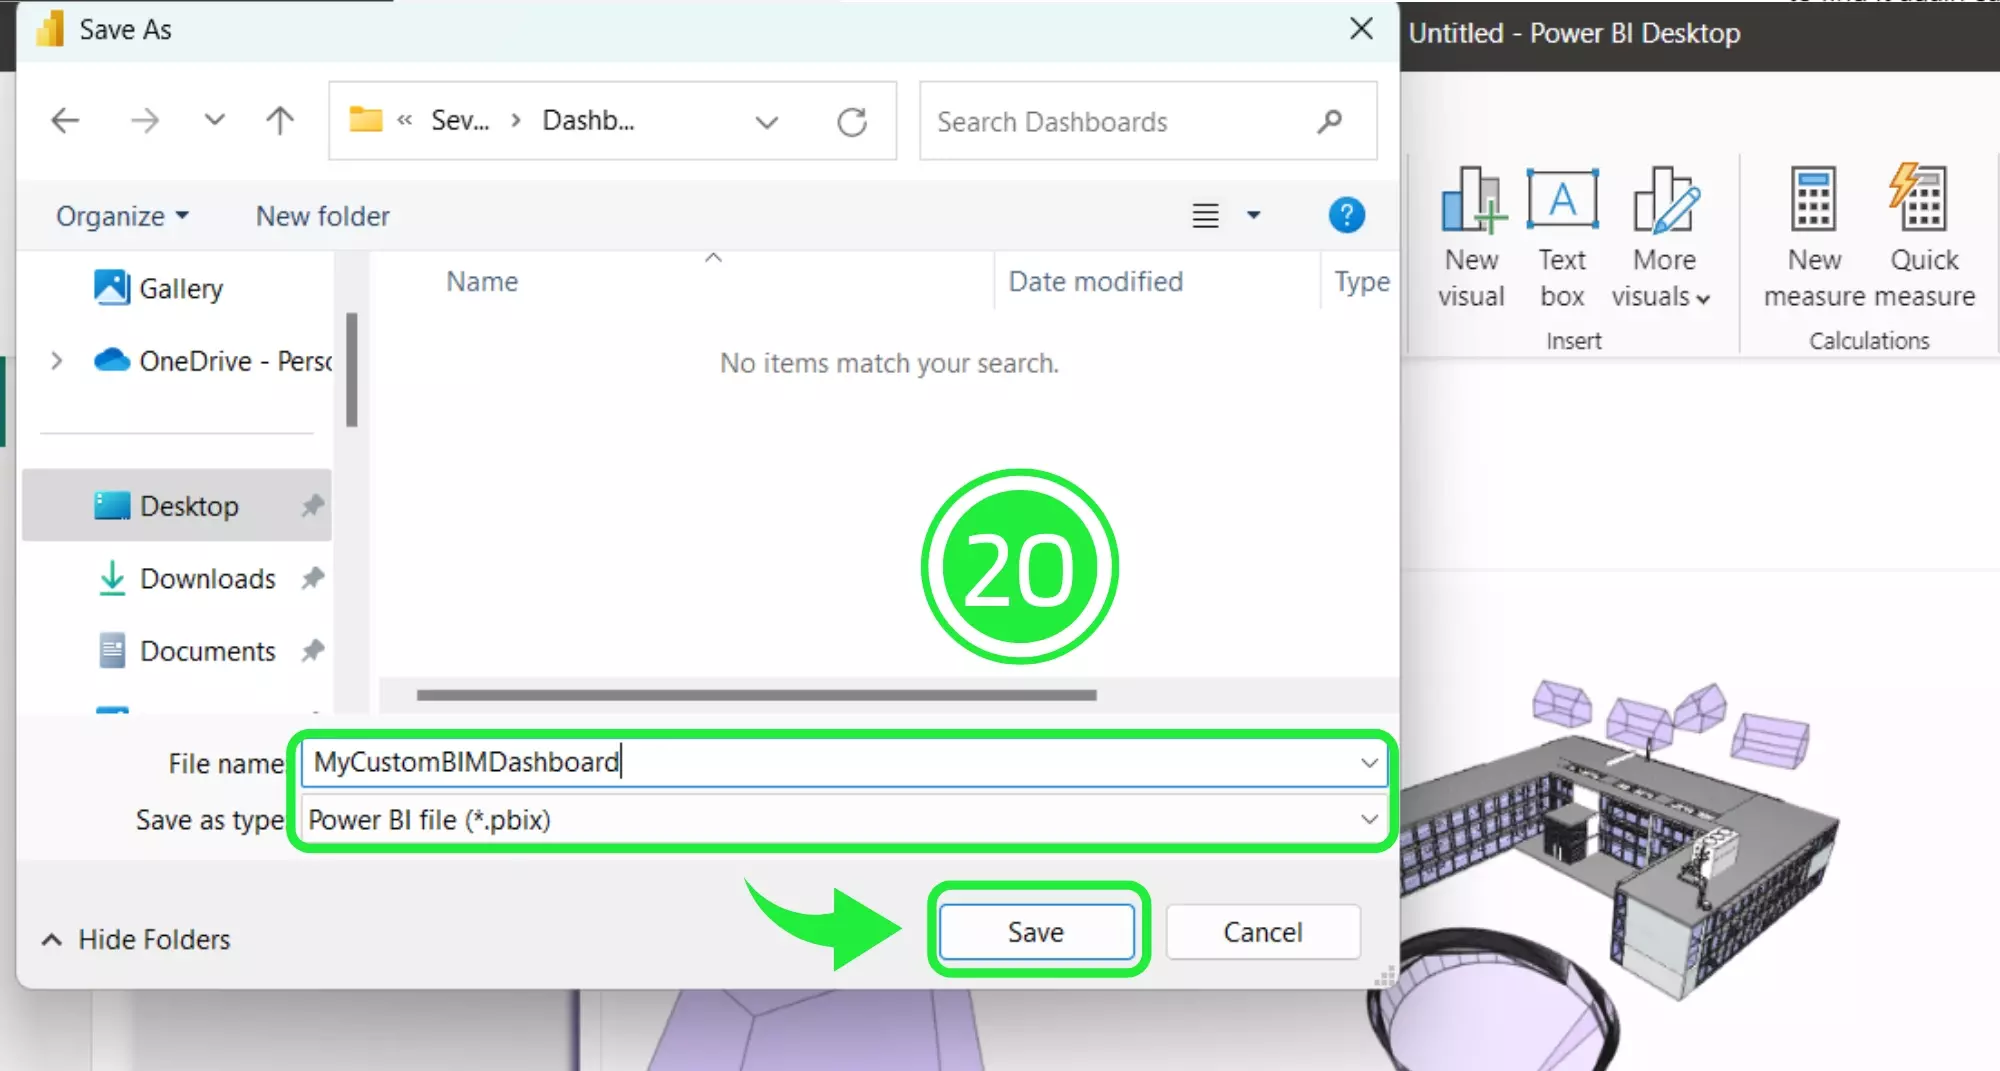
Assign a meaningful name to your file and hit the “Save” button, a testament to your commitment to BIM dashboard creation and project visualization enhancement.
With your dashboard now named and saved, you’ve successfully completed the BIM Model Dashboard Integration process, leveraging Power BI for an enriched data visualization experience.
Now you are ready to deriving insights from BIM data and we can explore the data that will populate the visual.
On the left hand side of the report there are several options for viewing the data. Click on the second option, “Table View” in order to display the data as a table.

Now, choose a WT_AssetSpatial from the list on the right hand side under the Data pane. Now you can view all of the major information about your assets within your BIM Model.

The spatial position is defined by the Site, Building, Building Storey, and Space related columns in this table. If you click on the drop-down arrow on each of the boxes you are able to filter the data further.

Click on the drop down menu button next to “BuildingStoreyAssetName” and you’ll see that you can access details according to each level of the building. We’ll be using this data specifically to populate our visual.

In order to create the visual we need to return to the 3D BIM Viewer and the dashboard. To go back to it, click on “Report View” on the left hand side.

On the right hand side of the Power BI Interface is the Visualisations pane. Click on the “Slicer” button to add the visual to your dashboard.

Place your visual to the side of the 3D BIM Viewer. Resize it to make sure that it doesn’t obstruct it or any other visuals that you have placed on the dashboard.

Under the Data pane, click on the drop down button on “WT_AssetSpatial” to expand the menu.

Drag and drop “BuildingStoreyAssetName” over to “Field” under “Build my visual” in the Visualisations pane.

Now we want to set up the visual as a dropdown list instead. Click on “Format Your Visual” to access the visuals settings.

Click on “Slicer Settings” to access the differents options.

Under “Visual”, drop the menu under “Slicer settings” and choose “Dropdown” to change the style of the visual and you’ll see that it has now changed to reflect this.

Clean up the look of your dashboard by resizing the visual so that the information sits neatly inside it with no wasted space. When you have multiple visuals added to the dashboard this helps to keep everything tidy.

We can change the field name of the visual so that it’s reflective of what the visual shows.
Under the Visualisations pane click on “Add data to your visual”.

Change the name of your visual by double-clicking on the “BuildStoreyAssetName” box under “Field” so that it is highlighted and changing the name to “Level”.

This visual now allows you to filter all of your BIM model assets by level. Just click on the arrow to drop the list down and choose a level.

Click on the “Update” button on the SeveUp 3D BIM Viewer to see all assets on that particular level making your entire dashboard now filtered by level as a primary filter.

All of the filtered assets are now highlighted. In this case, the BIM Viewer is highlighting the entire floor’s assets.


Before uploading the Power BI custom template back into the SeveUp app, it needs to be saved as a template file with the extension .PBIT. To do this click on ‘File’ in the top left corner.
Select “Save As” from the drop down menu.

Click on “Browse this device” at the bottom of the screen.

Choose to save the file as a Power BI template file (.pbit).

Click on the “Save” button to save your project to your computer.

Press on “ok” when the “Export a Template” popup appears.

Open the SeveUp App again and click on “Dashboard Templates” on the left hand side.

Click on the large “Upload Dashboard Template” button in the centre of the folder.

When the pop-up appears, click on “Data Source”.

Check off all of the groups of tables under BIM and also make sure to check the BIM 3D option so that the 3D model is included as well.


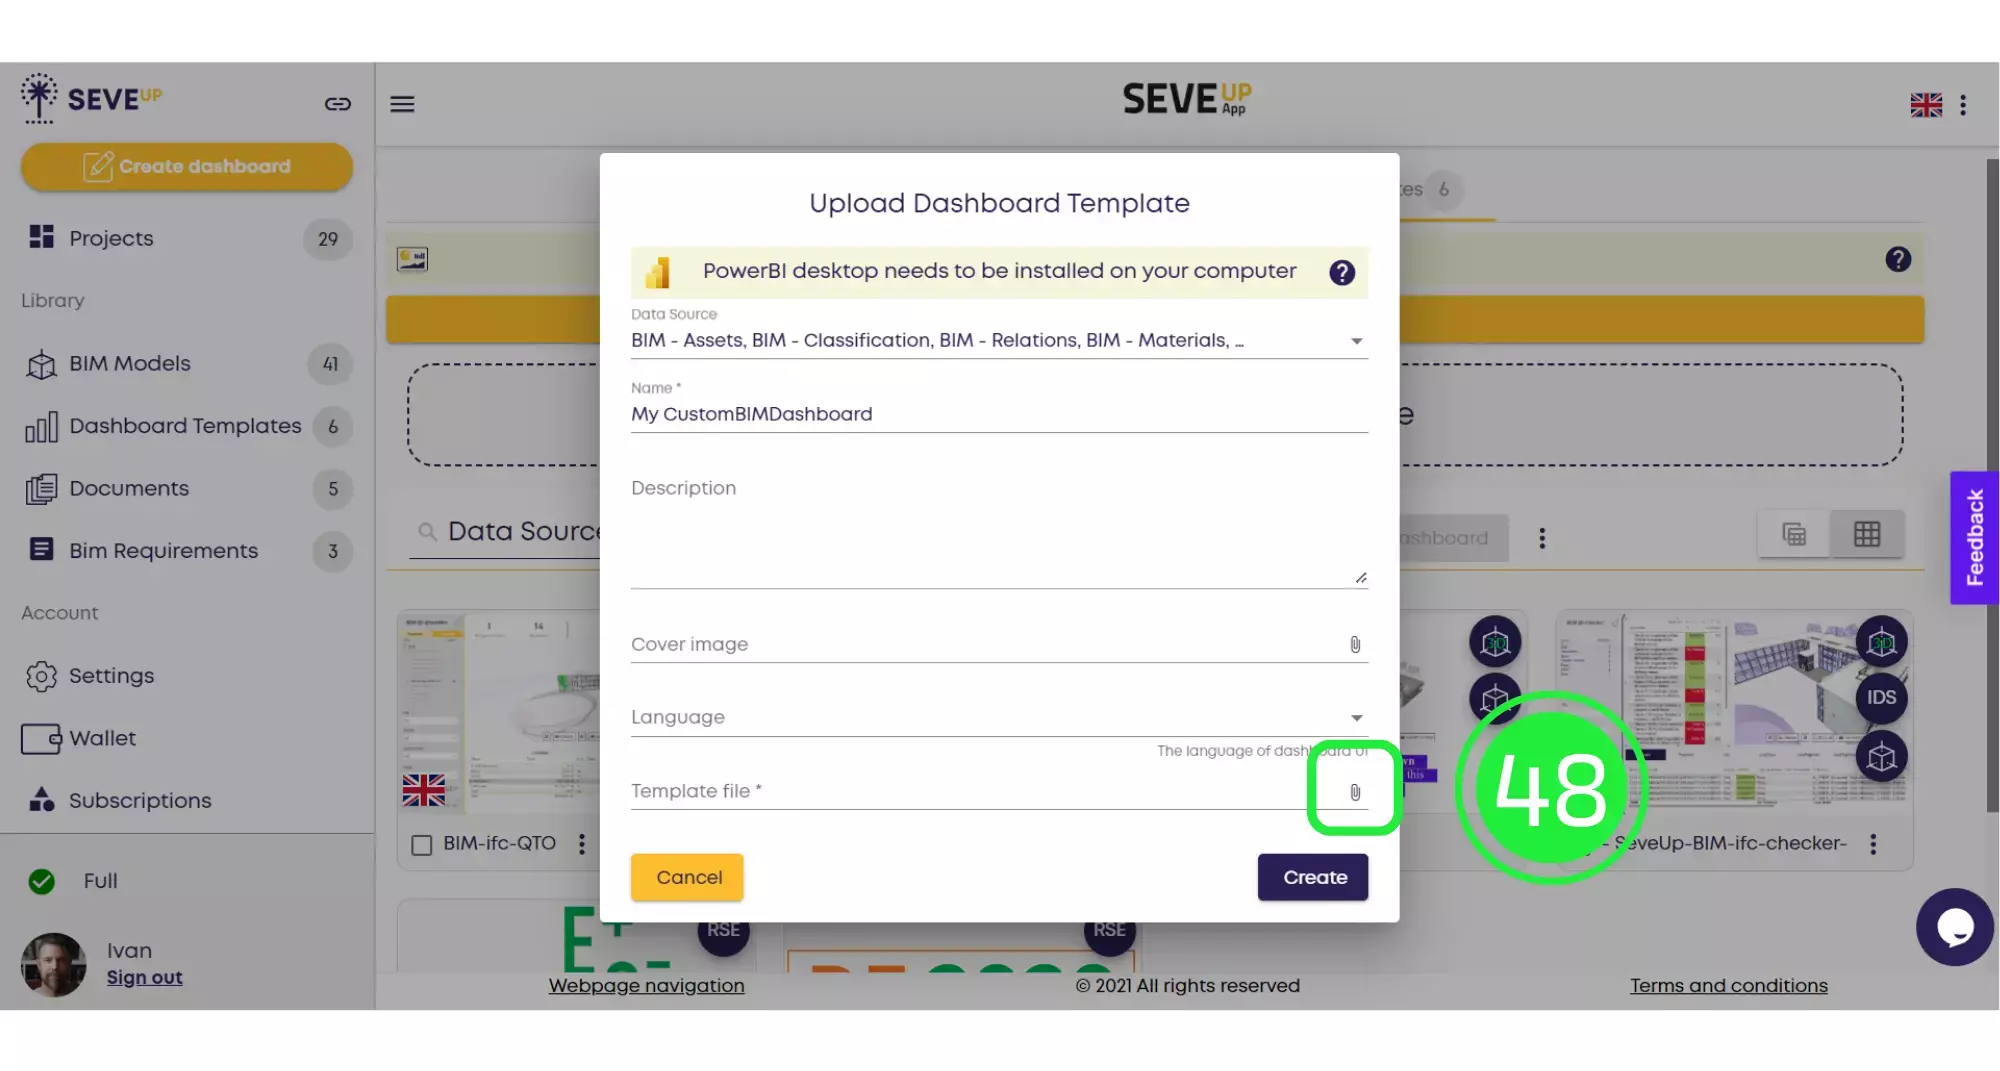
Enter the name and description of your project. You can also attach a cover image or choose a different language.

Click on the “Attach File” icon on the “Template File” line.
From the pop-up menu choose “Local Source” to attach the file from your computer.

Select your template and click on “Open”.

Click on “Create” to finish uploading your template into the SeveUp app.

Your newly created template file will now appear in the Dashboard Templates folder and it can be used in any number of projects without the need to create a brand new template each time.

Want to get started with your very own BIM project? You’ll be surprised by just how easy it is. Create your own free account is SeveUp today and give it a try.


Want to get started with your very own BIM project? You’ll be surprised by just how easy it is. Create your own free account is SeveUp today and give it a try.

Unlock the power of your building data with SeveUp. Tailored dashboards, seamless integration
🎓 Free BIM Checker Training Learn how to automate your BIM model checks and get certified. Register for Free Click
Learn More🎓 Free BIM Checker Training Learn how to automate your BIM model checks and get certified. Register for Free Click
Learn More🎓 Free BIM Checker Training Learn how to automate your BIM model checks and get certified. Register for Free Choose
Learn More