Trusted by companies
all over the world:
This tutorial will explore the dynamic capabilities of Power BI in conjunction with the SeveUp App.
Today, we learn how to count BIM properties with Power BI in 1 minute. In today's data-driven world, the ability to extract meaningful insights from BIM data is crucial for informed decision-making and efficient project management.
Through the seamless integration of Power BI and SeveUp, we have the tools to analyse and quantify the properties within our BIM models with precision and ease. Our focus is on utilising Power BI's Card visual to accurately count the number of BIM properties in our dataset.
Whether you're a project manager needing to track the number of assets in a building or a BIM coordinator analysing property distribution, this will equip you with the knowledge and skills to harness the power of Power BI and SeveUp for effective data analysis by leveraging Power BI's Card visual SeveUp’s dataset to gain valuable insights into the composition of our BIM models.
By the end of this tutorial, you'll have the tools and techniques to confidently count BIM properties, enabling you to streamline your BIM process and drive efficiency in your projects.
Today, you will learn how to count your BIM properties via Power BI in just 1 minute.
Start off by logging in to your SeveUp App account and then click on the “Create Dashboard” button.
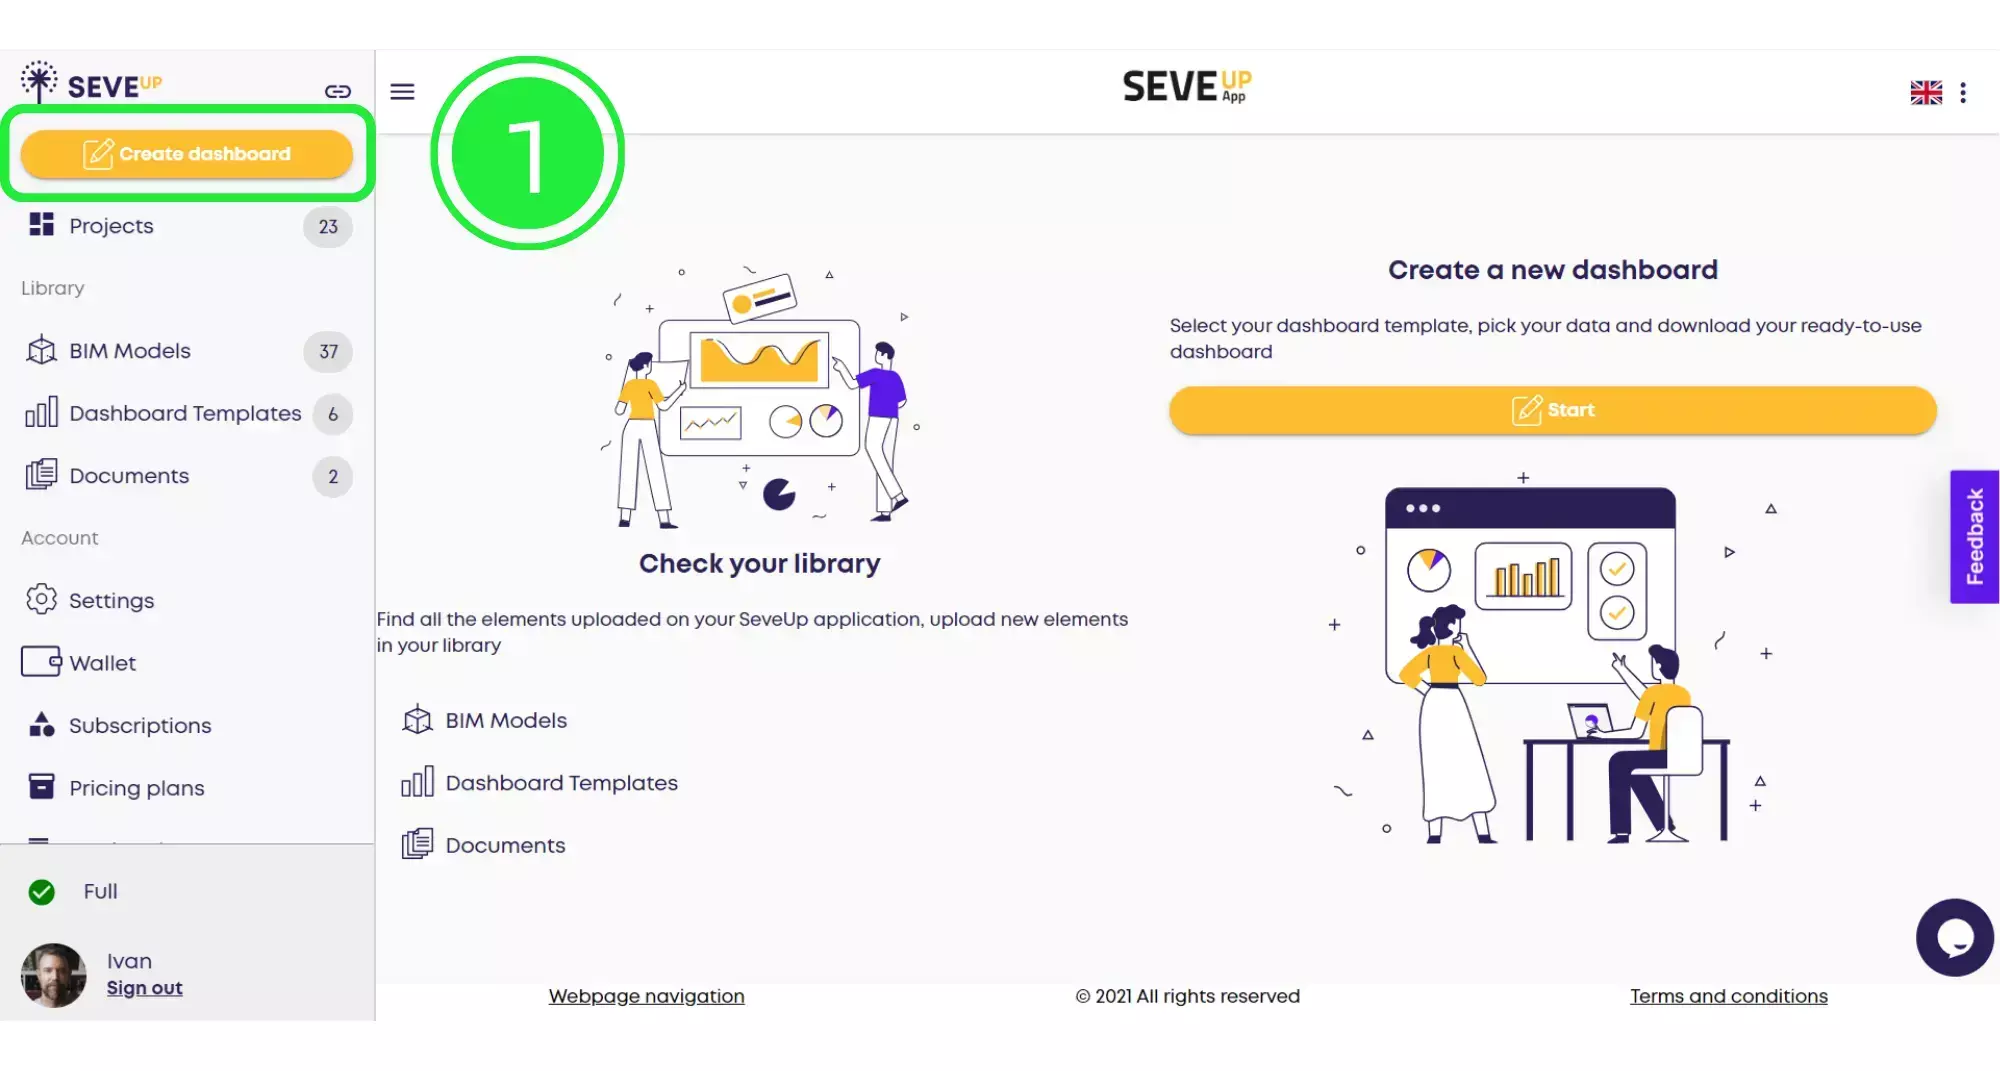
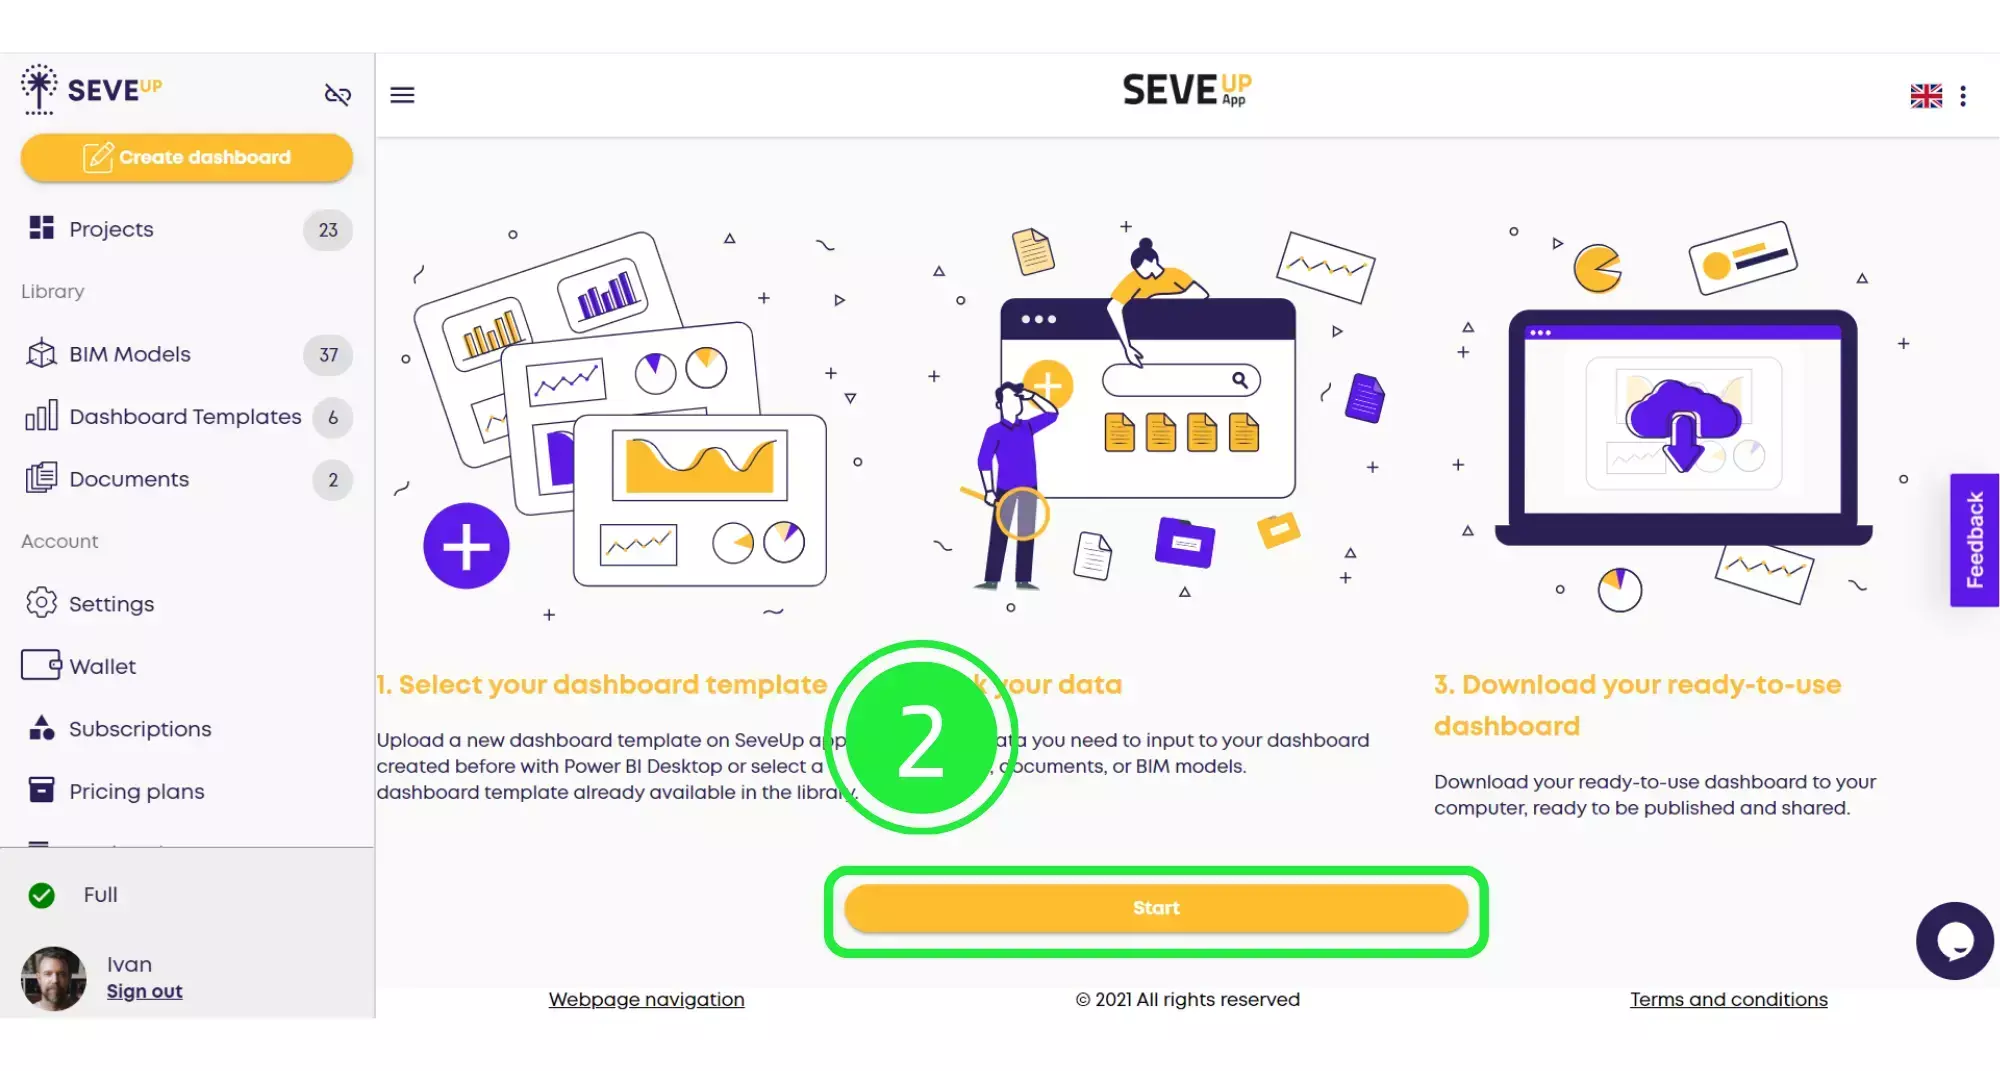
In the centre of the tutorial page you’ll find the “Start” button. Click on that to start creating your new dashboard.
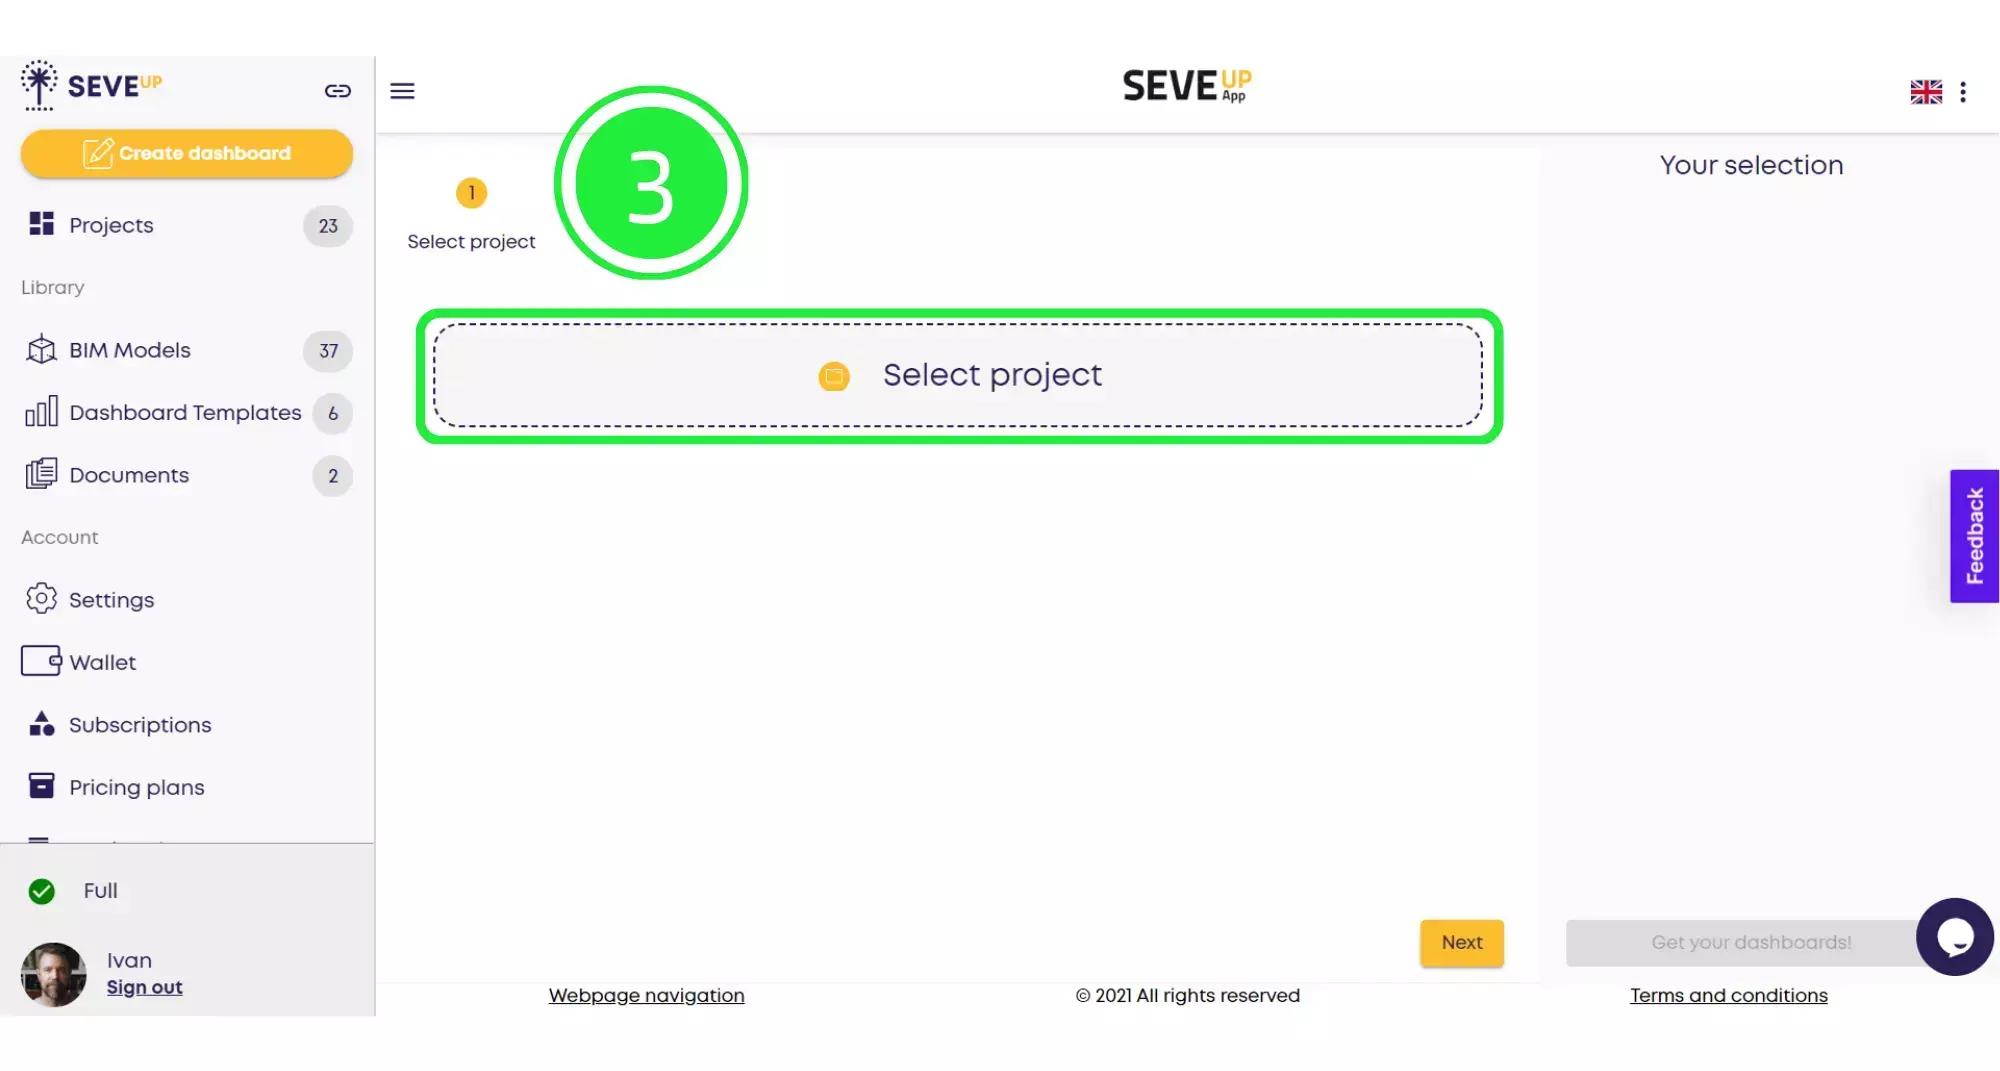
At the top of the page, you’ll see the wizard is now showing your progress. Click on the large “Select Project” button in the centre.
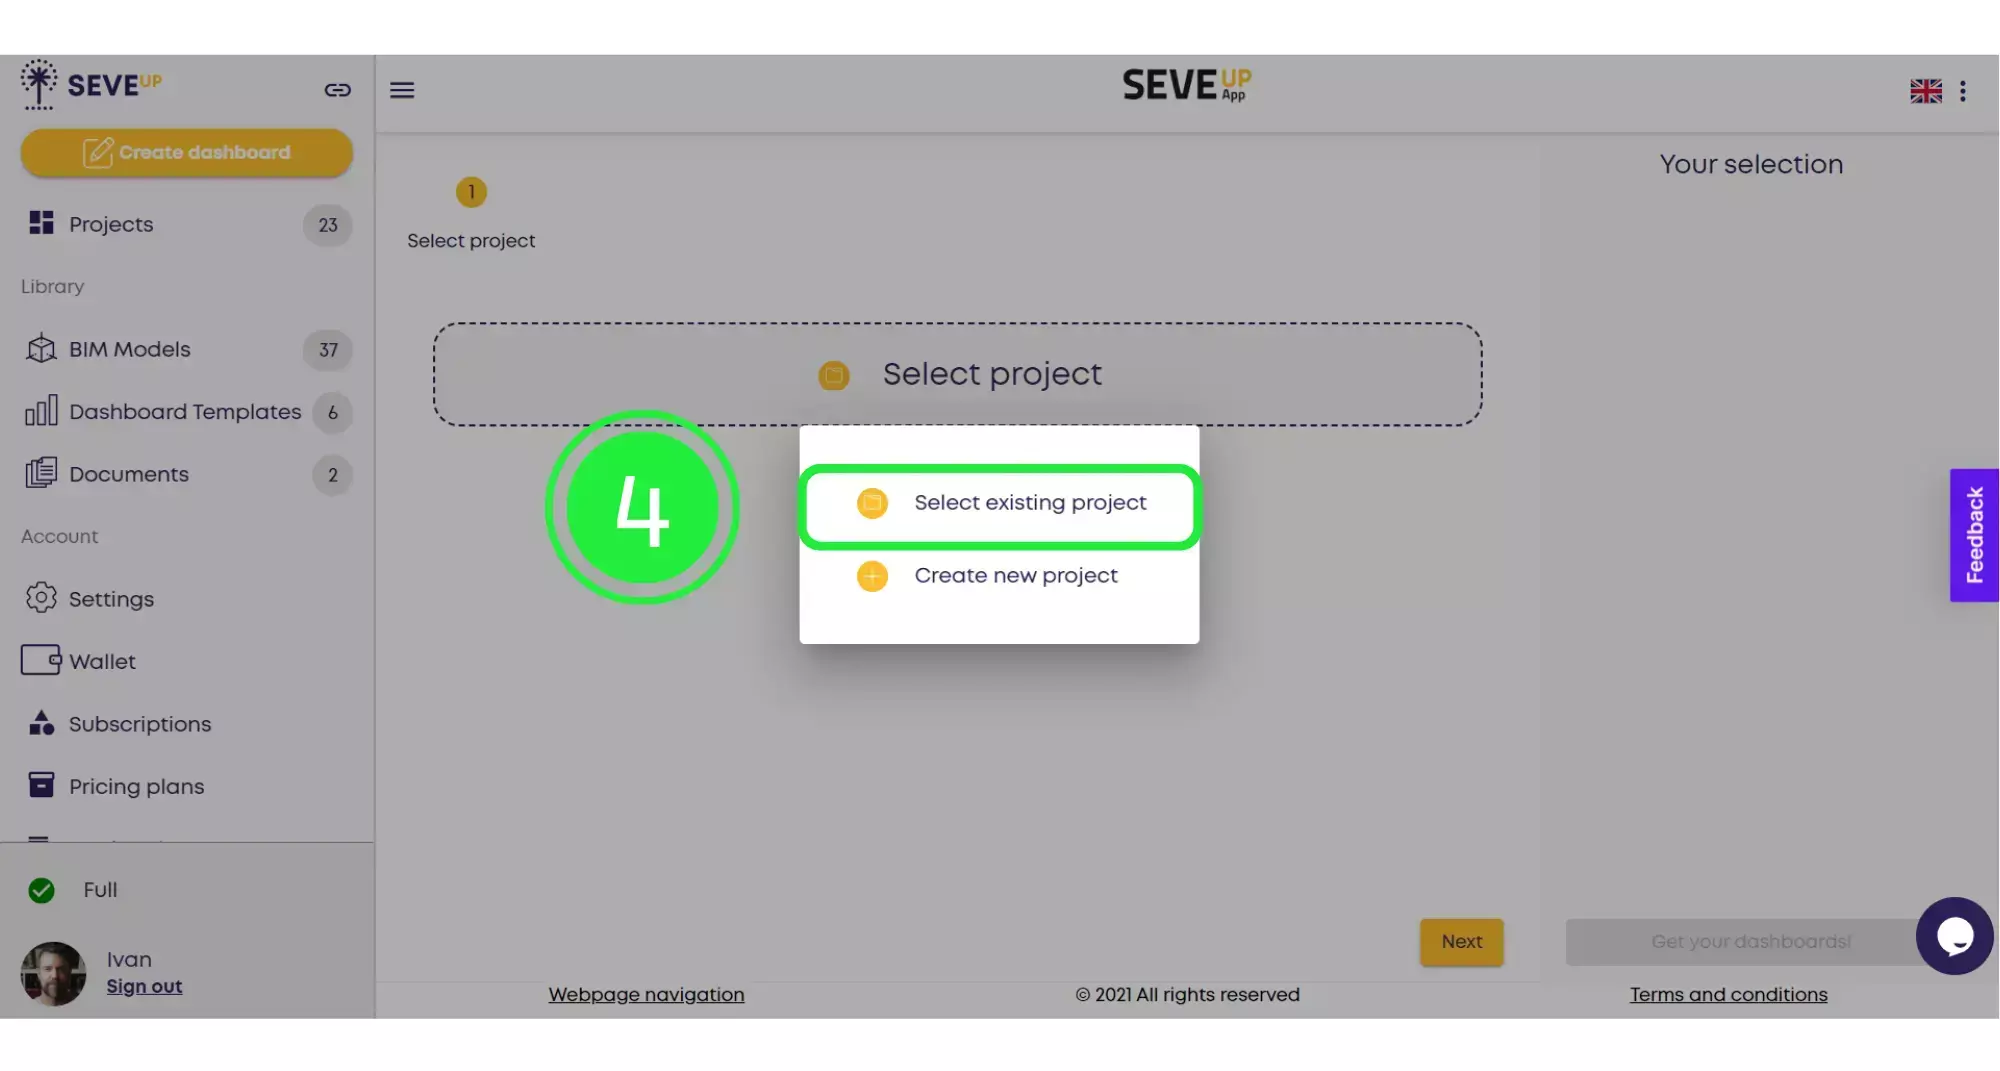
A popup will appear, allowing you to choose whether to select an existing project or create a new project. Click on “Select Existing Project”.
A selection of your projects will appear in a popup box. Choose the project you want (counting your BIM properties in Power BI), to use by clicking on the small box to highlight it with a tick.
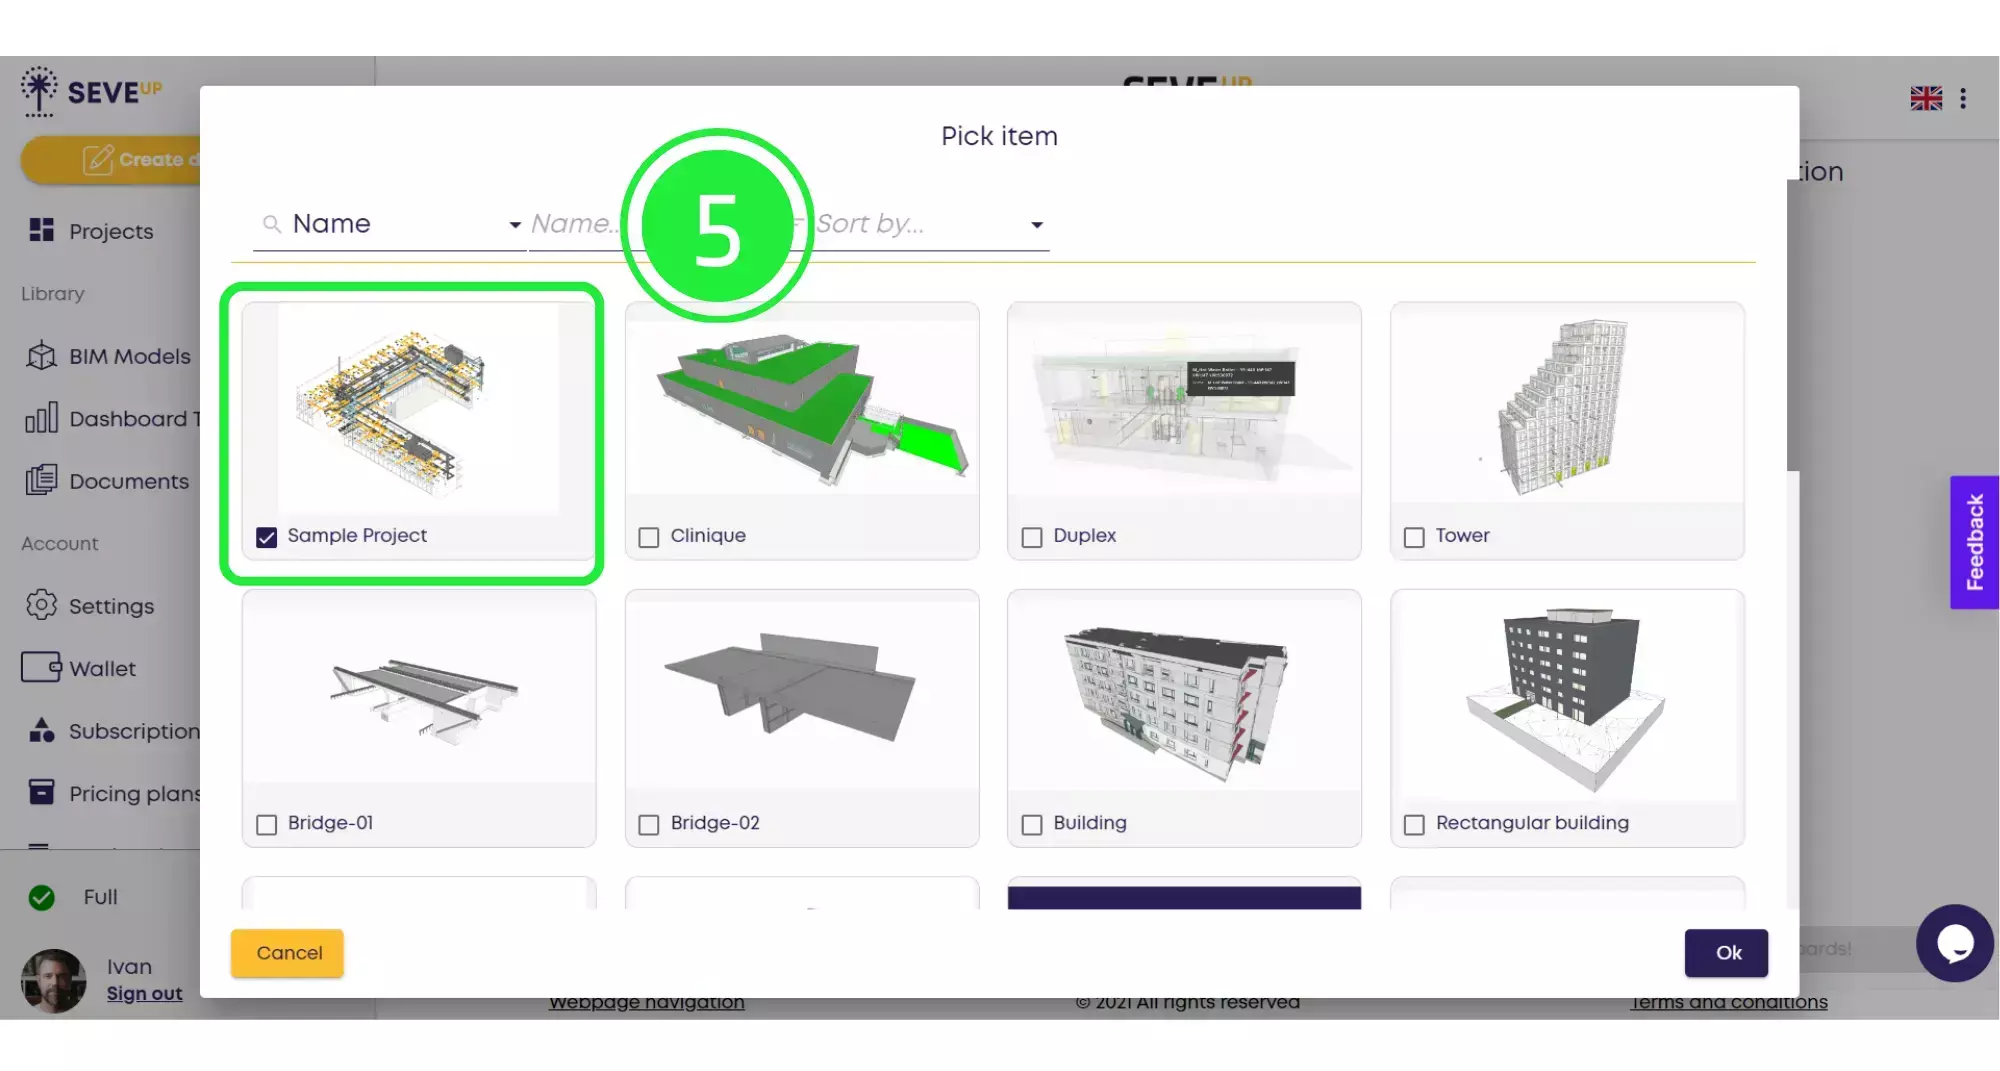
Now click on the “OK” button located in the bottom right corner.
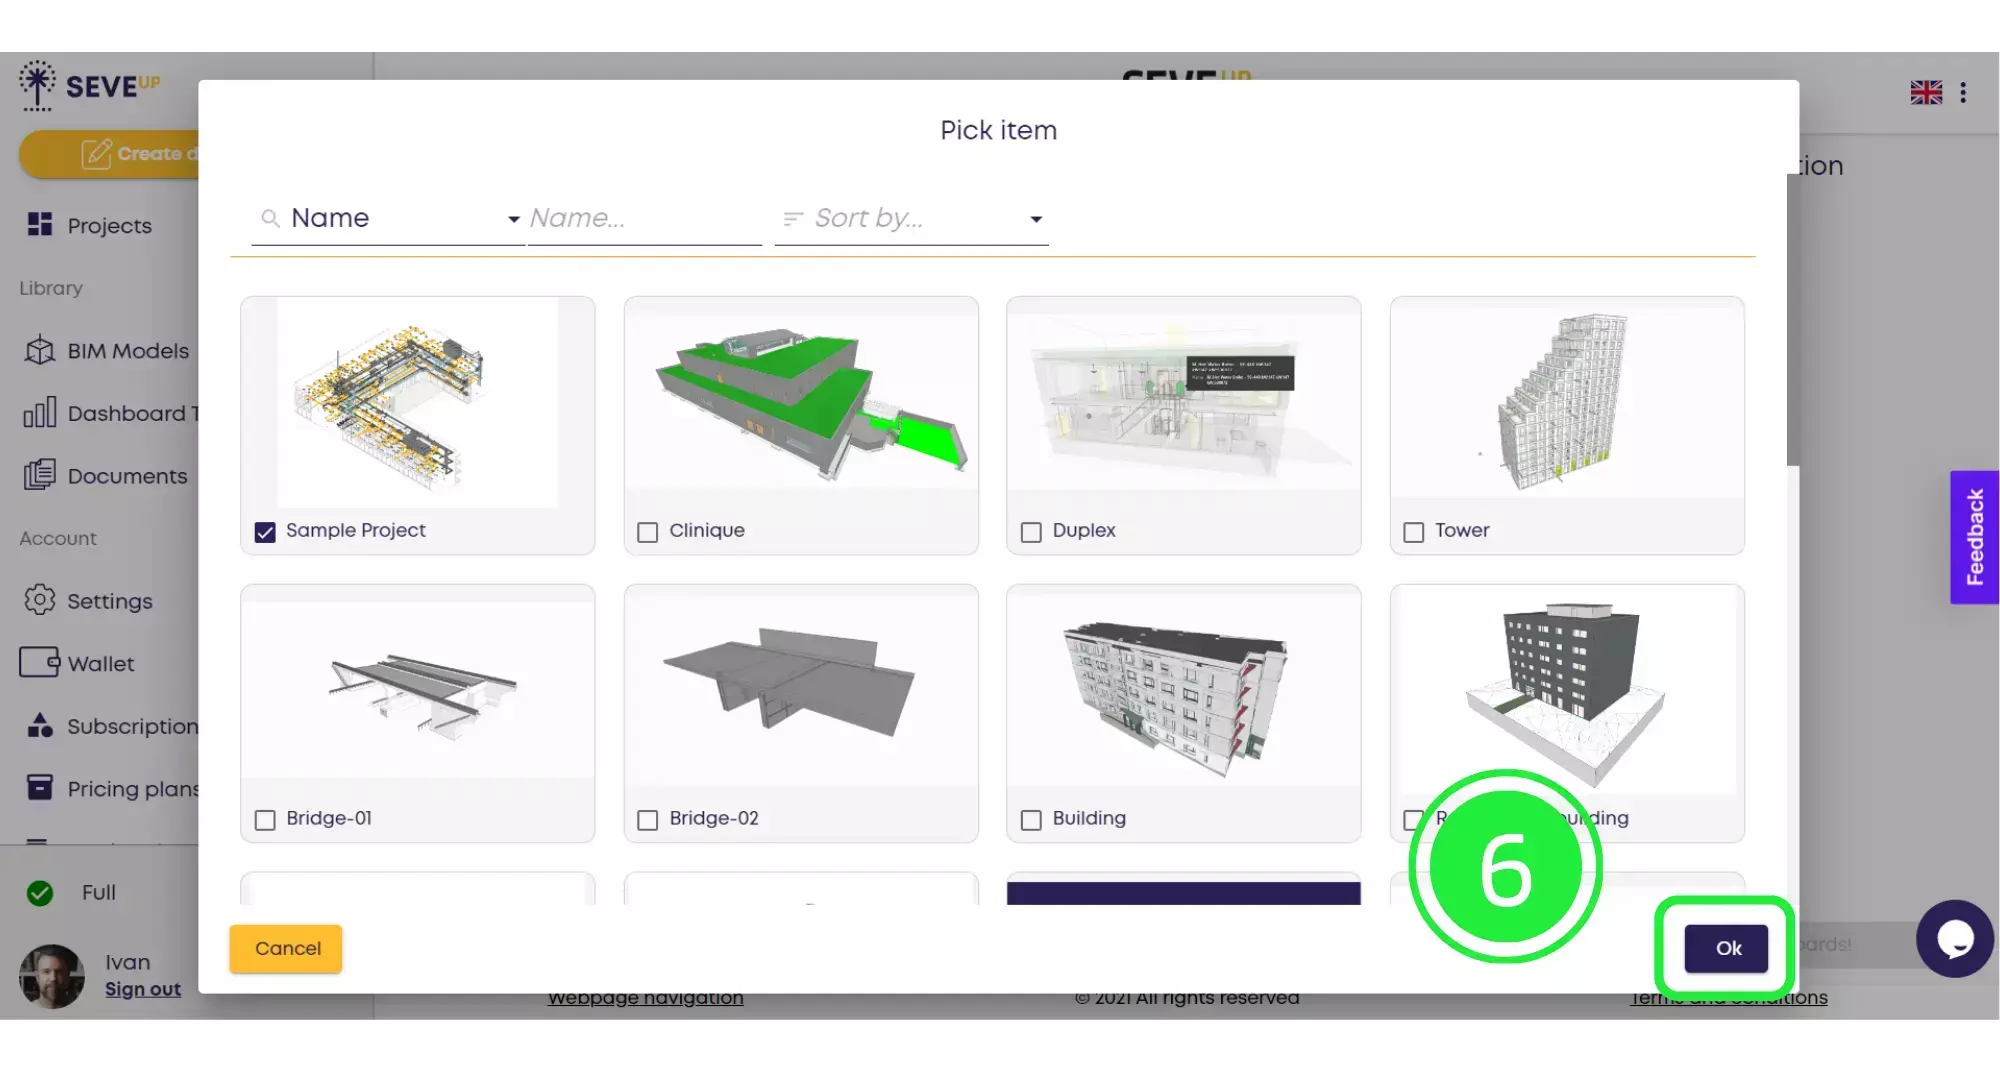
Now you’ll see the project you’ve chosen appear in the wizard. Then click on “Next” at the bottom to move to the following stage.
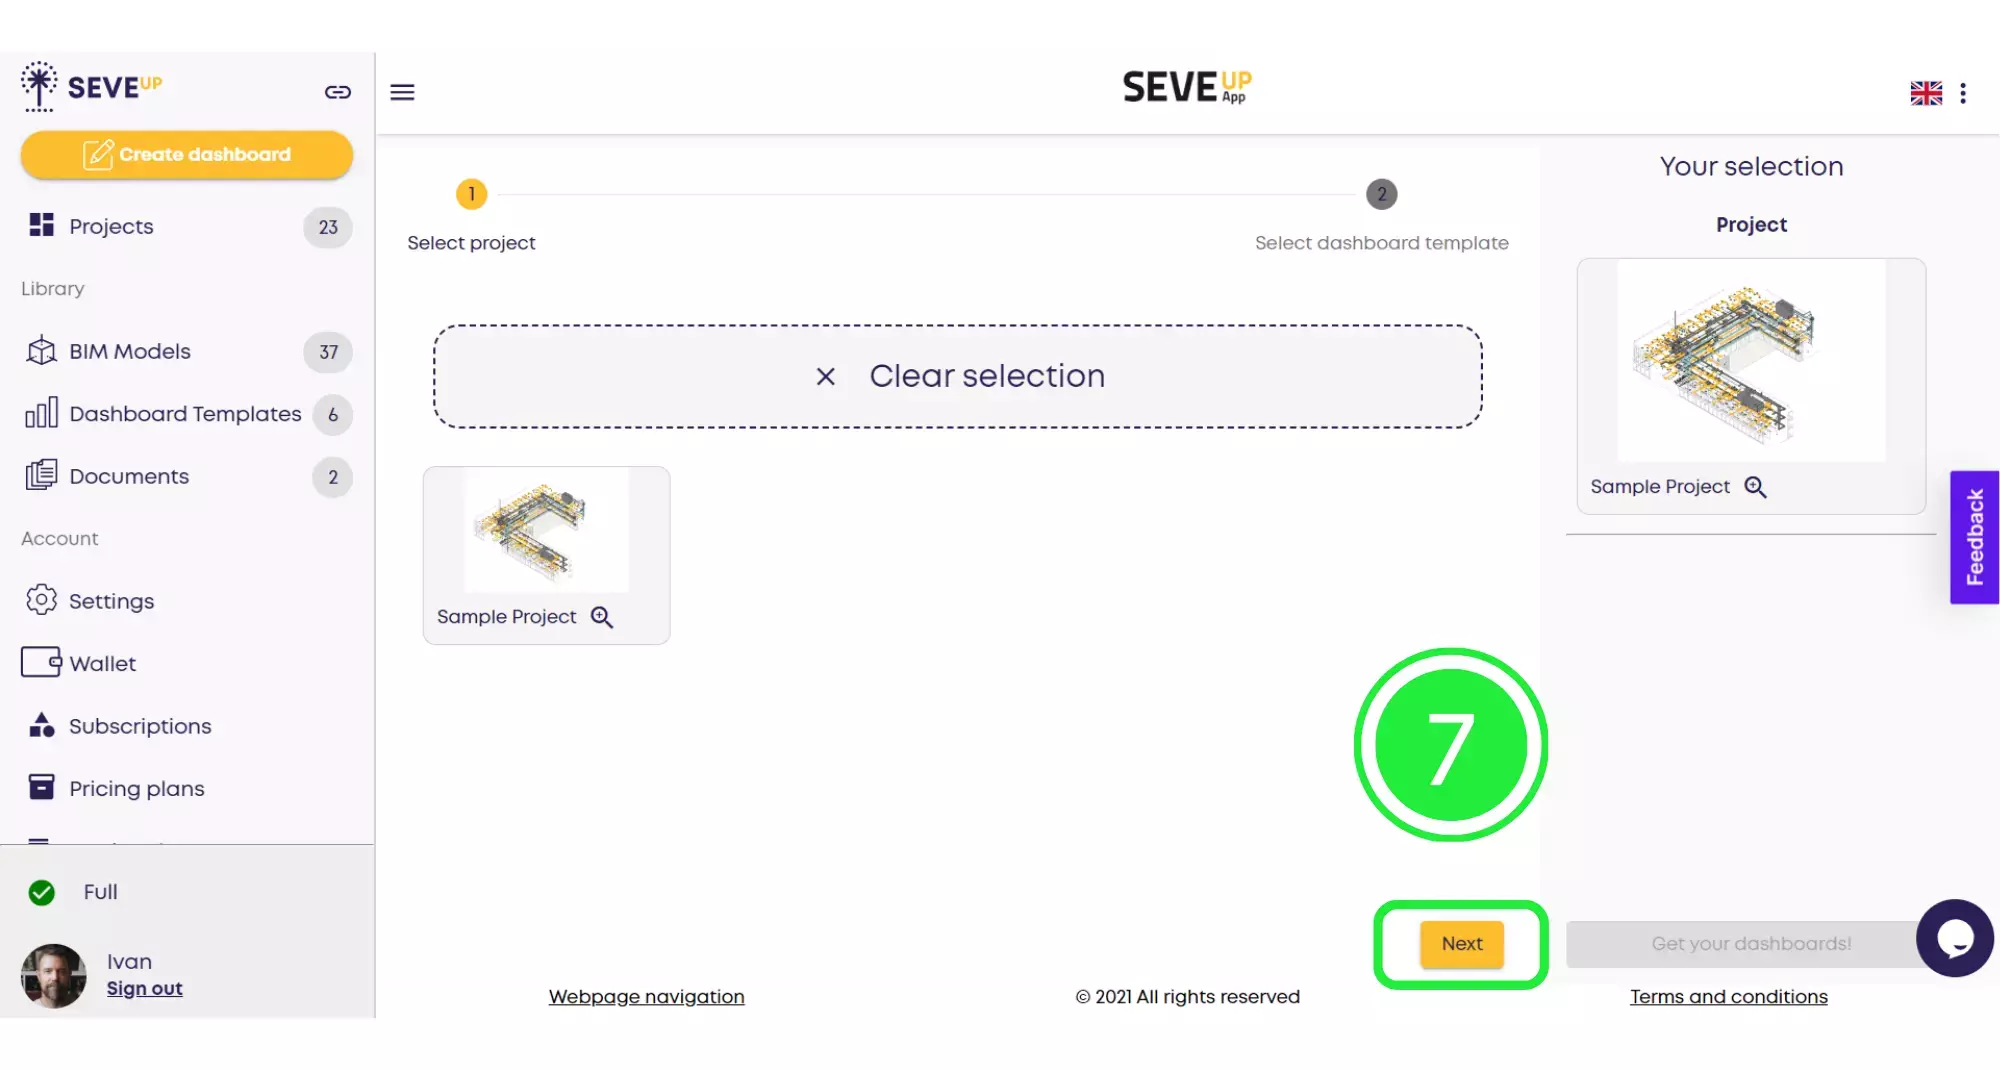
Now you’ll see that the wizard has moved you onto the “Select Dashboard Template” tab. Choose your template from the ones shown by clicking on the small box to highlight it with a tick. You’ll then see it show in the right hand pane next to the “Project” you’ve chosen.
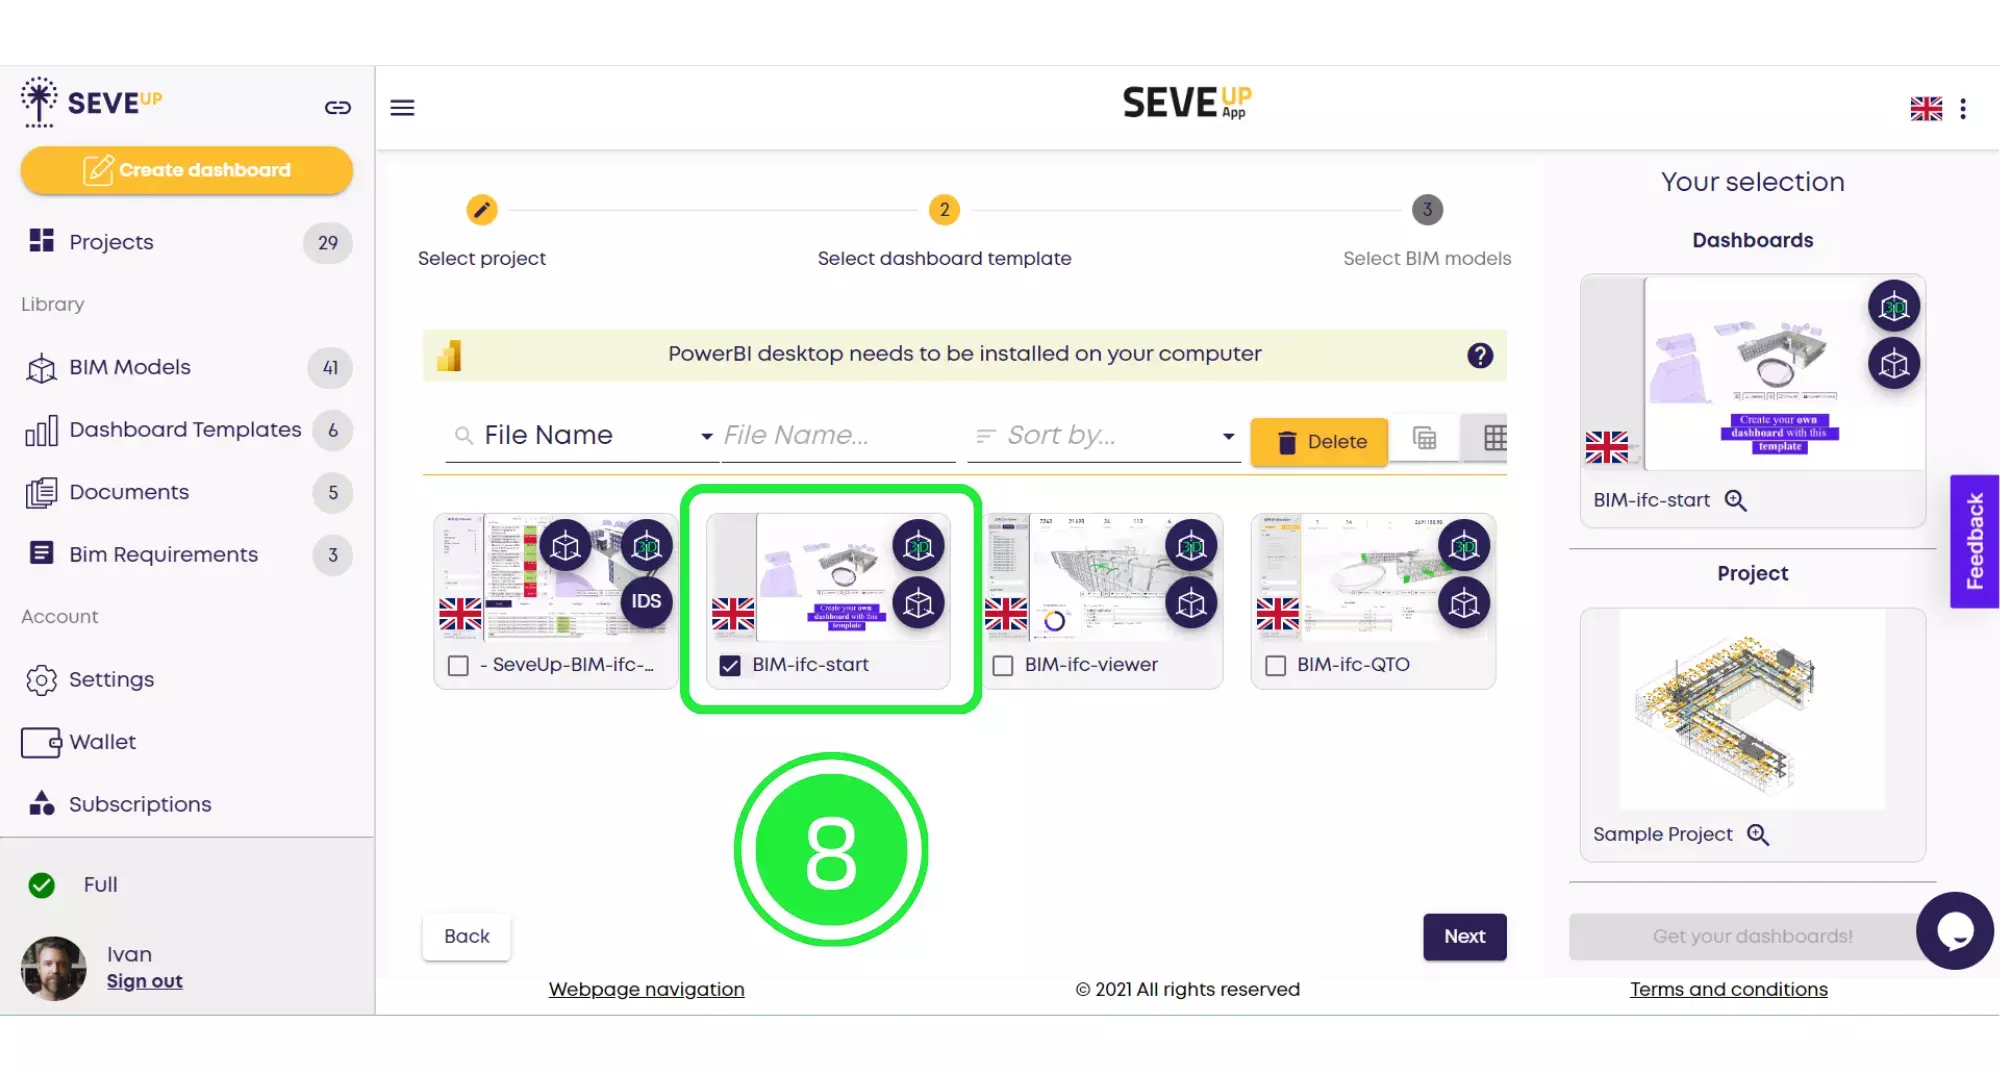
Now click on “Next” on the bottom right of the page to move onto the next part in the wizard.
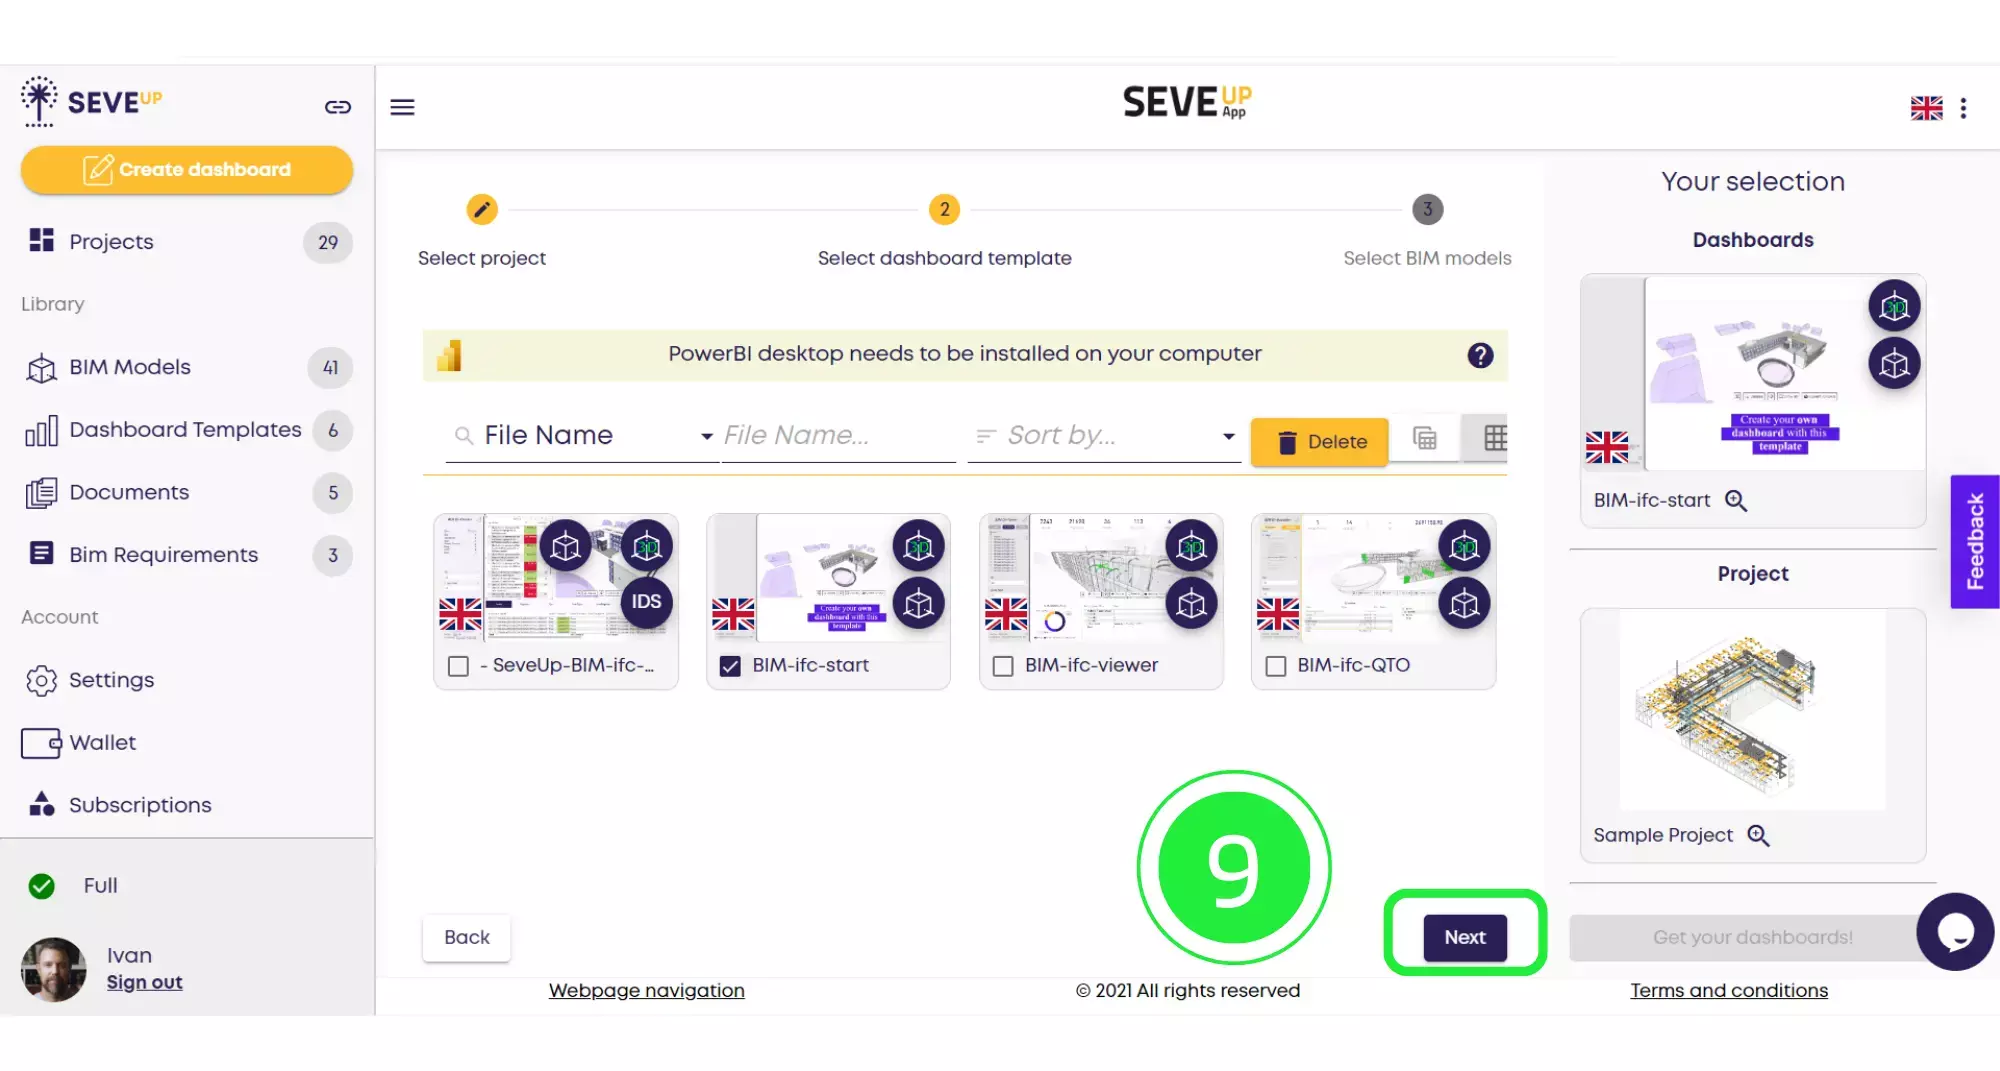
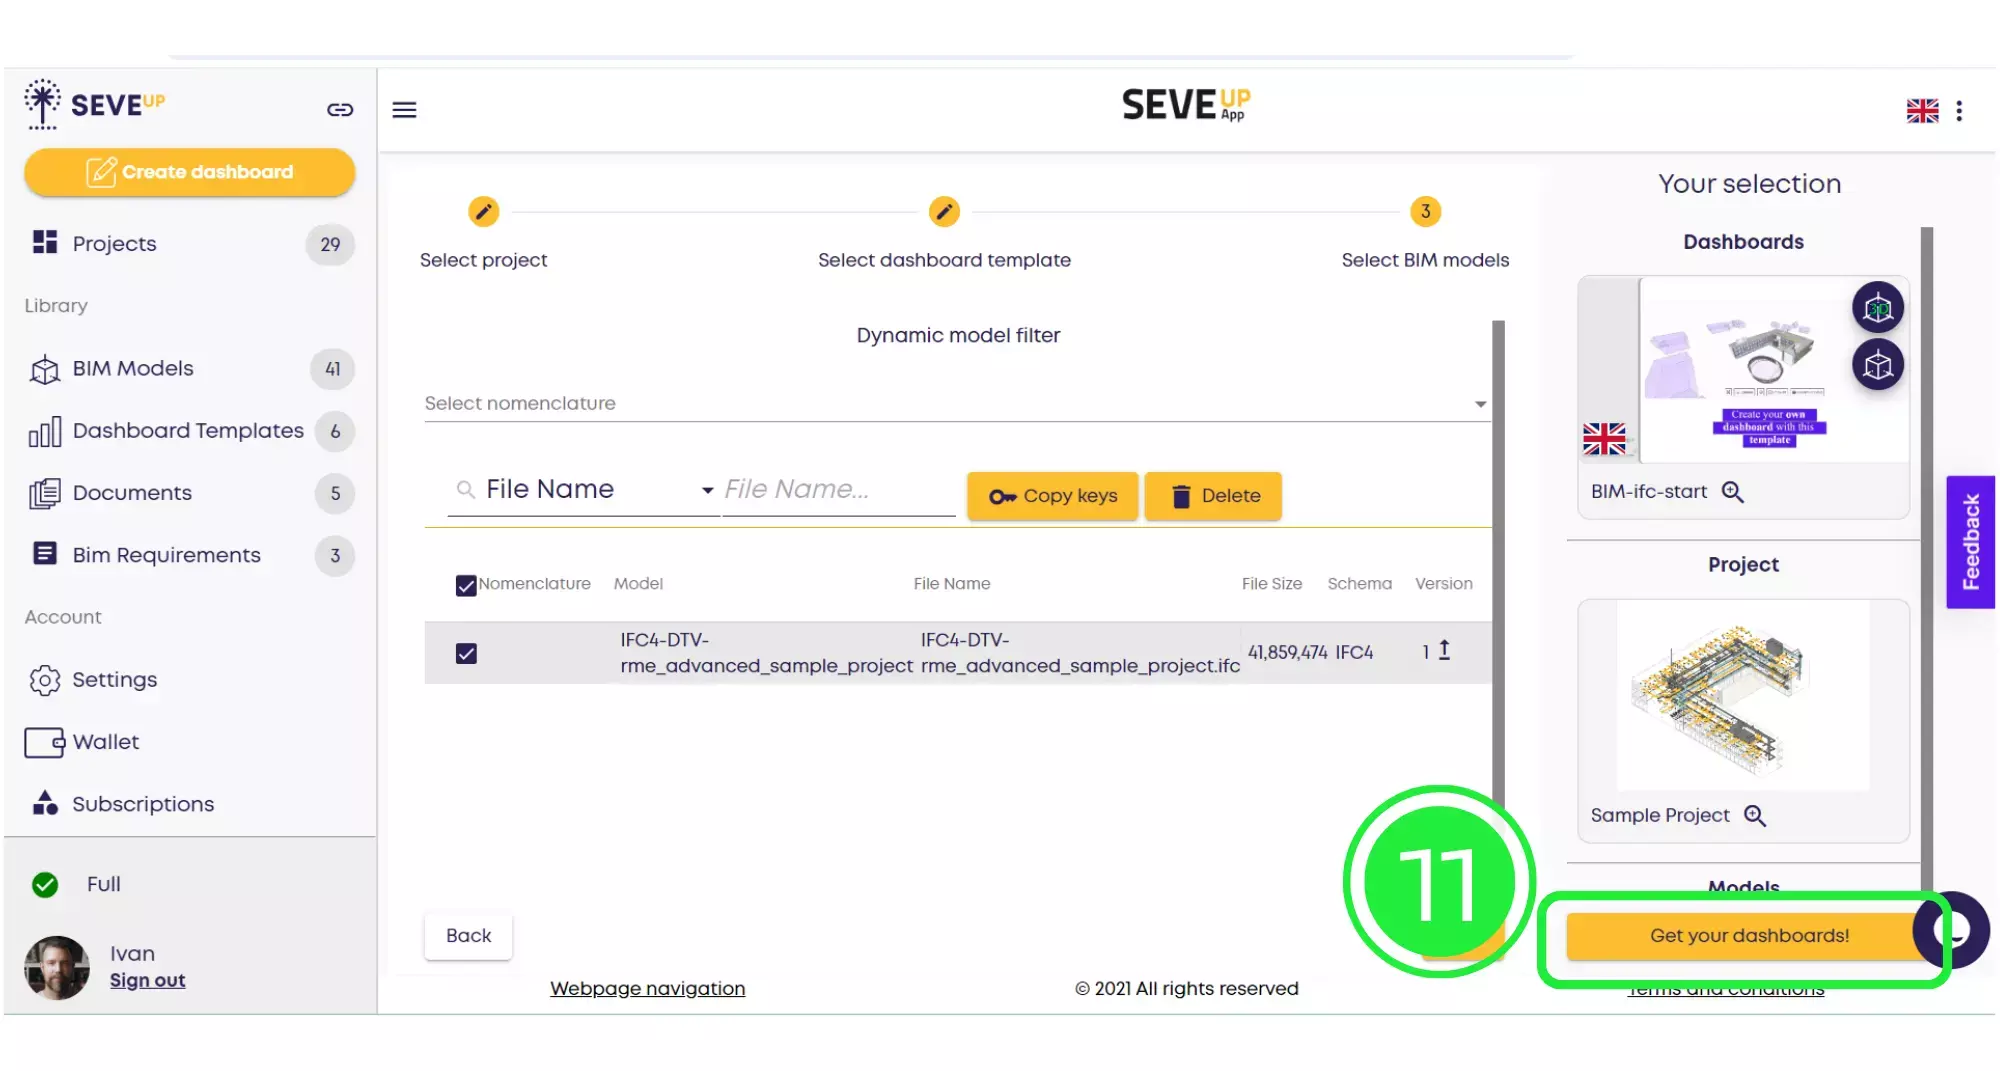
Now the wizard has moved to the “Select BIM Models” tab. Click on the BIM model you would like to use by highlighting the small box with a tick.
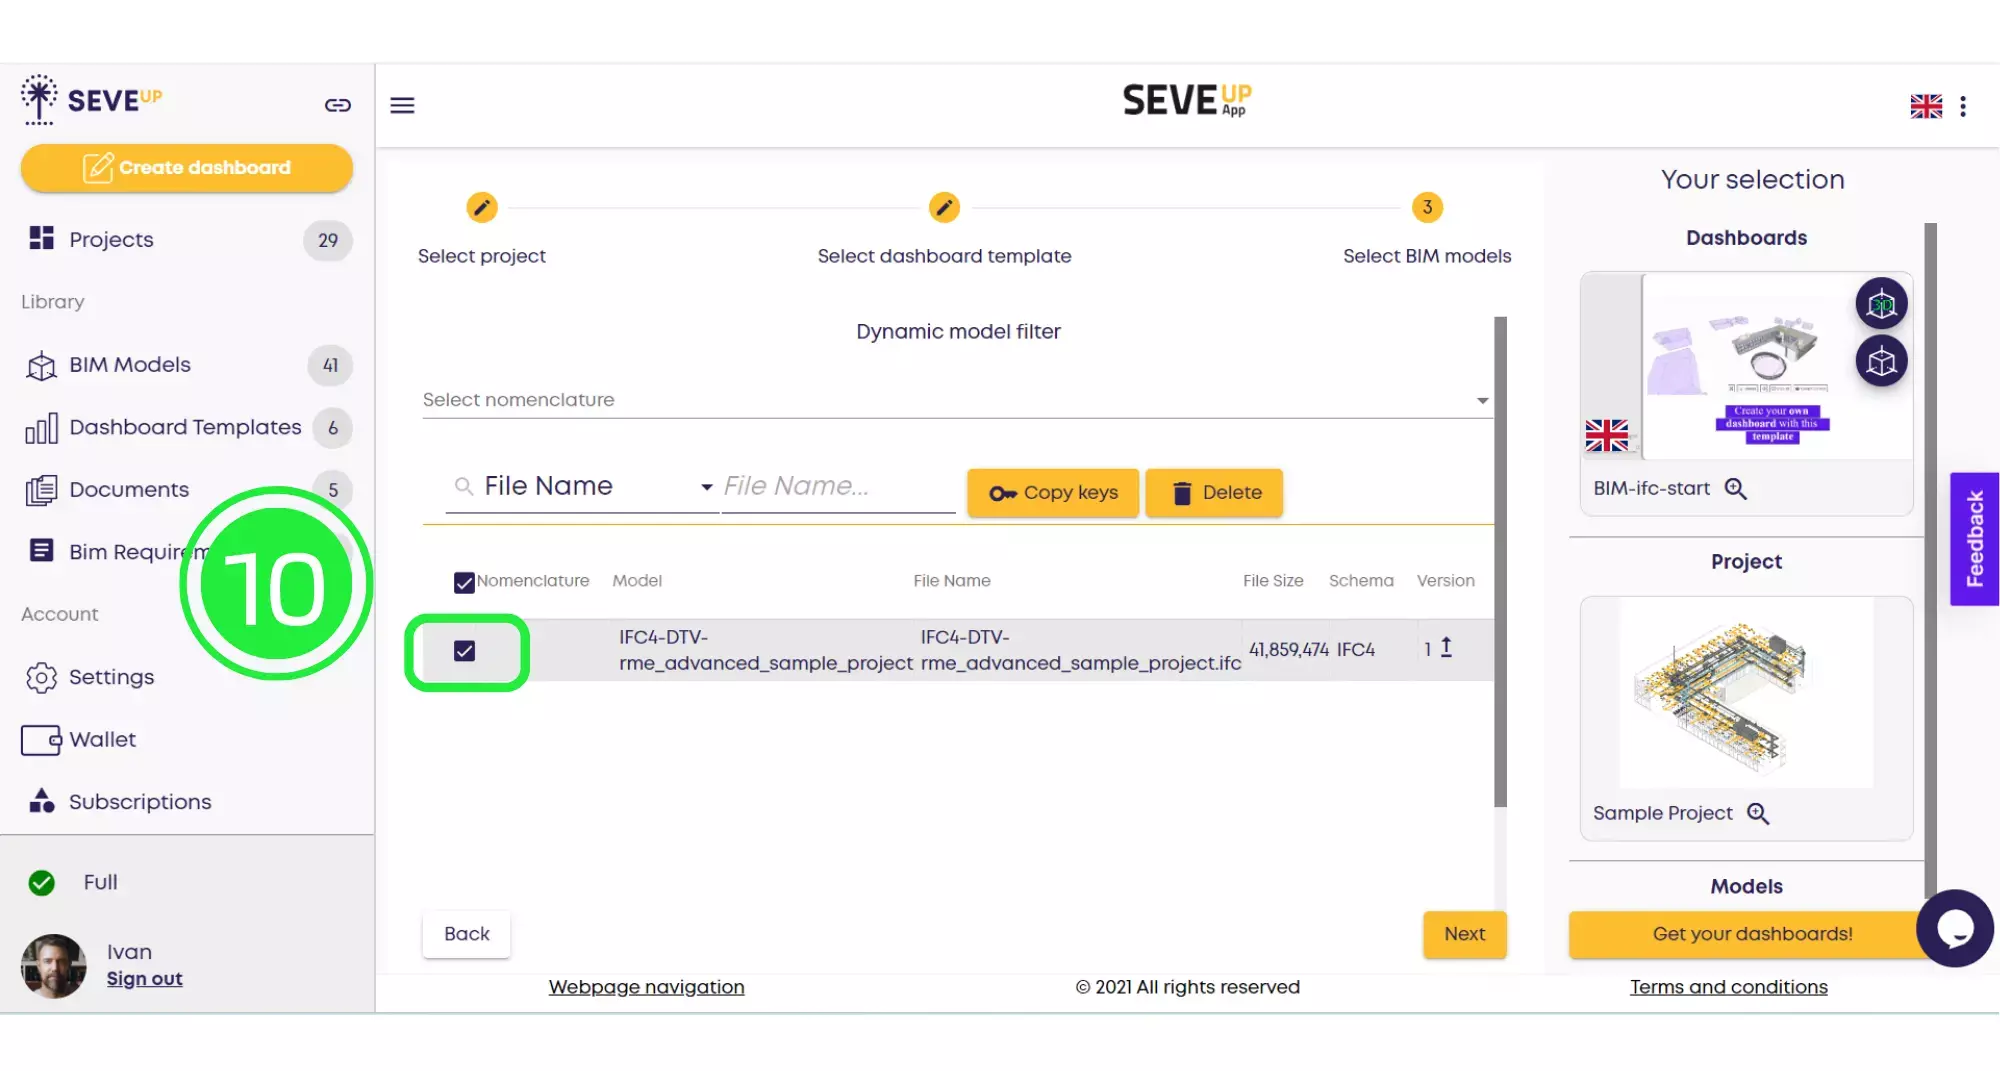
Now click on “Get Your Dashboards!” and your dashboard will automatically download onto your computer.
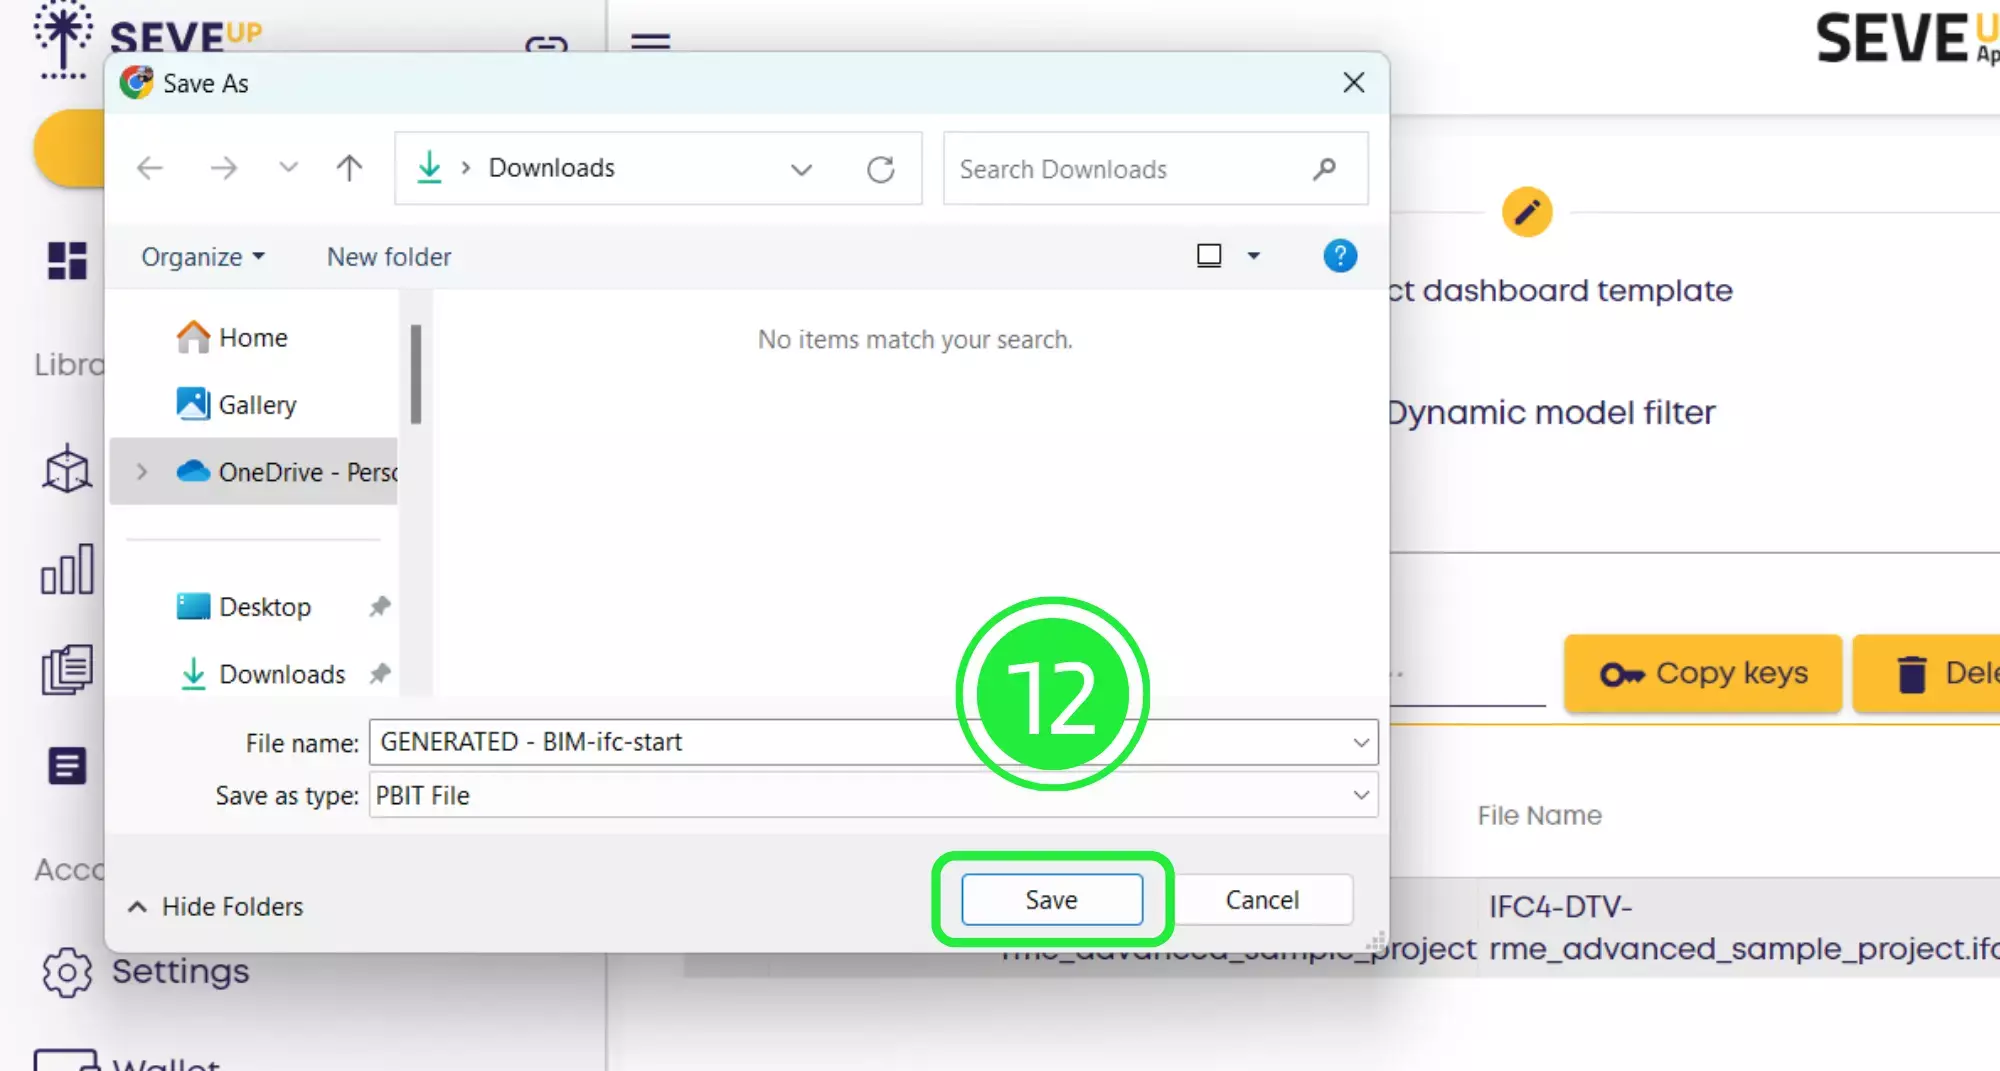
Click on the “Save” button to save your project to your computer.
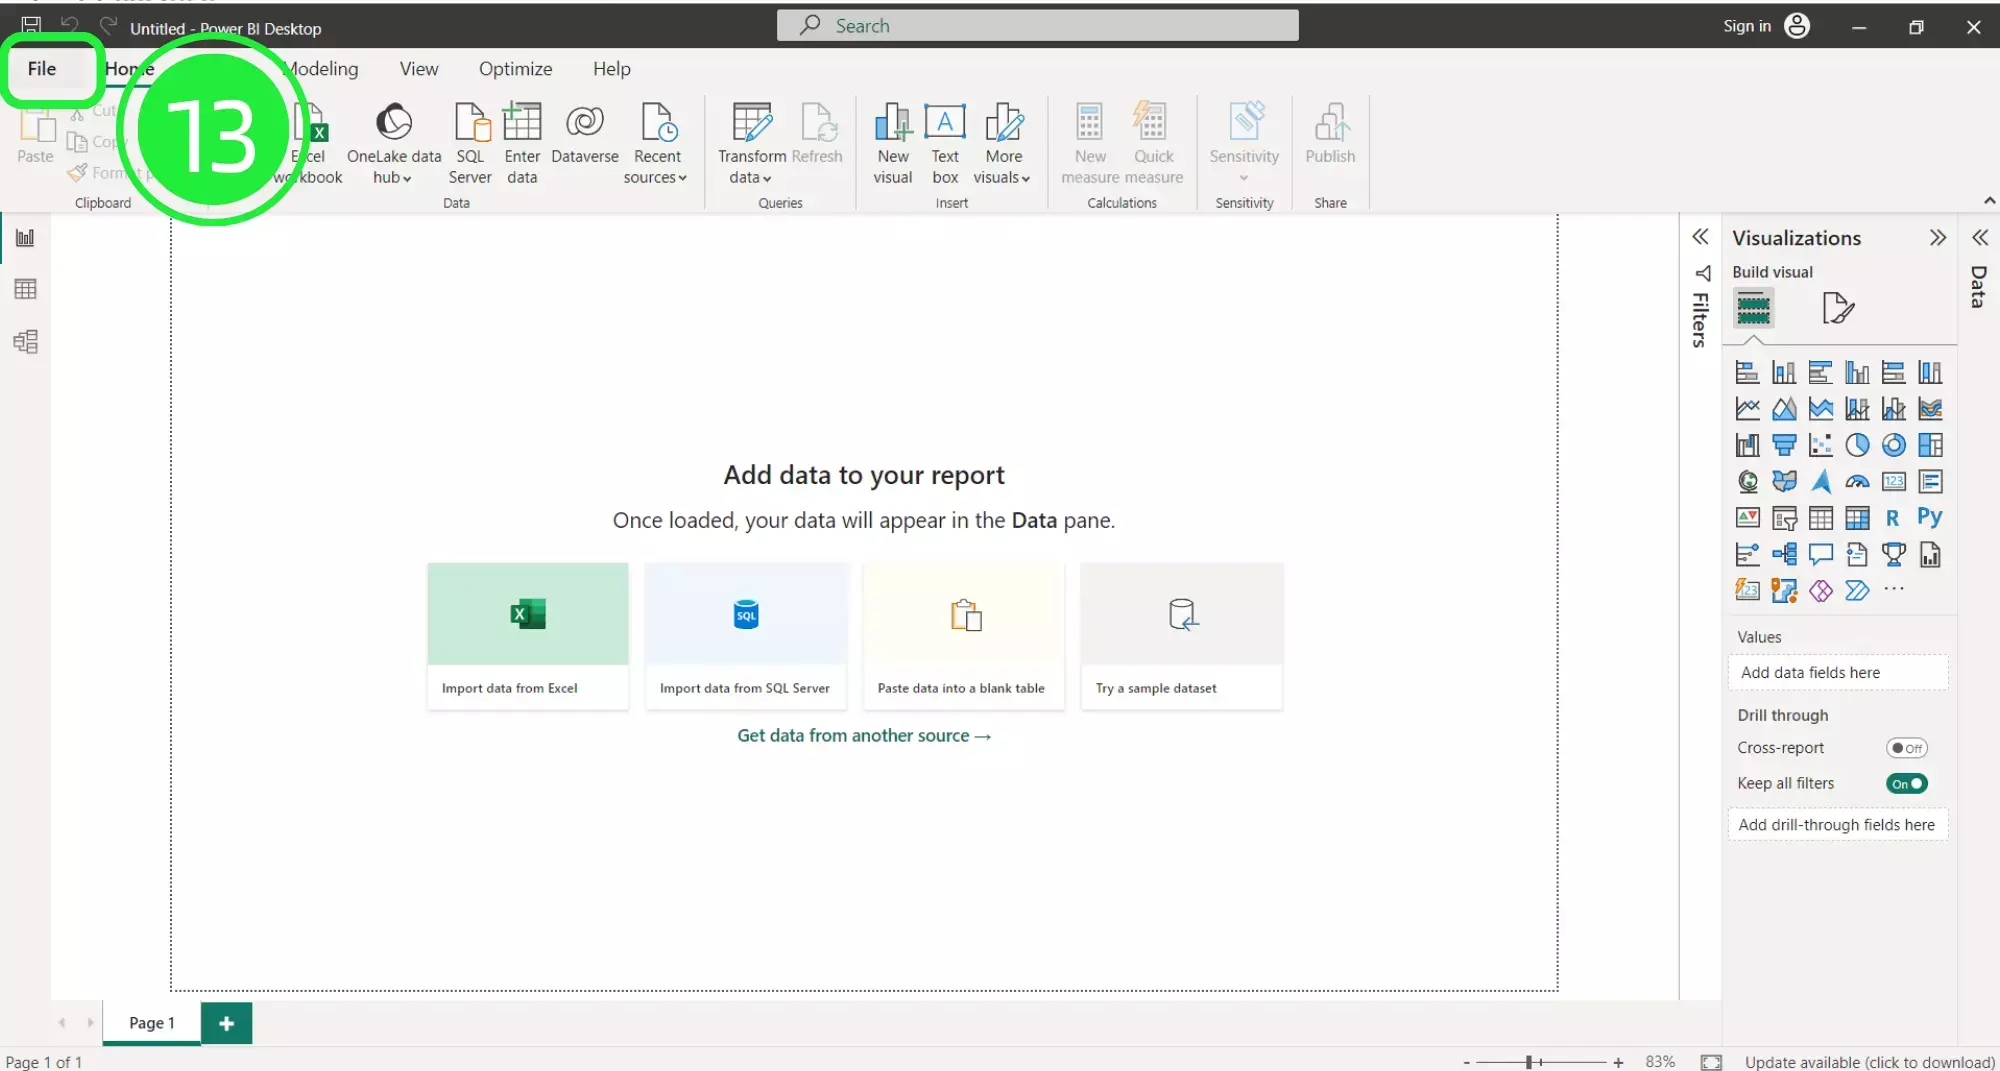
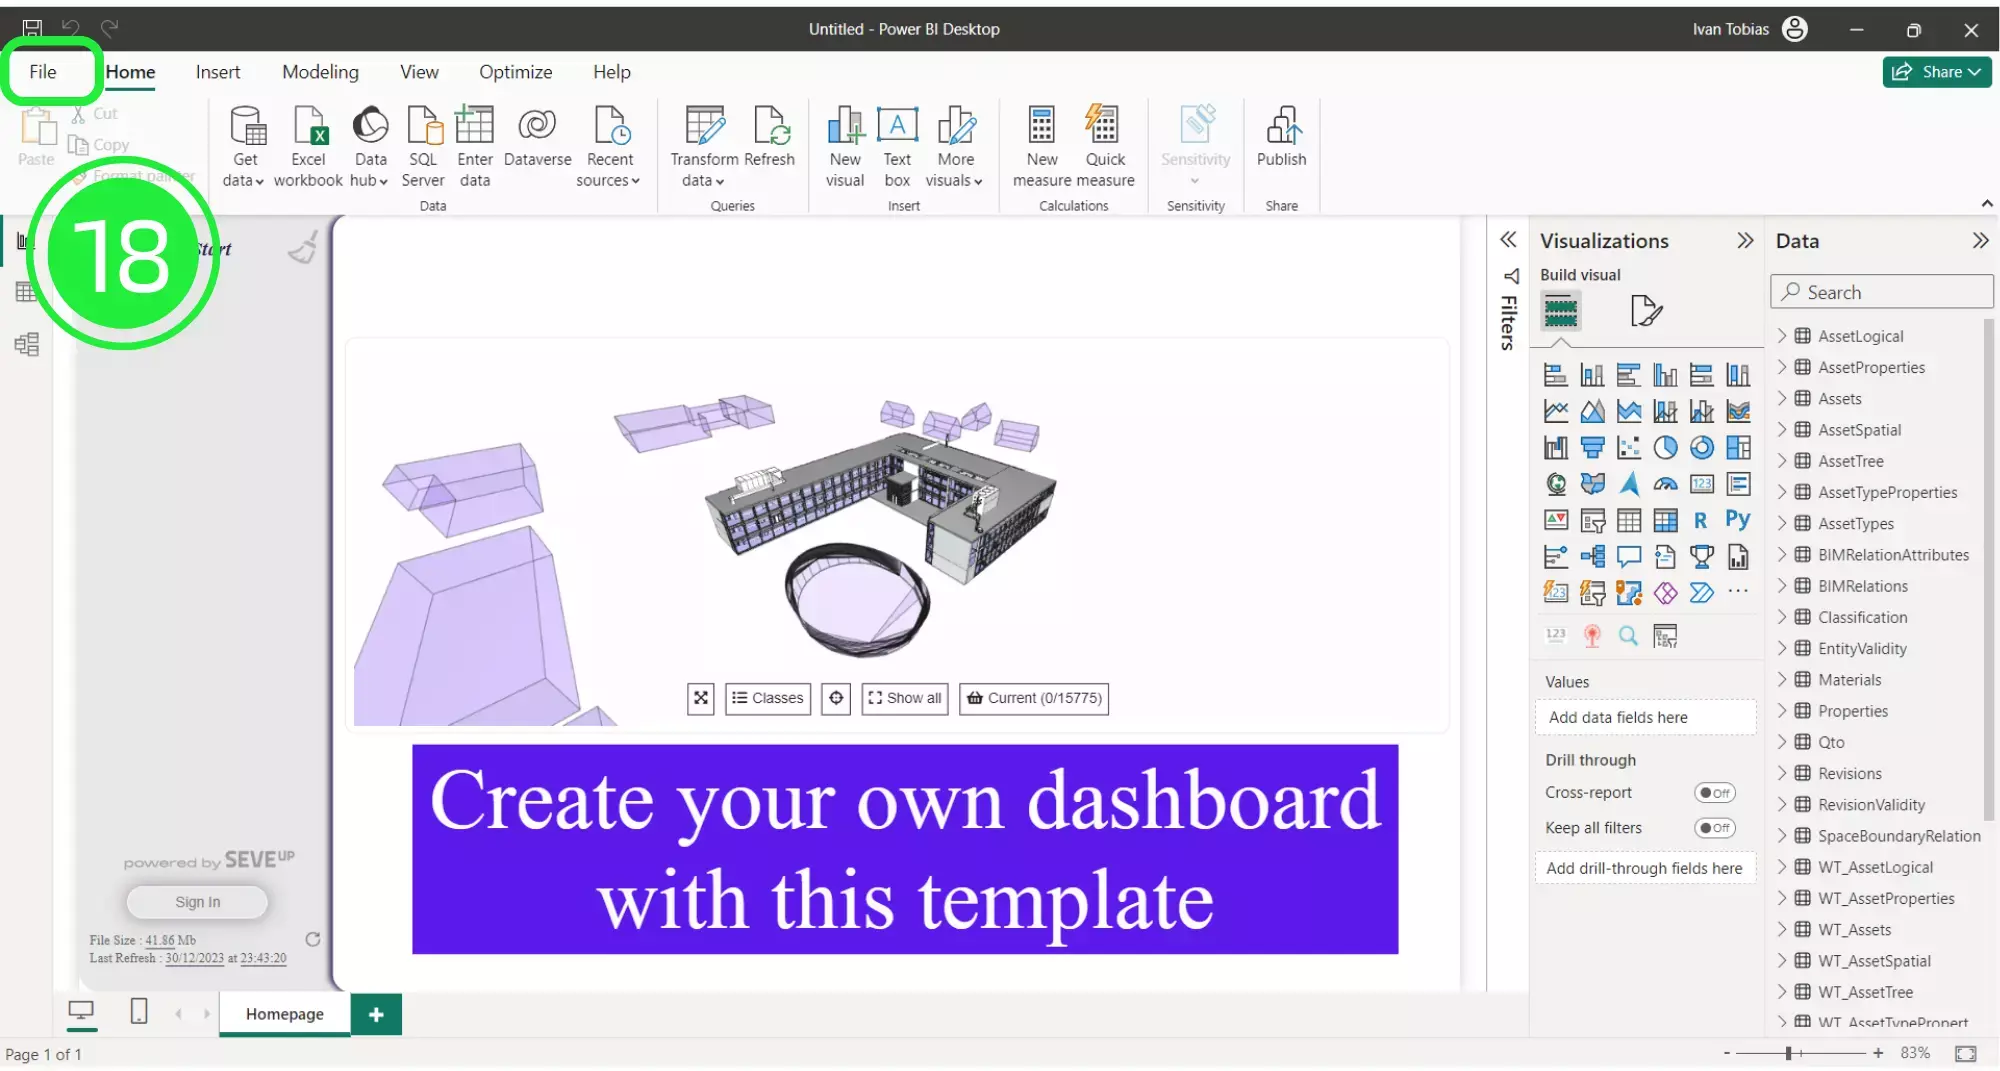
Open up Microsoft Power BI and click on “File” on the top left of the page.
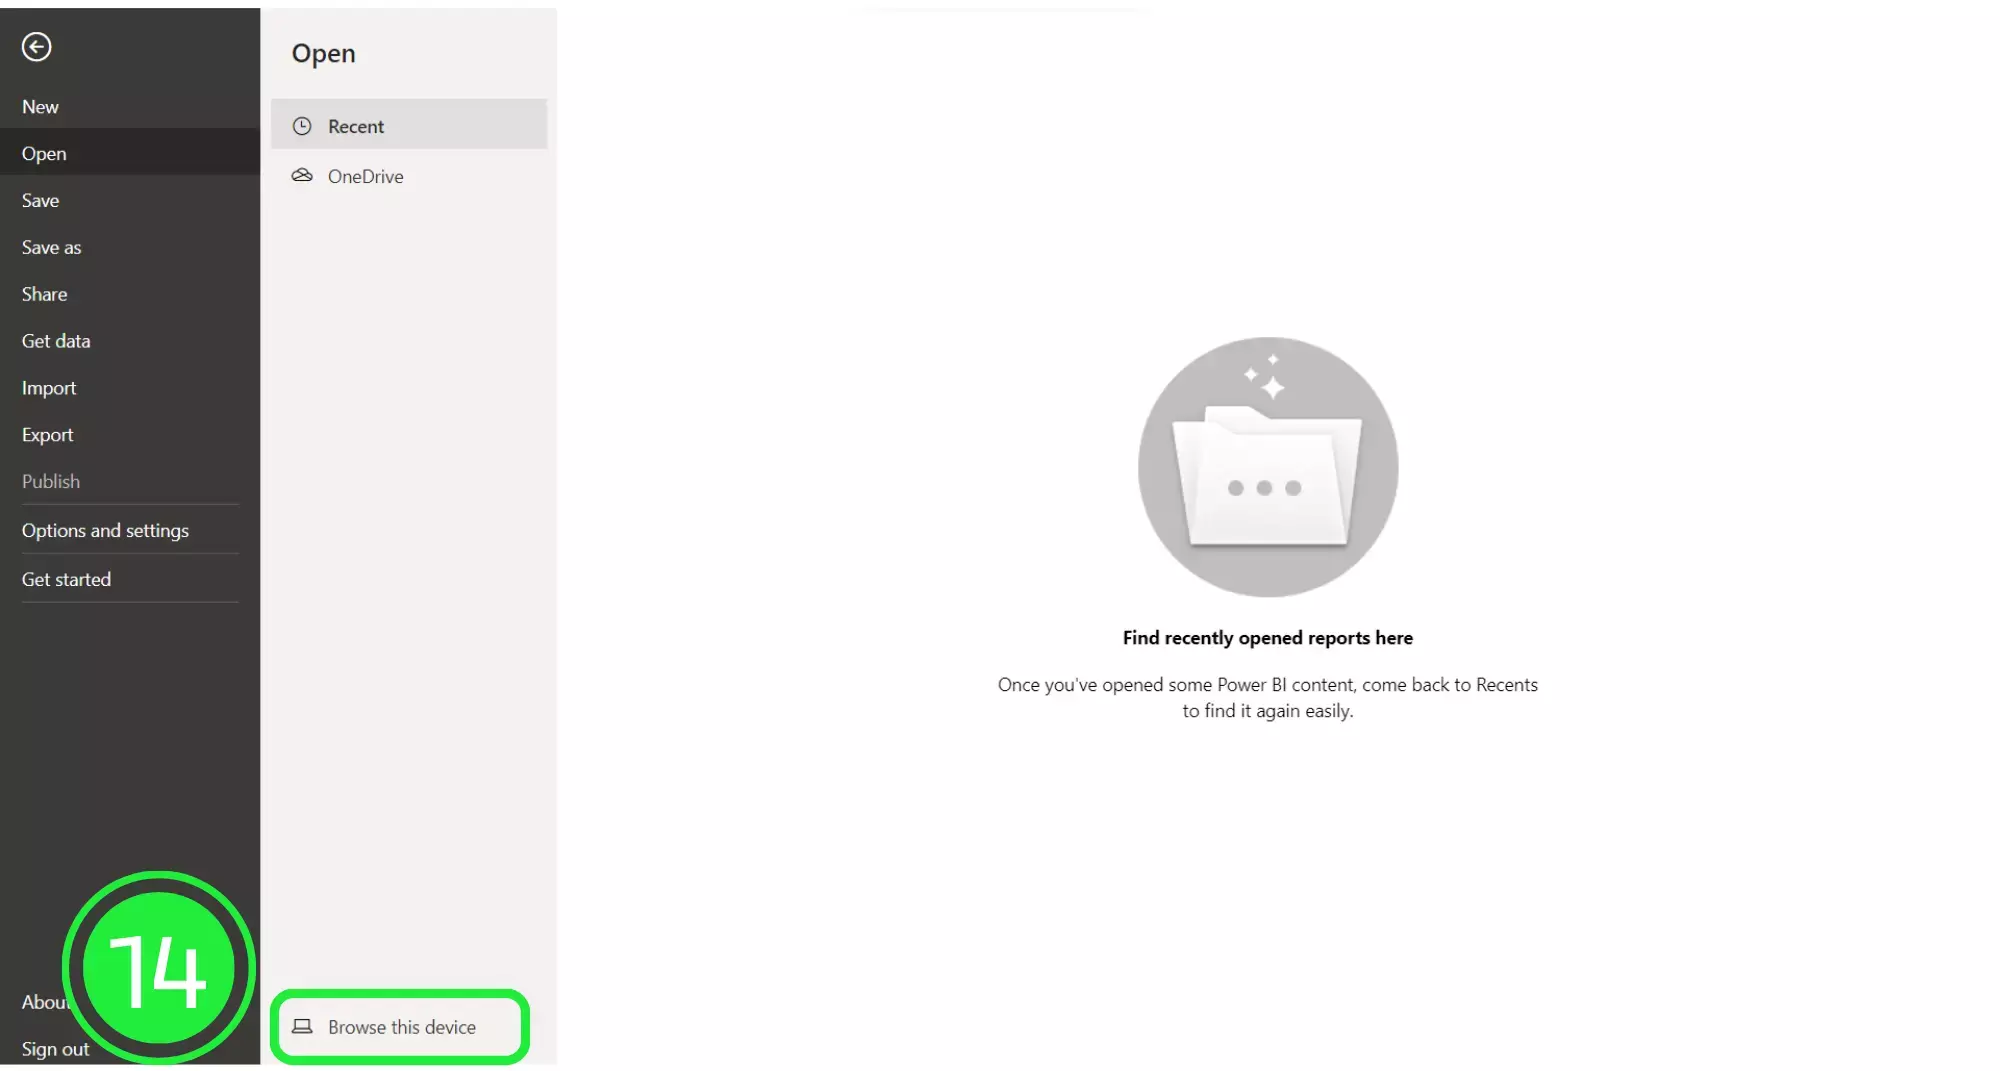
A menu will open up. Click on the “Browse this device” button at the bottom of the screen to search for your newly downloaded dashboard.
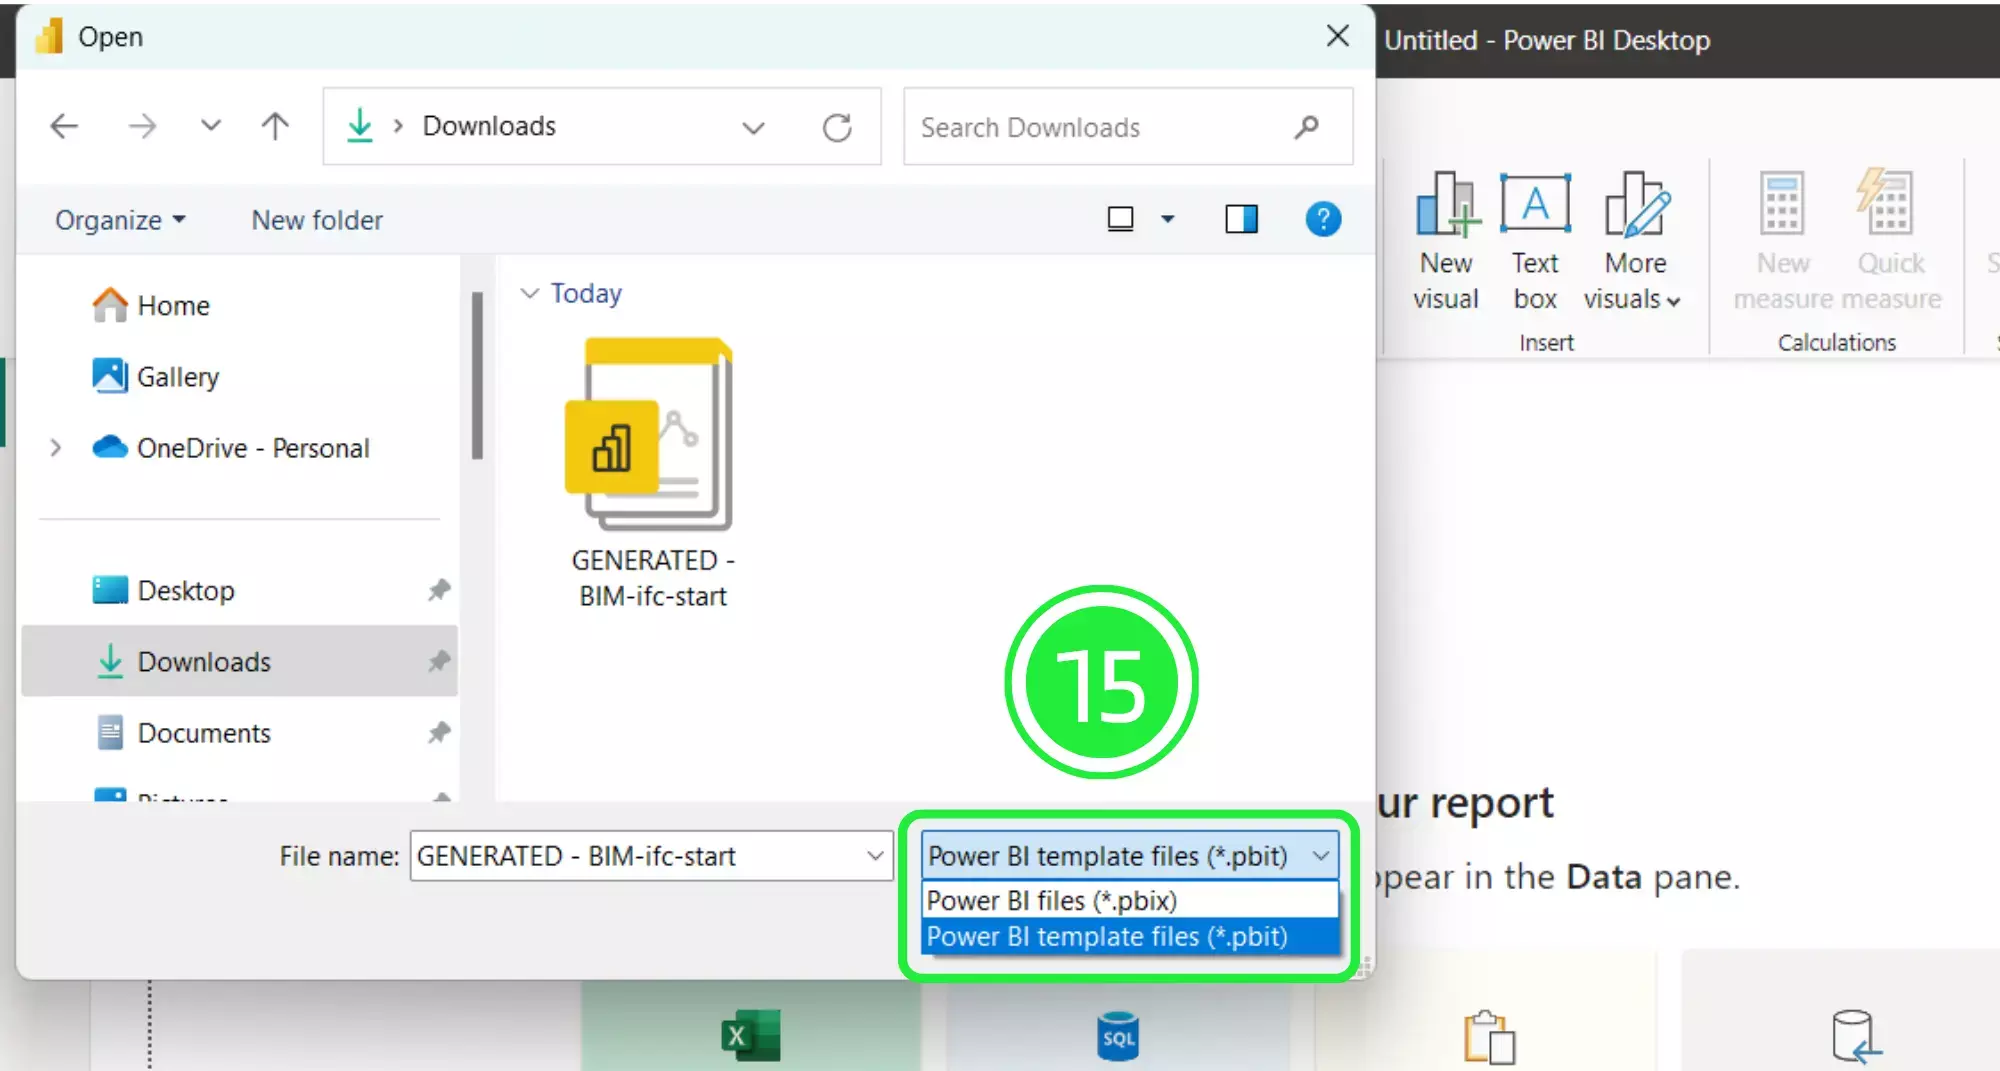
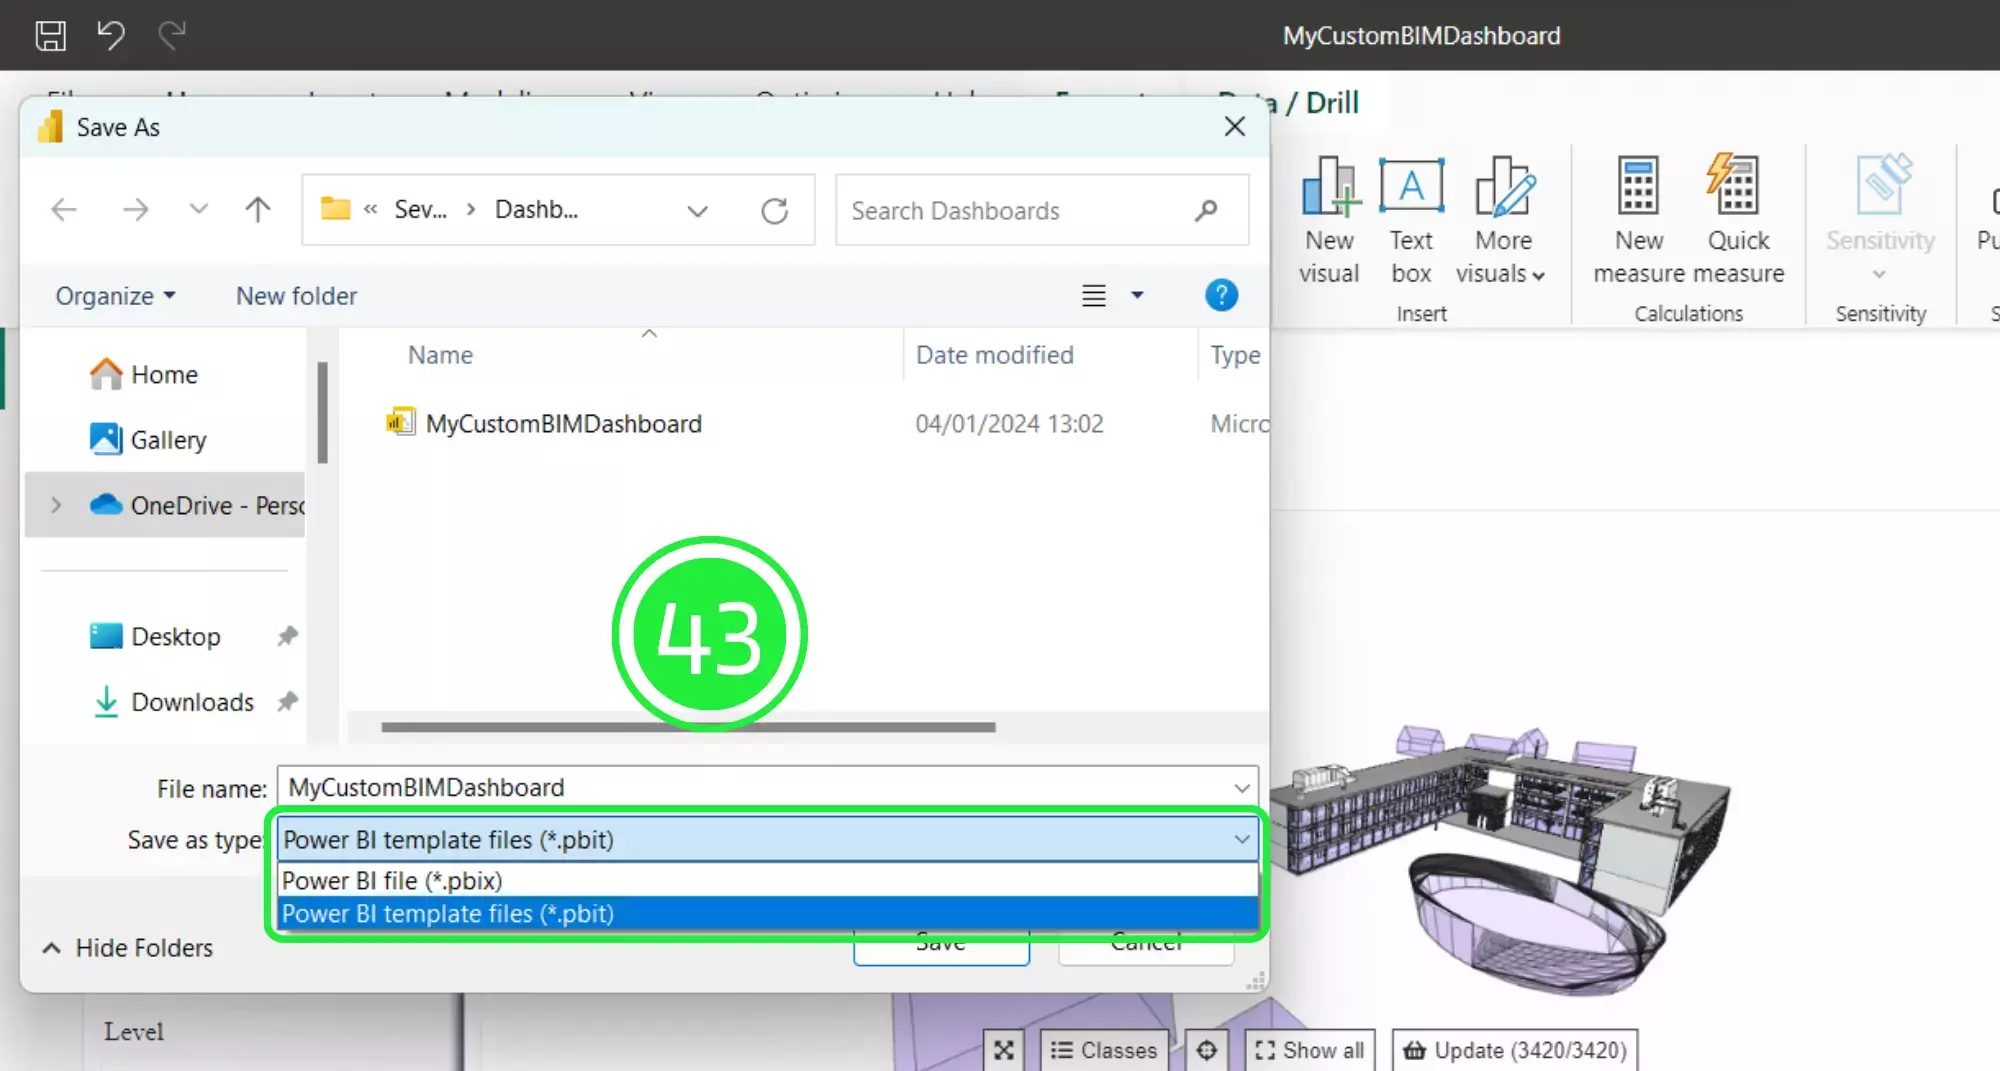
On the “Open” window, go to the bottom right and choose the correct file extension. Choose “Power BI Template Files (*pbit). Any files of this type will now show in the window.
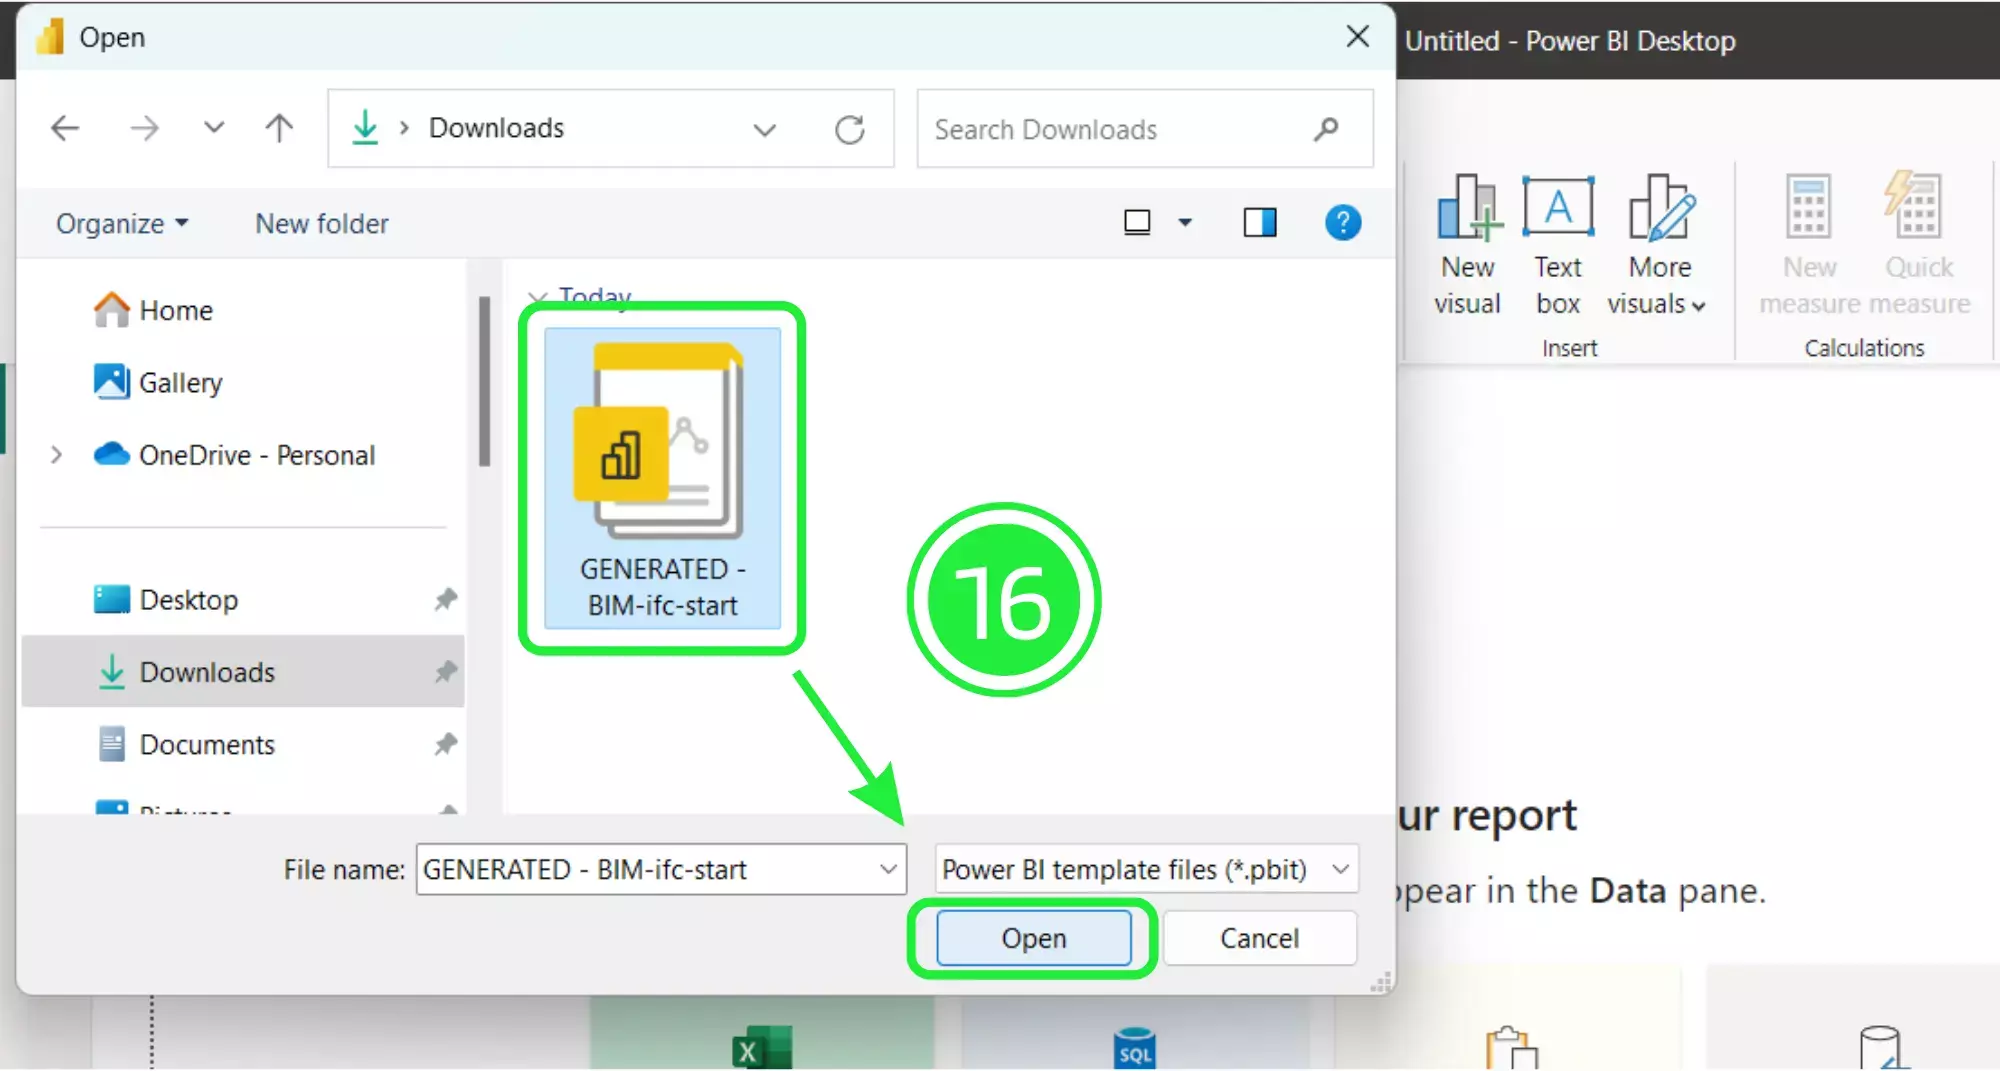
Select your newly downloaded template file and then click on “Open”.
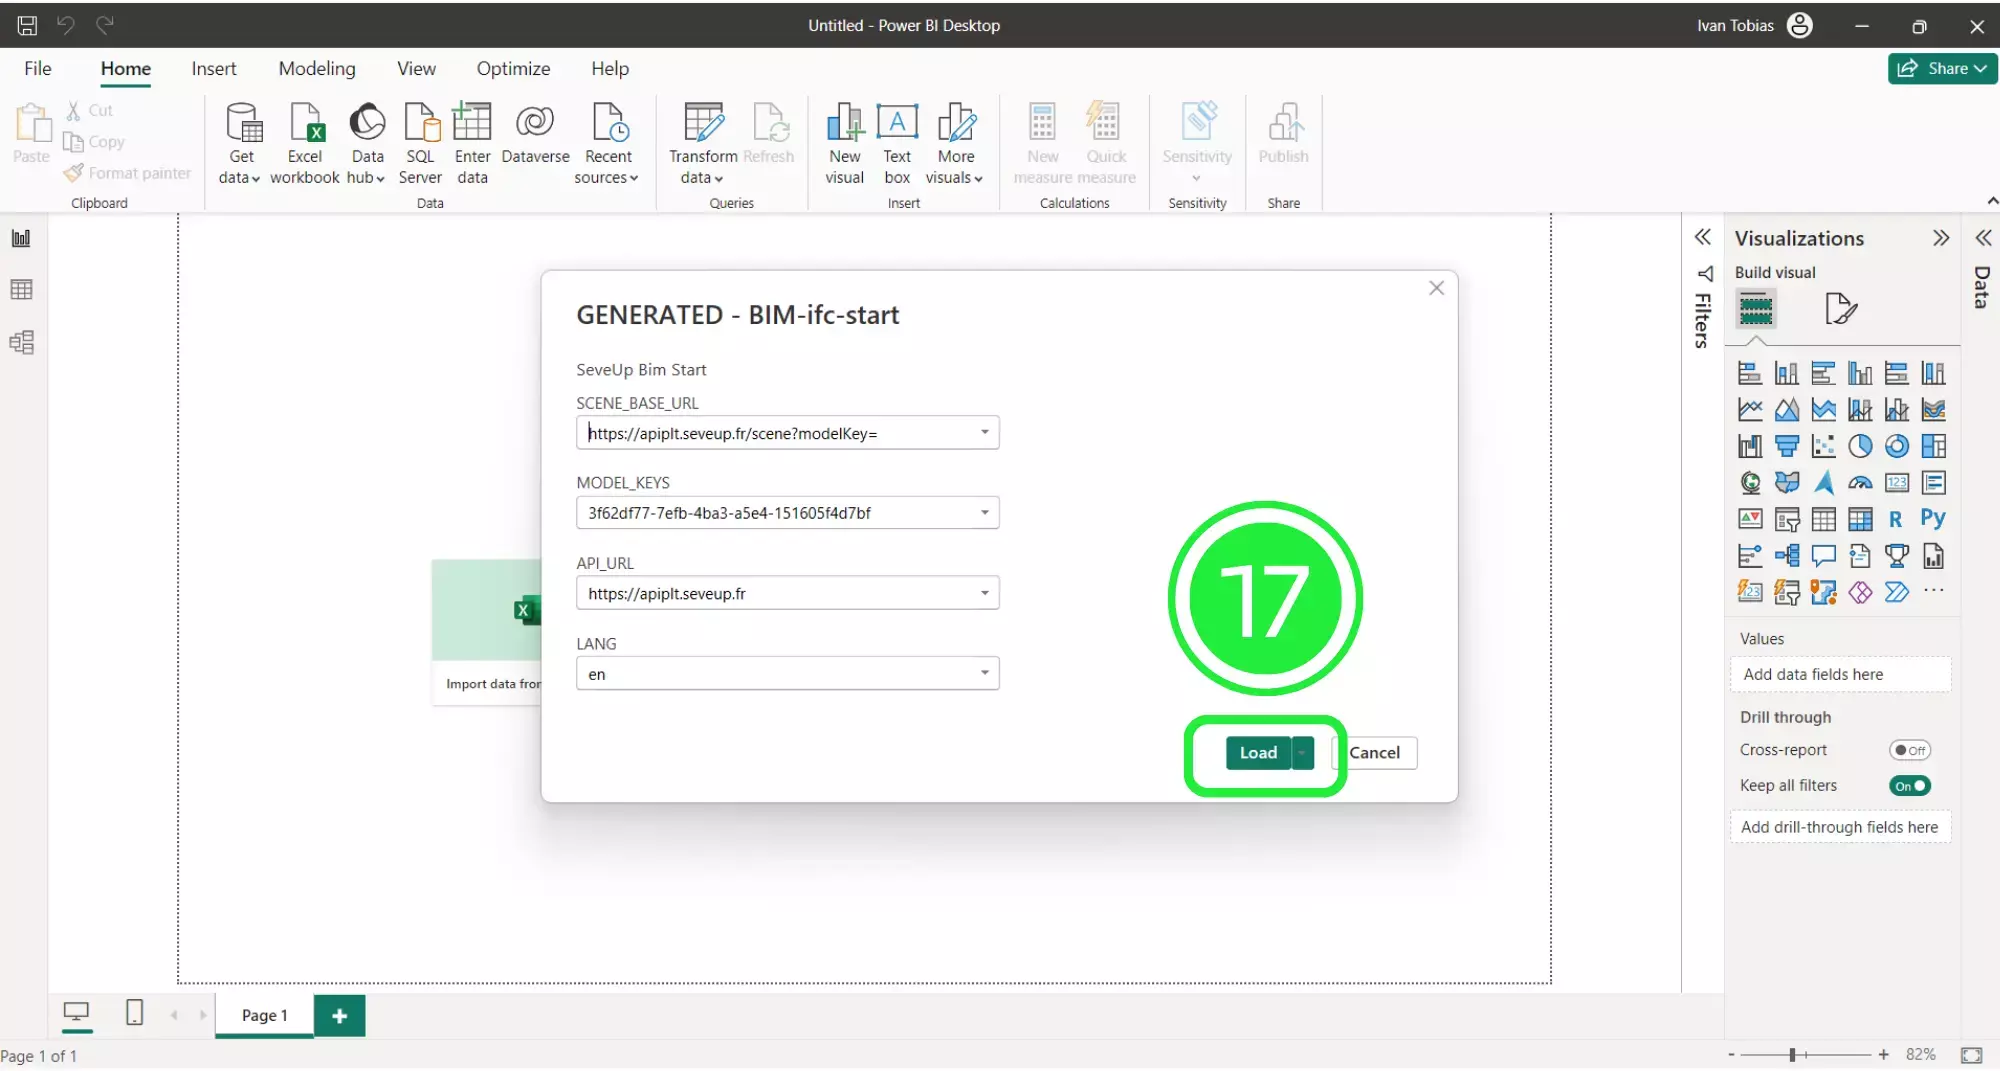
A pop-up will appear showing the file details. Click on “Load” and your Dashboard Template file will start to load in Microsoft Power BI. You counting your BIM properties using Power BI in under a minute !
Once your new dashboard template has loaded, it will populate the Power BI interface with all of the BIM data that was in the files you added.
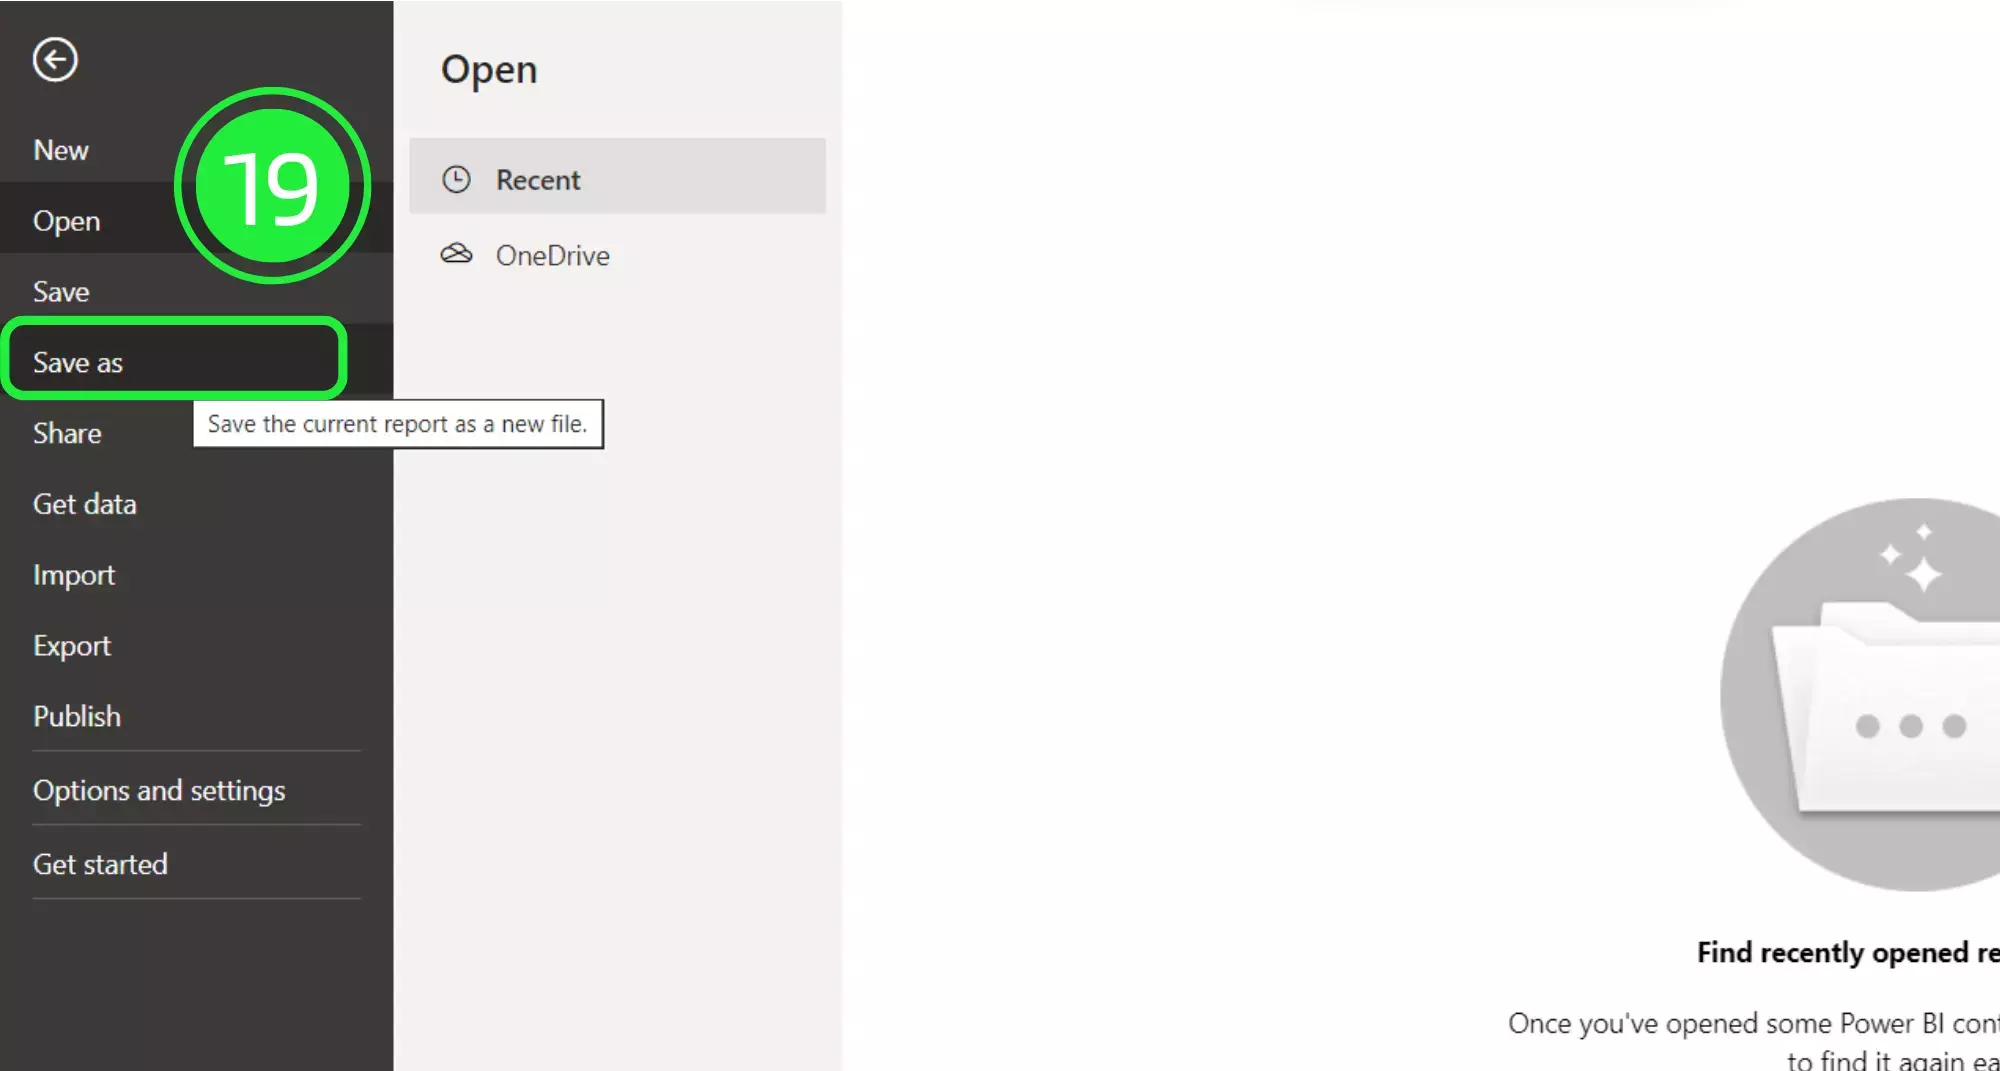
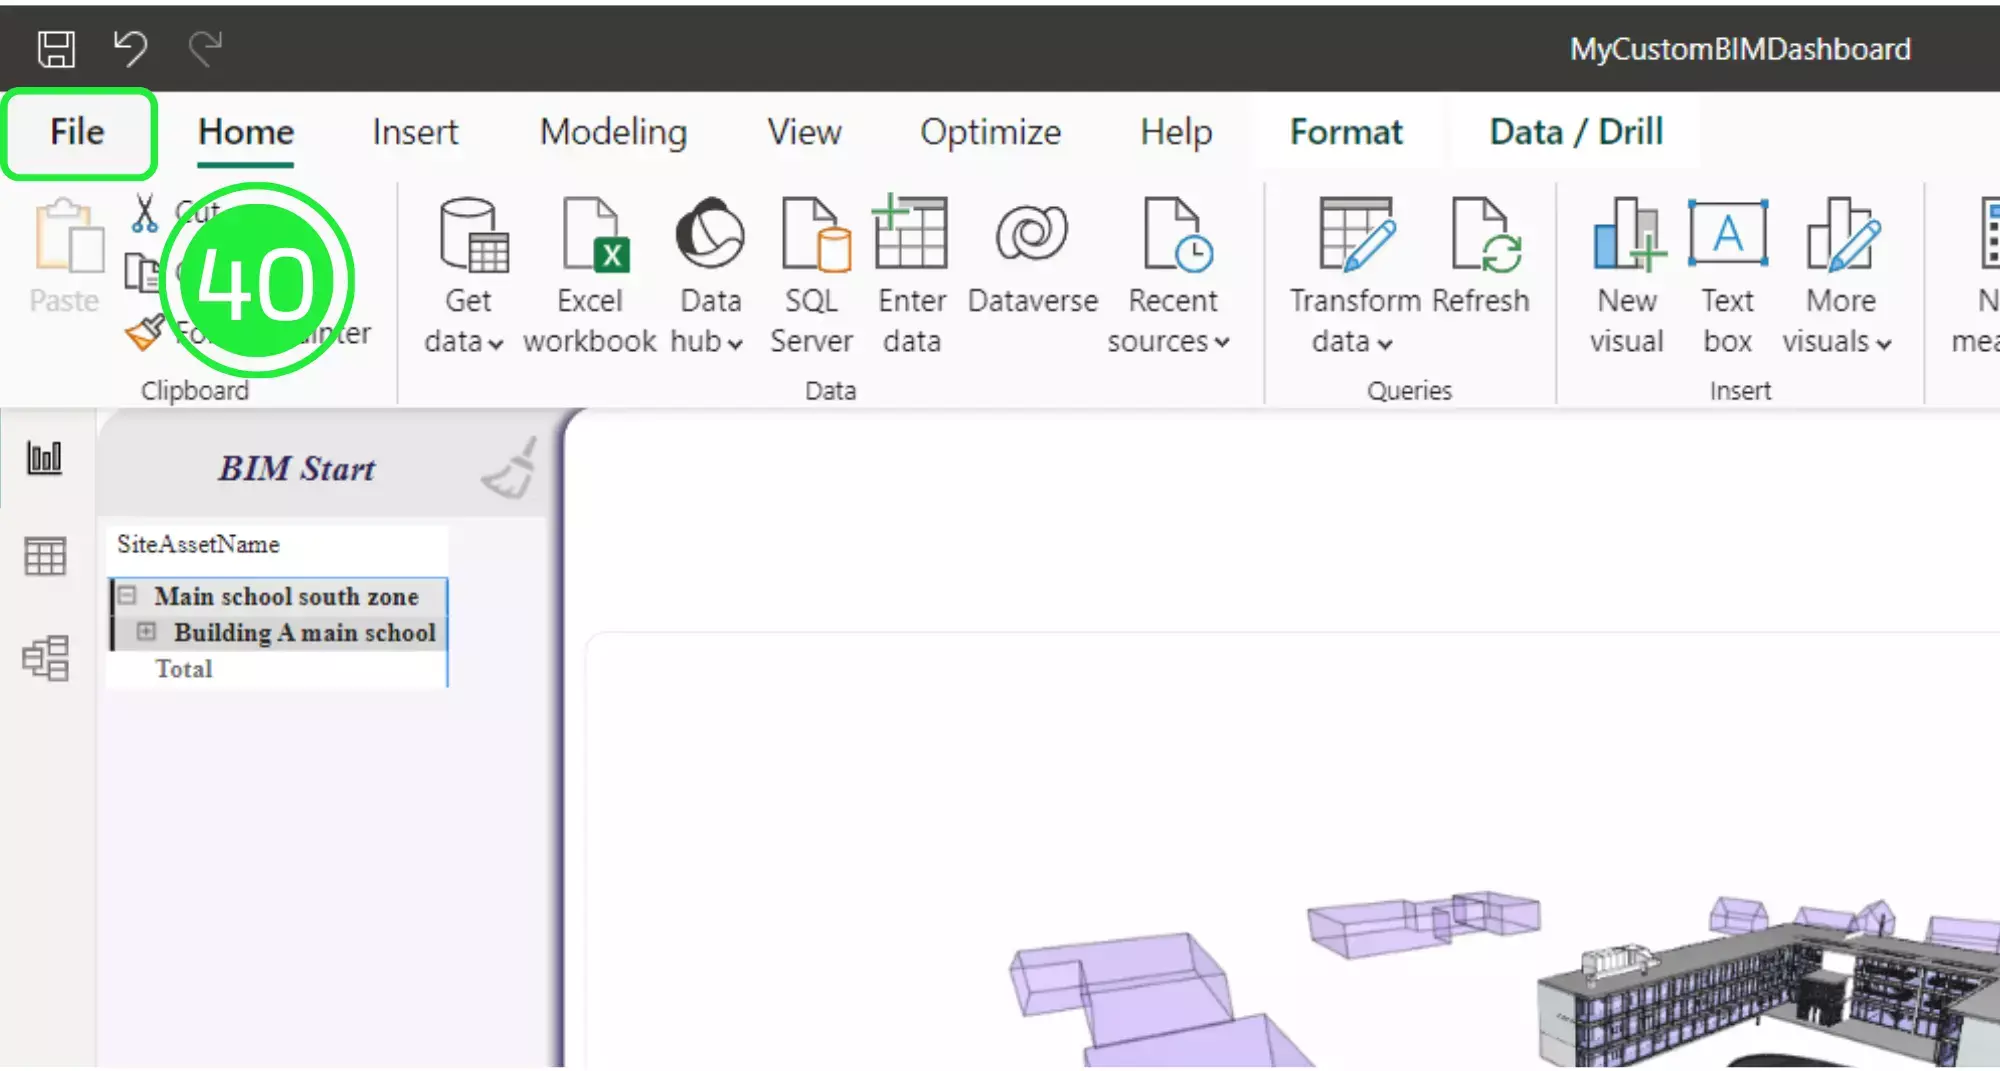
In order to build the template in Power BI we first need to save it as a Power BI file (.pbix). To do this click on “File” in the top left corner of the page.
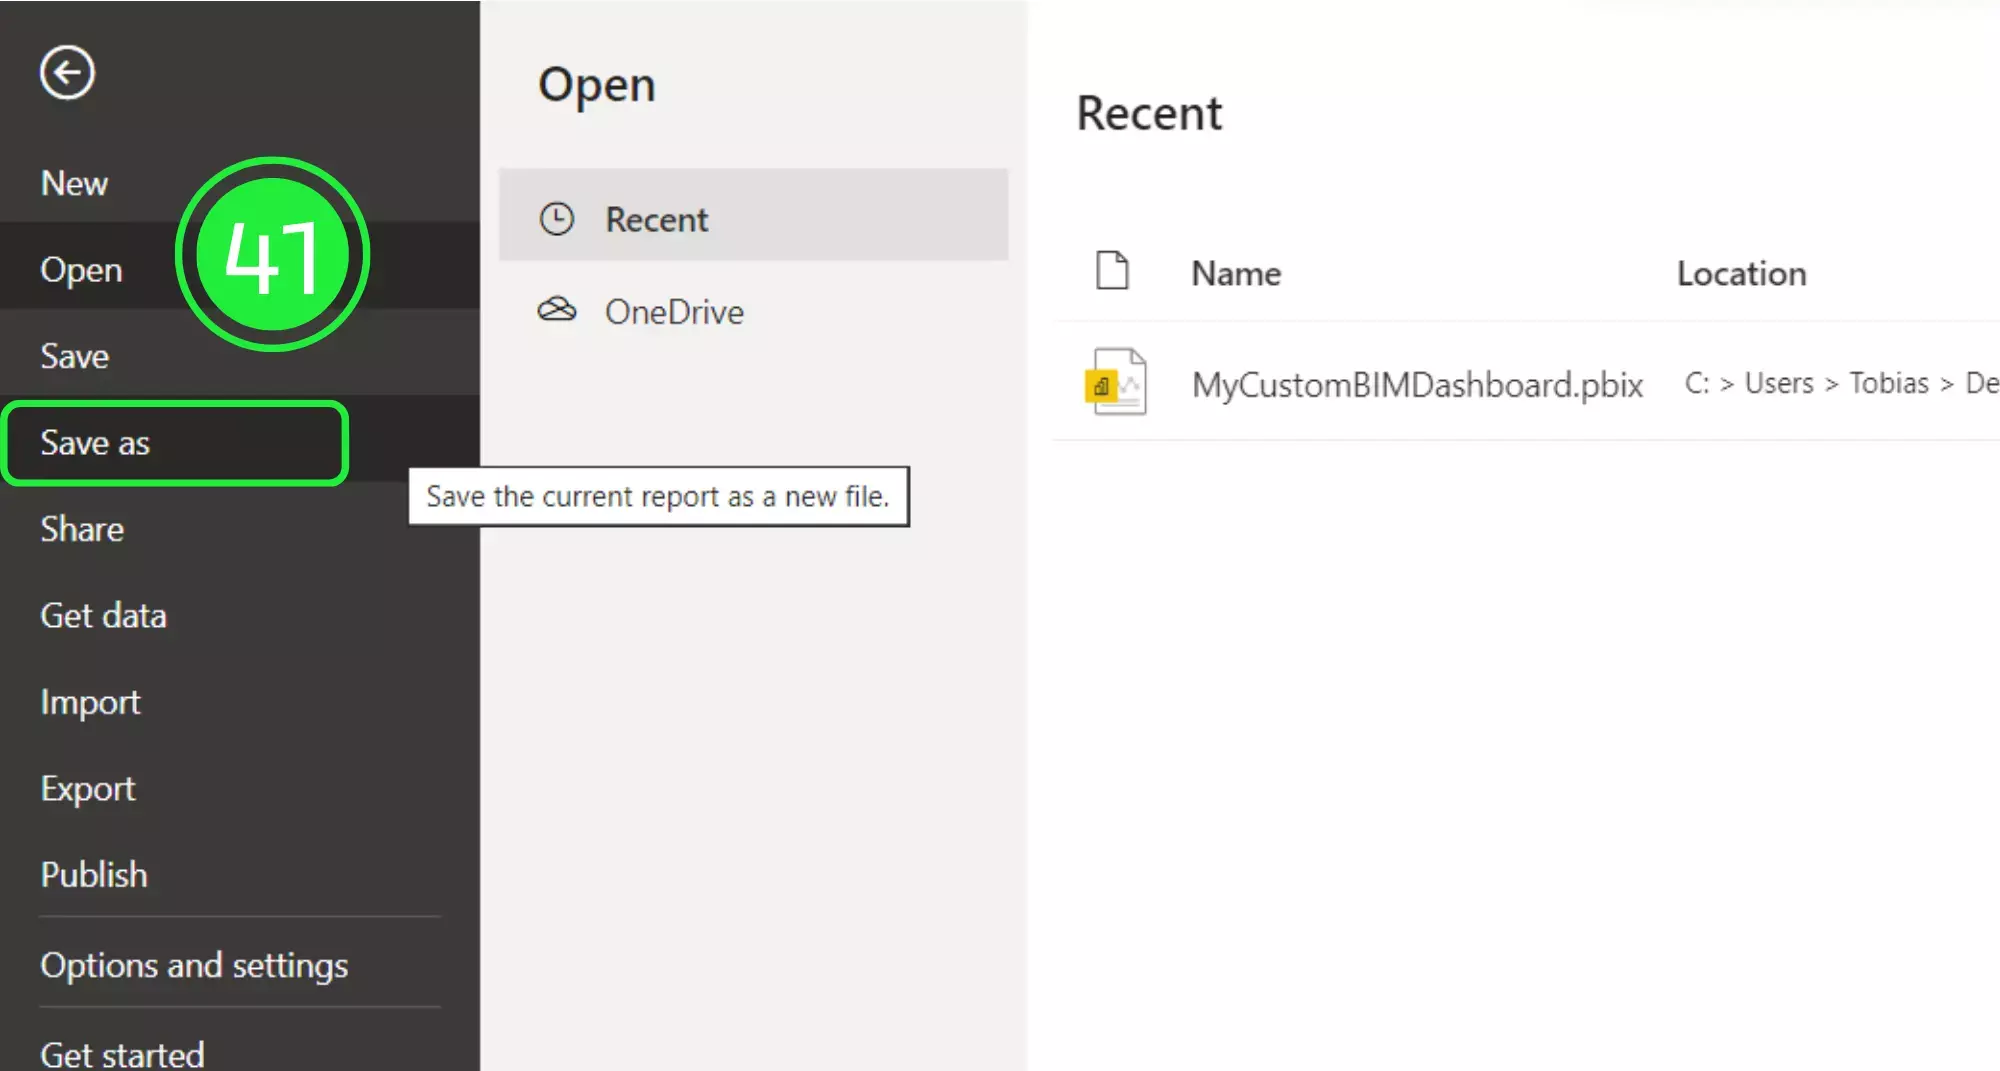
Select “Save As” in order to save your file.
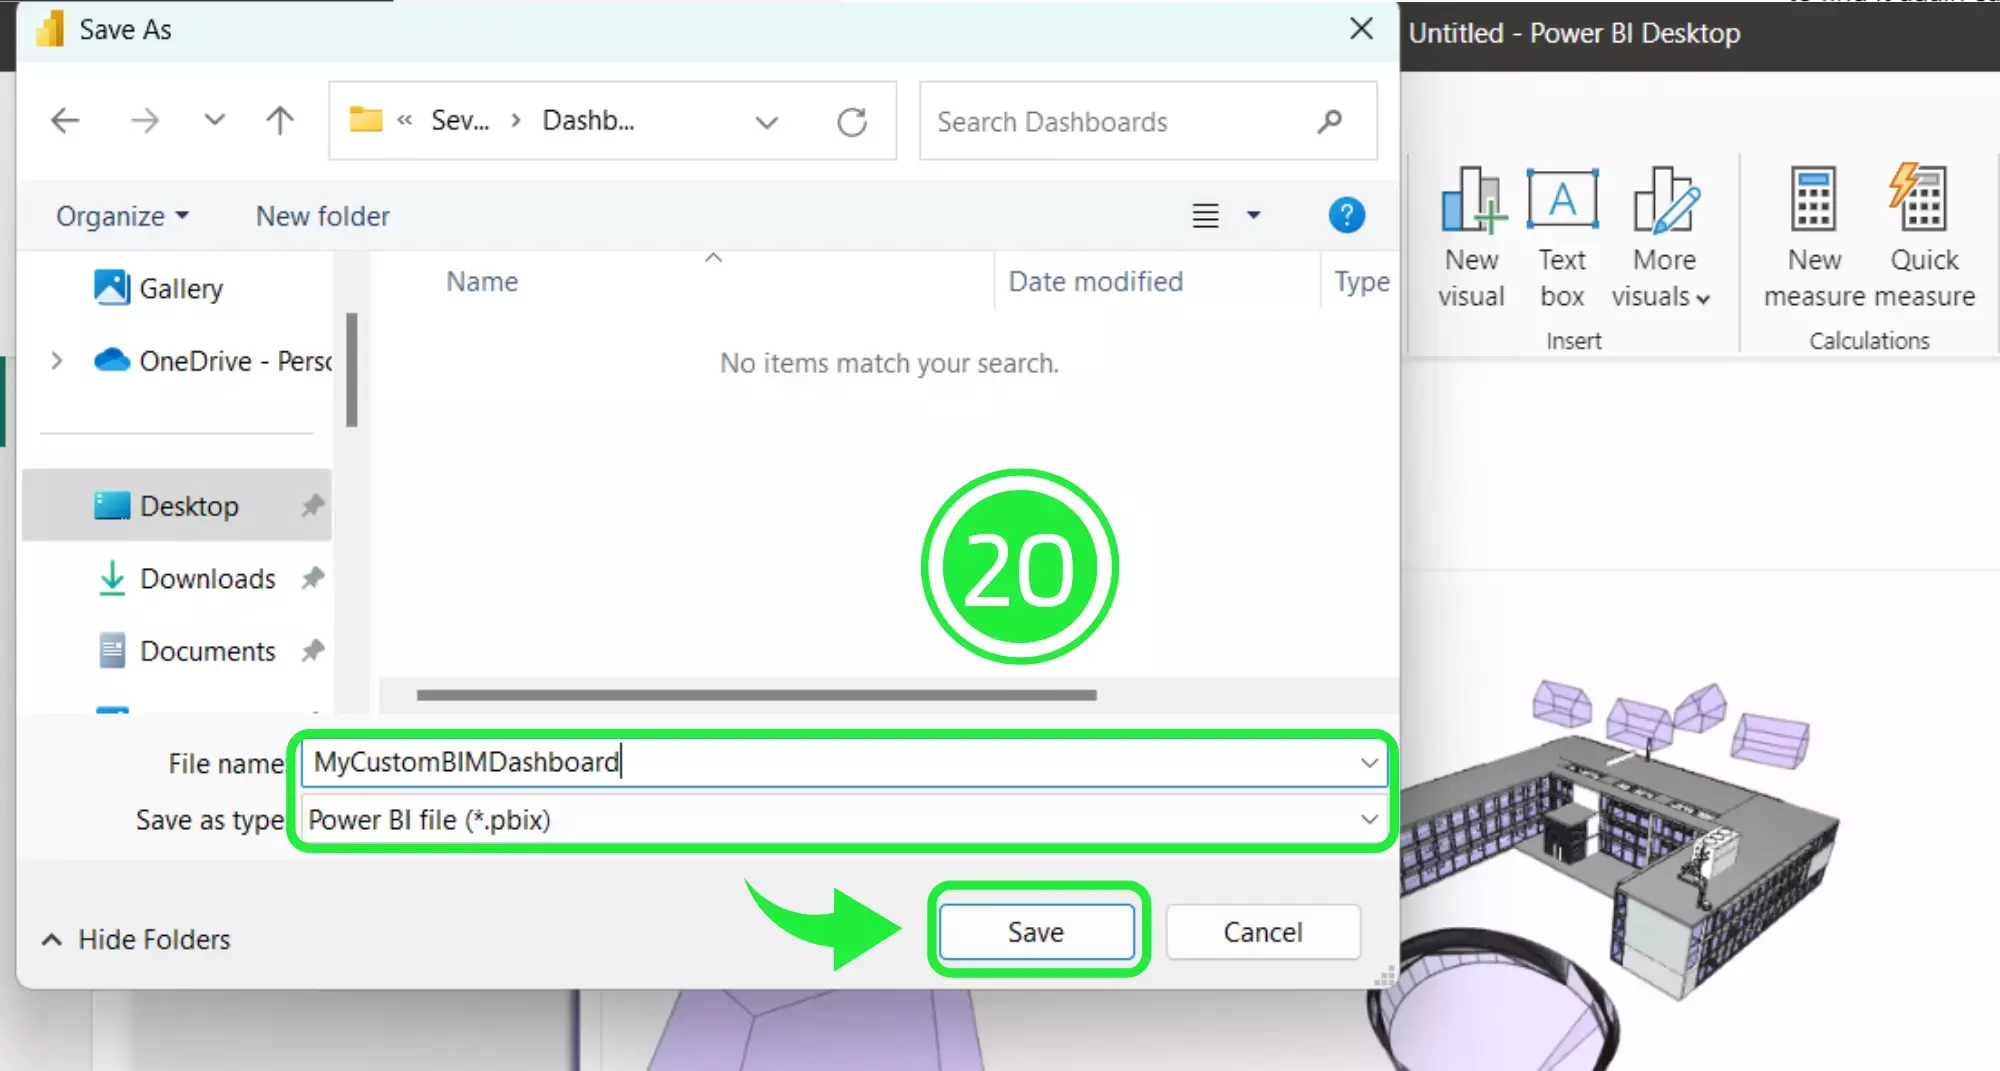
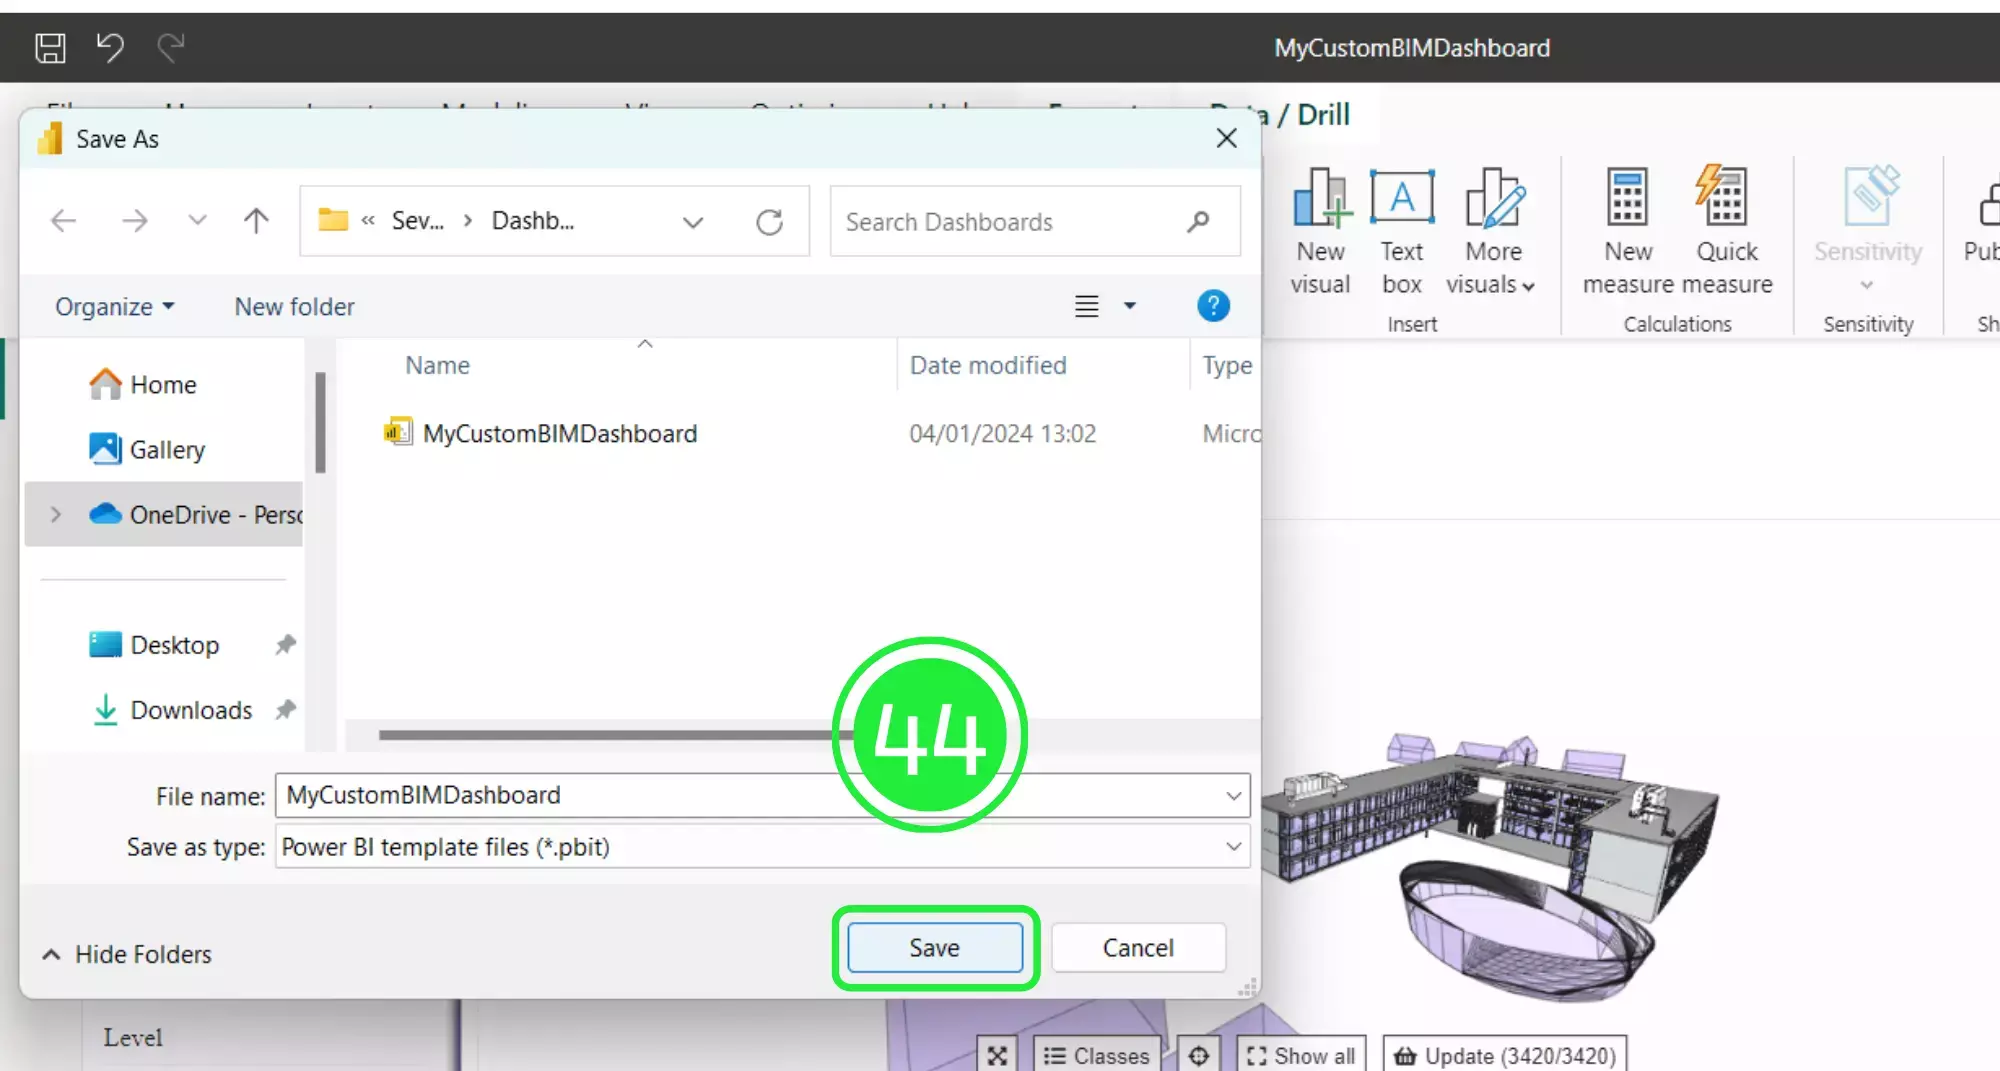
Choose an appropriate name for your file and then click on the “Save” button.
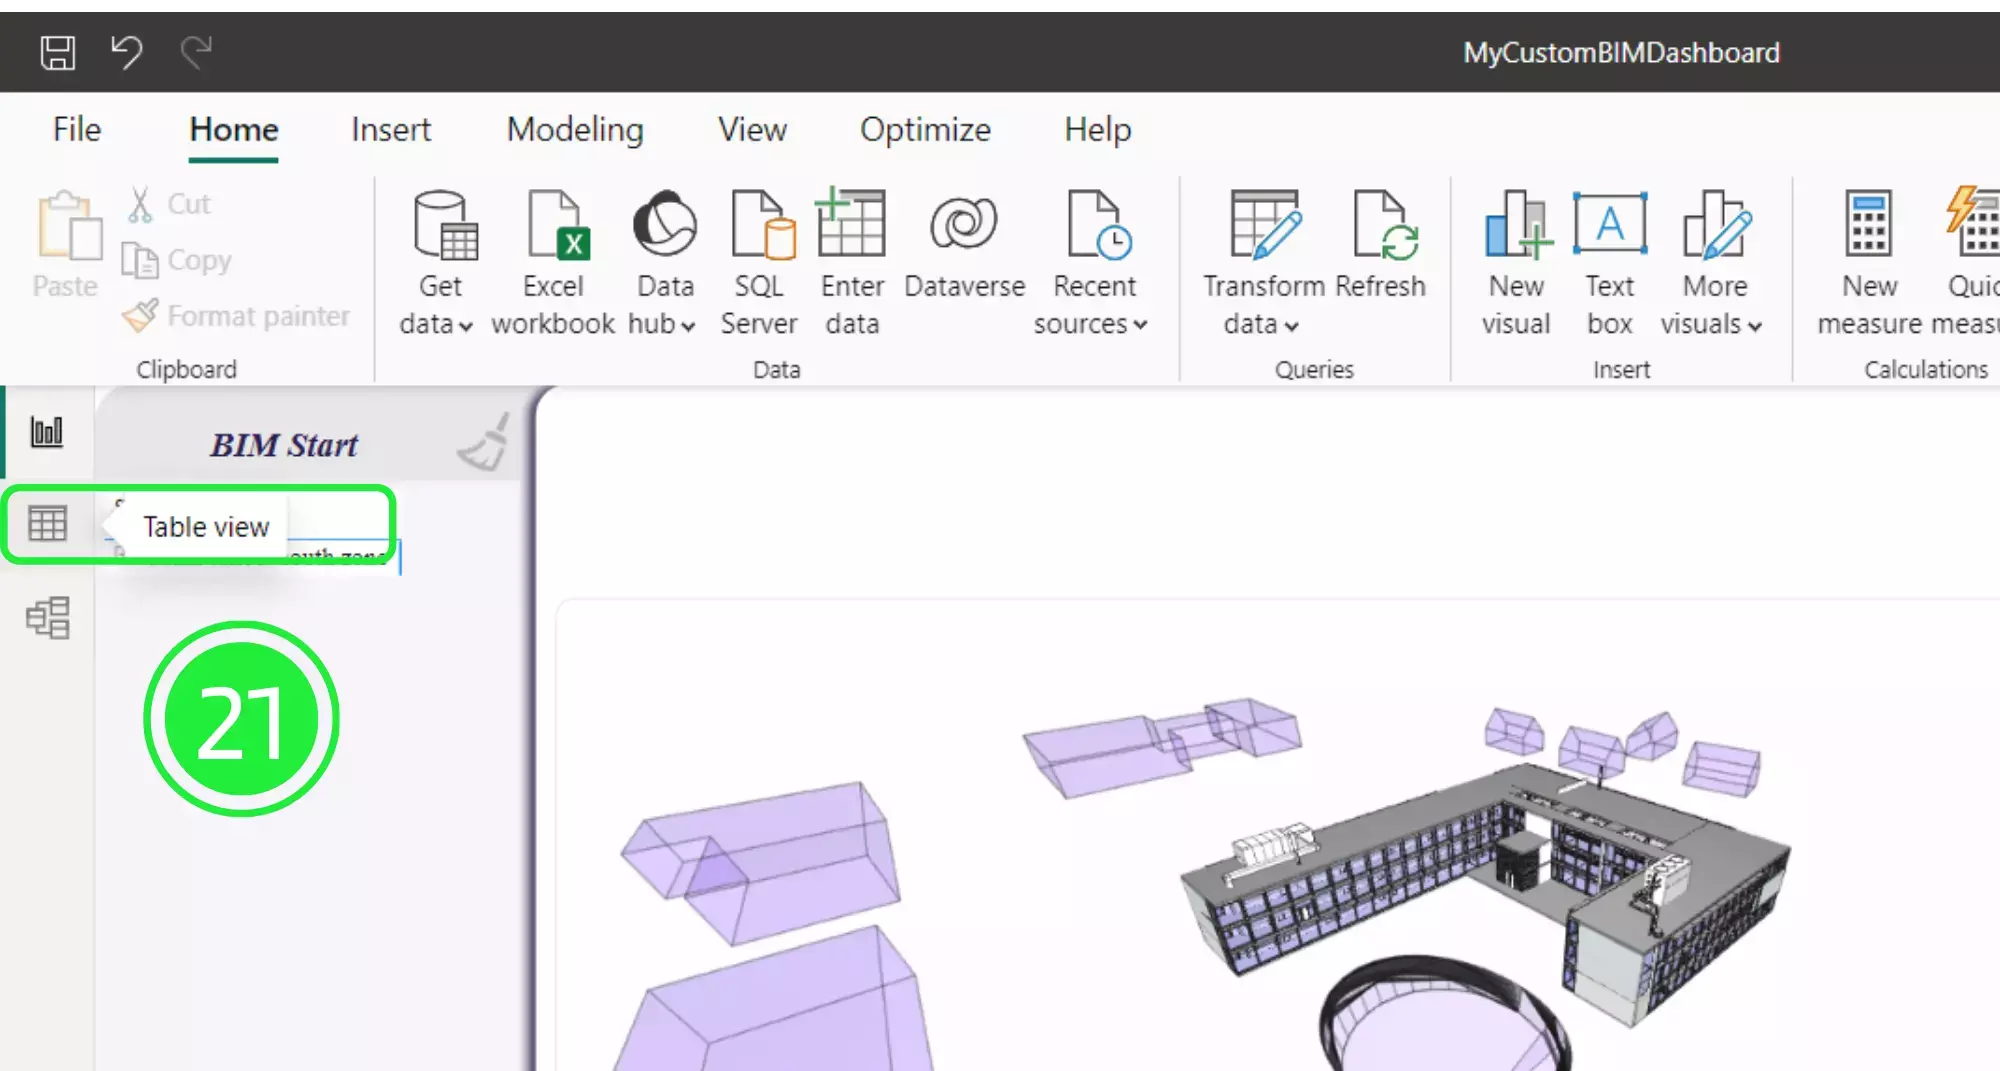
On the left hand side of the report there are several options for viewing the data. Click on the second option, “Table View” in order to display the data as a table.
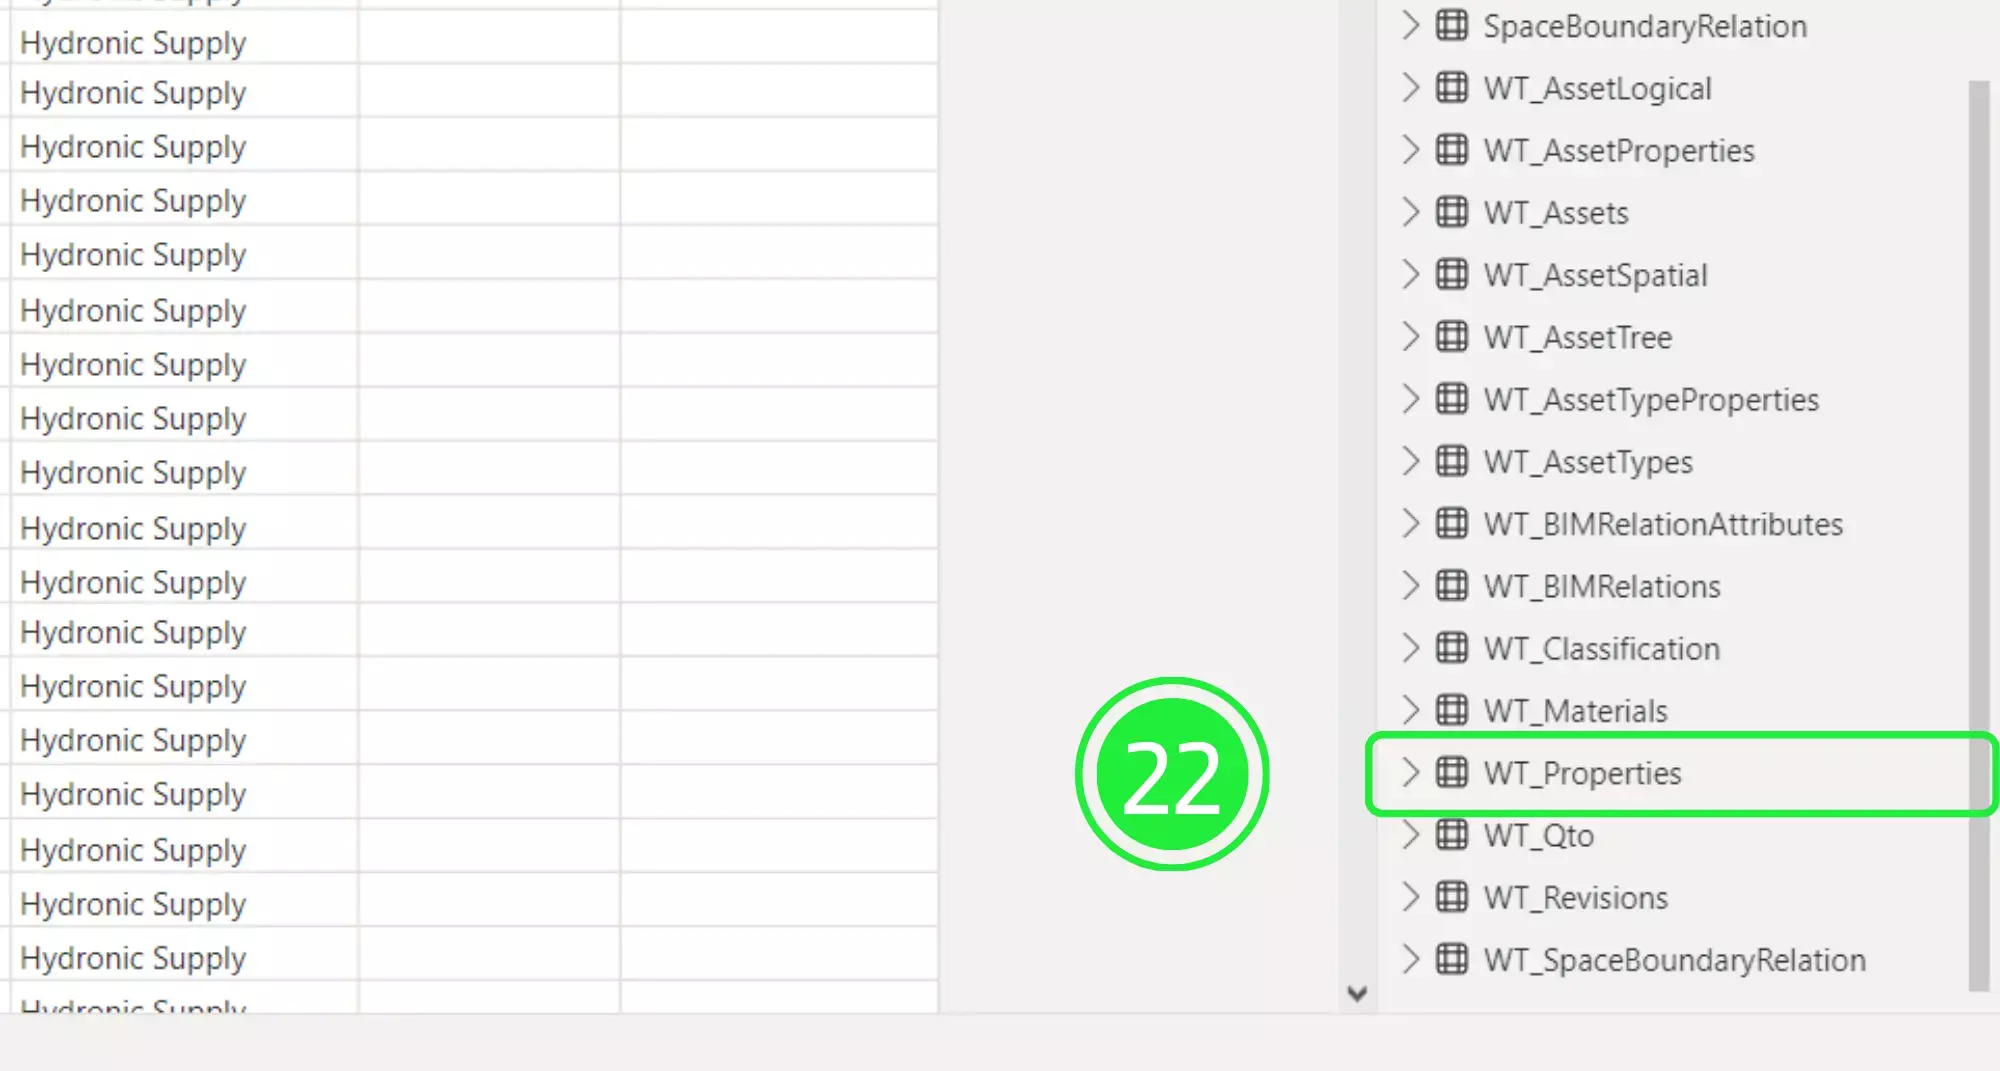
Now, choose “WT_Properties” from the list on the right hand side under the Data pane. Now you can view all of the major information about your assets within your BIM Model. Can you see how easy it is to count your BIM properties in power BI ?
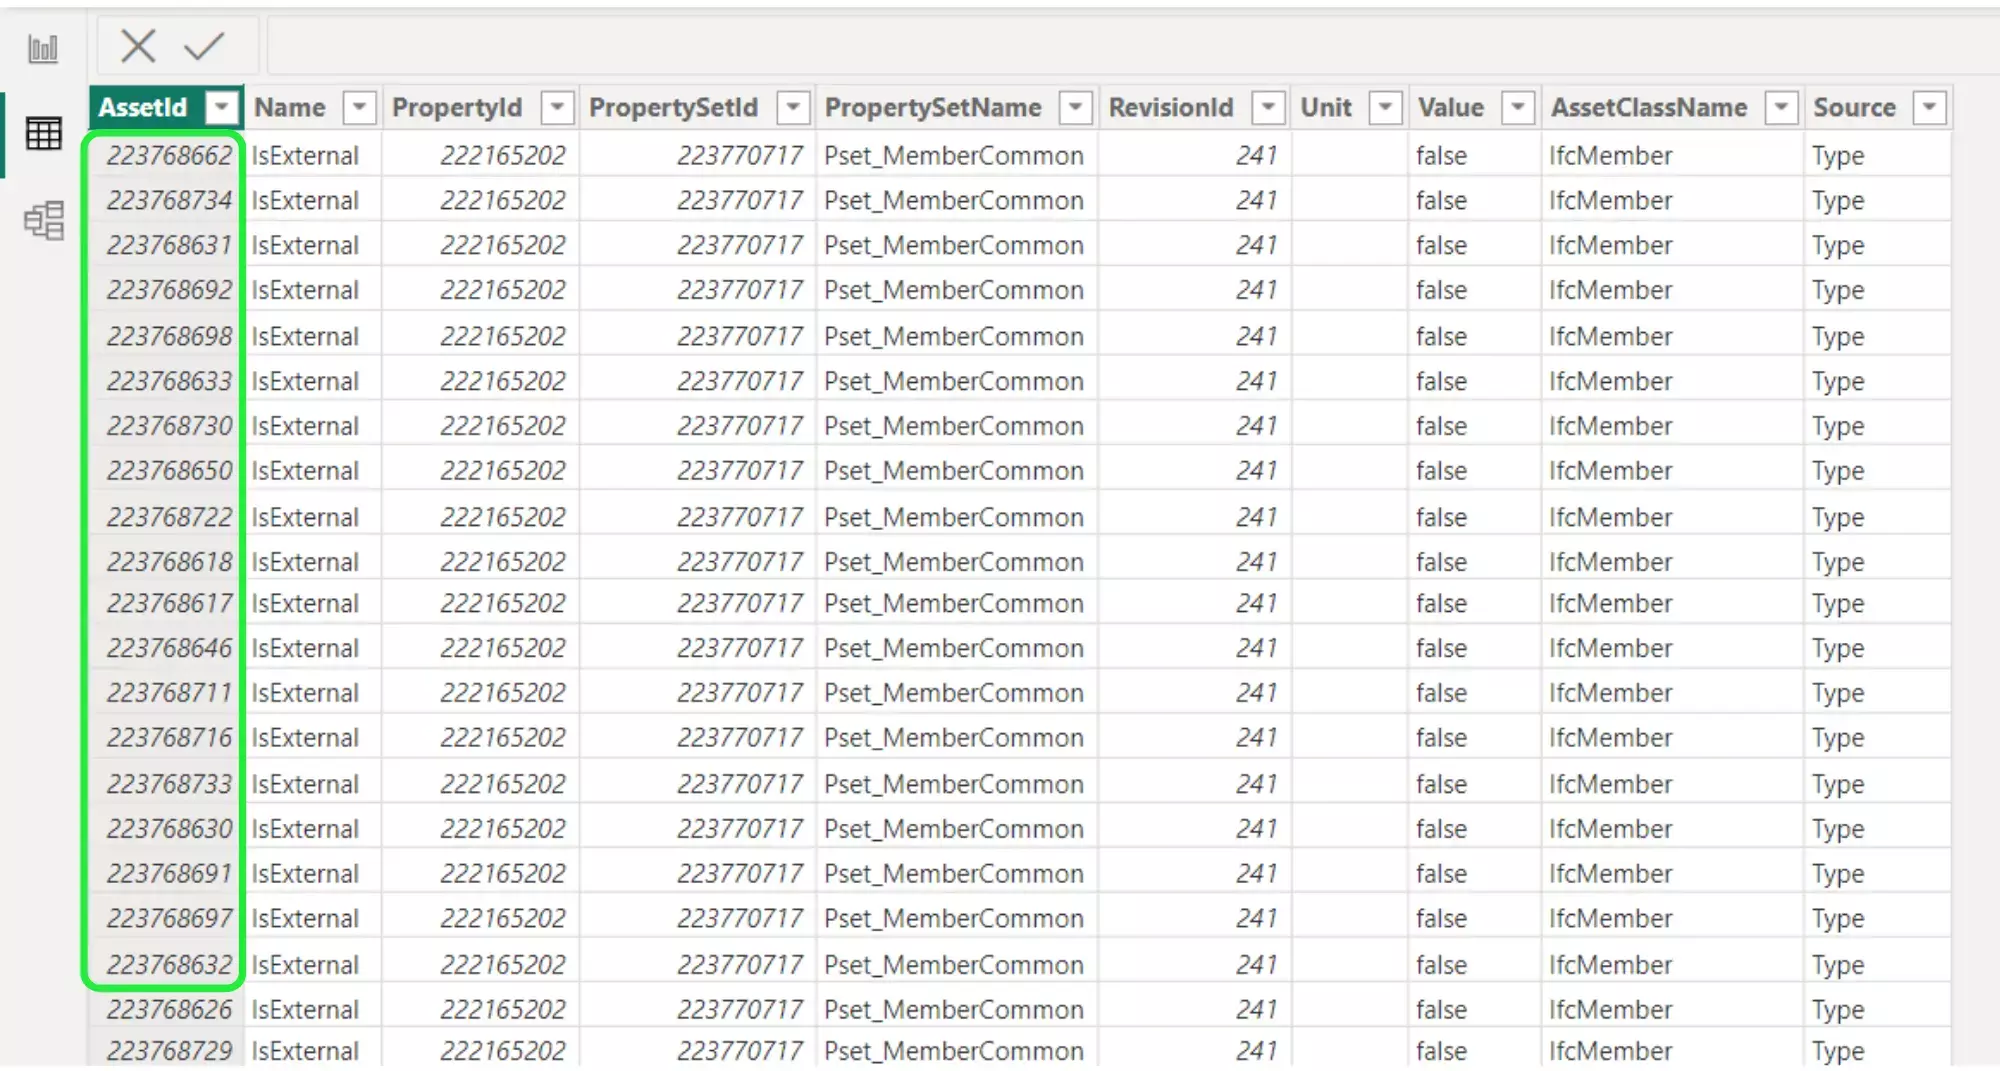
The first column is called “AssetID”. This column is in almost every SeveUp app dataset table because it’s used to create relationships between each of the tables.
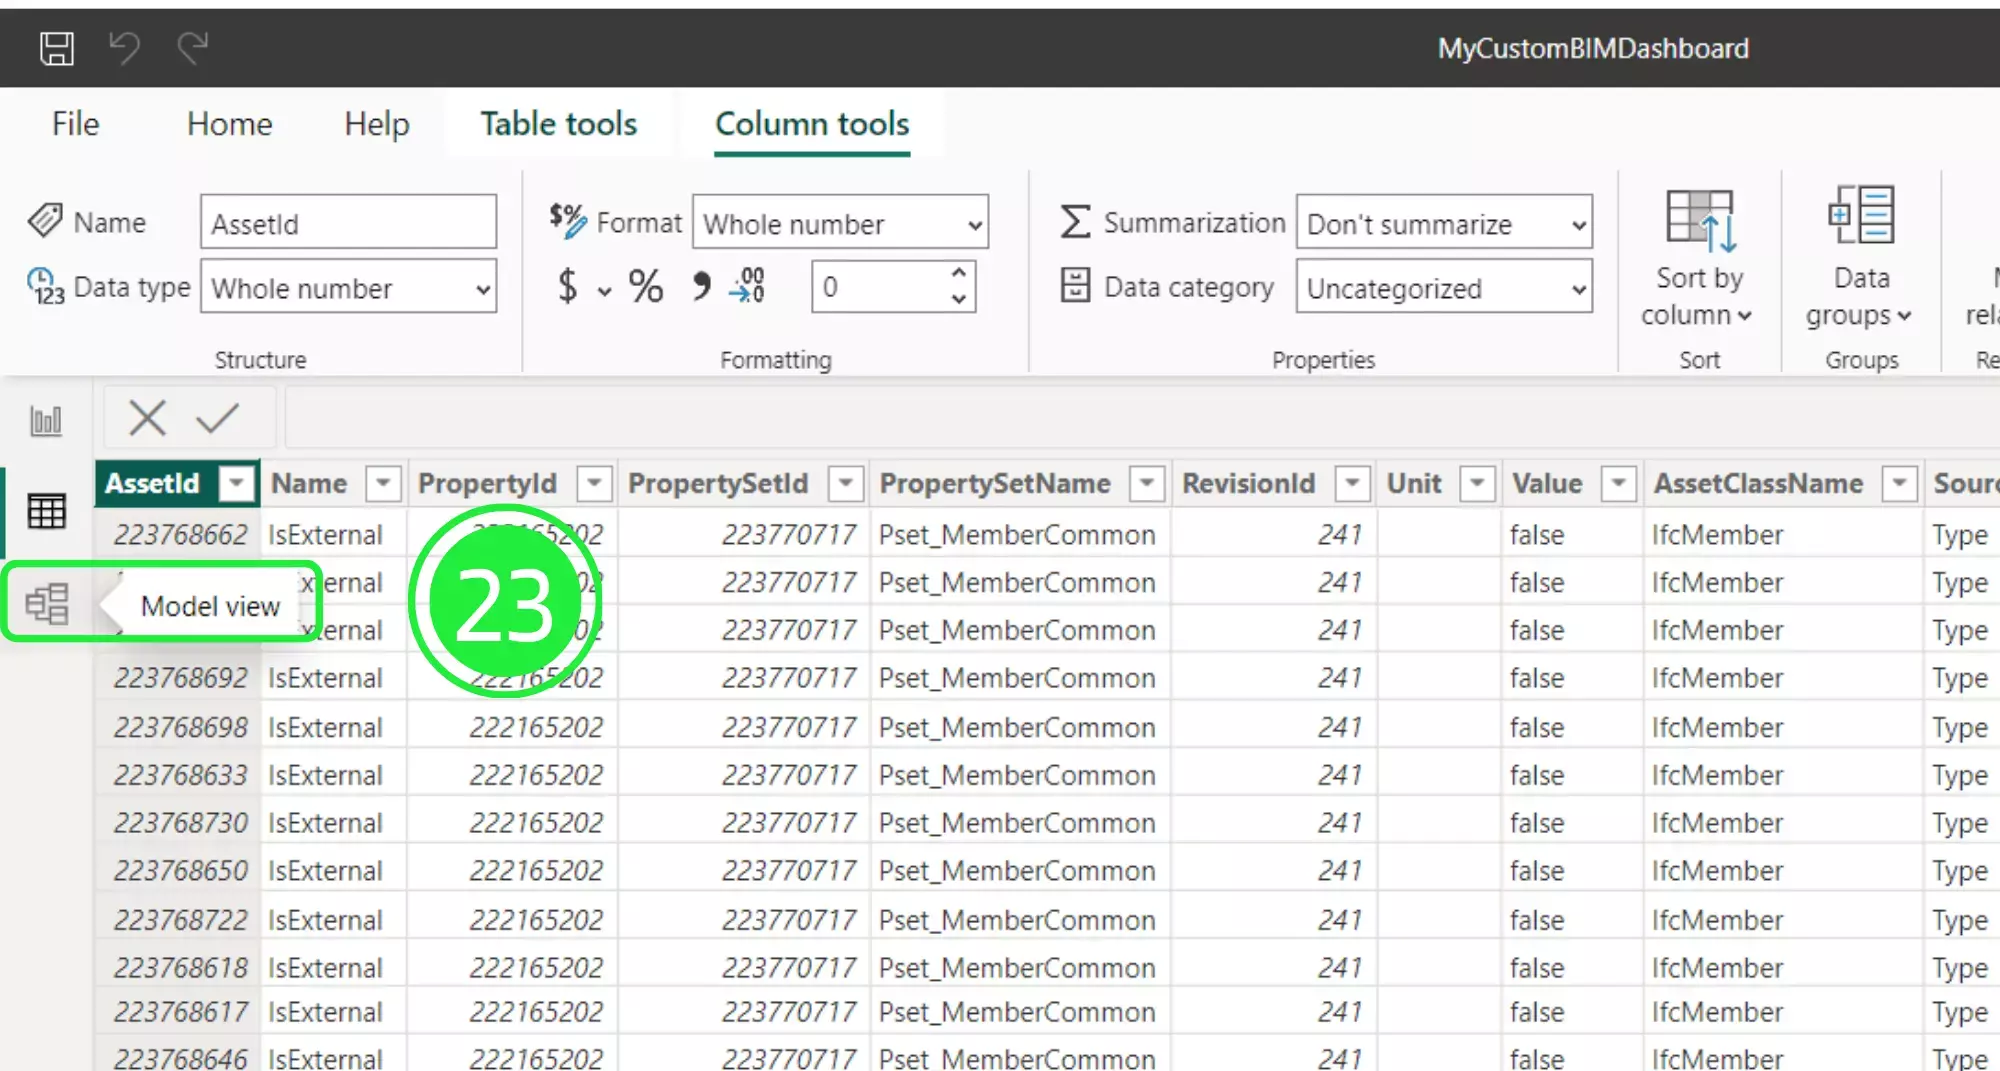
Click on “Model View” on the left hand side of the table to see the relationships.
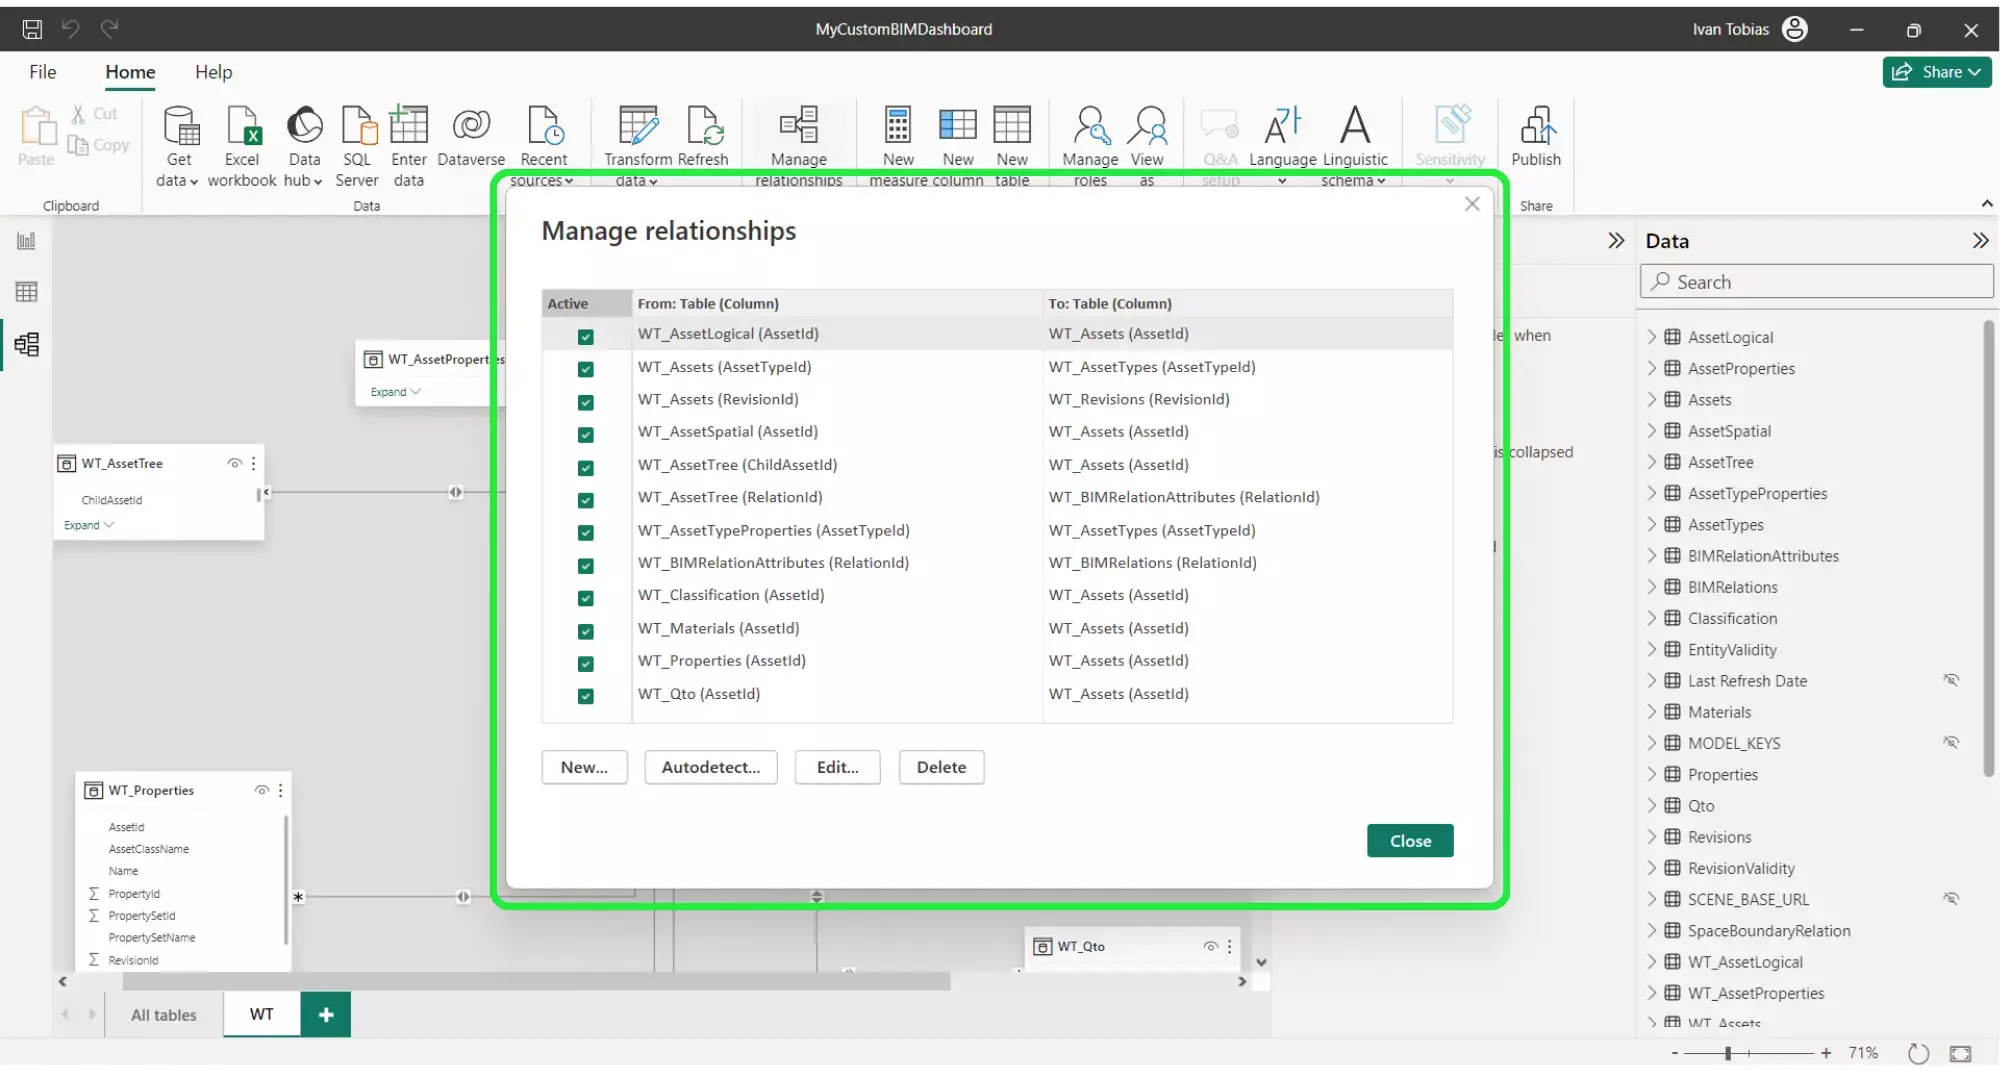
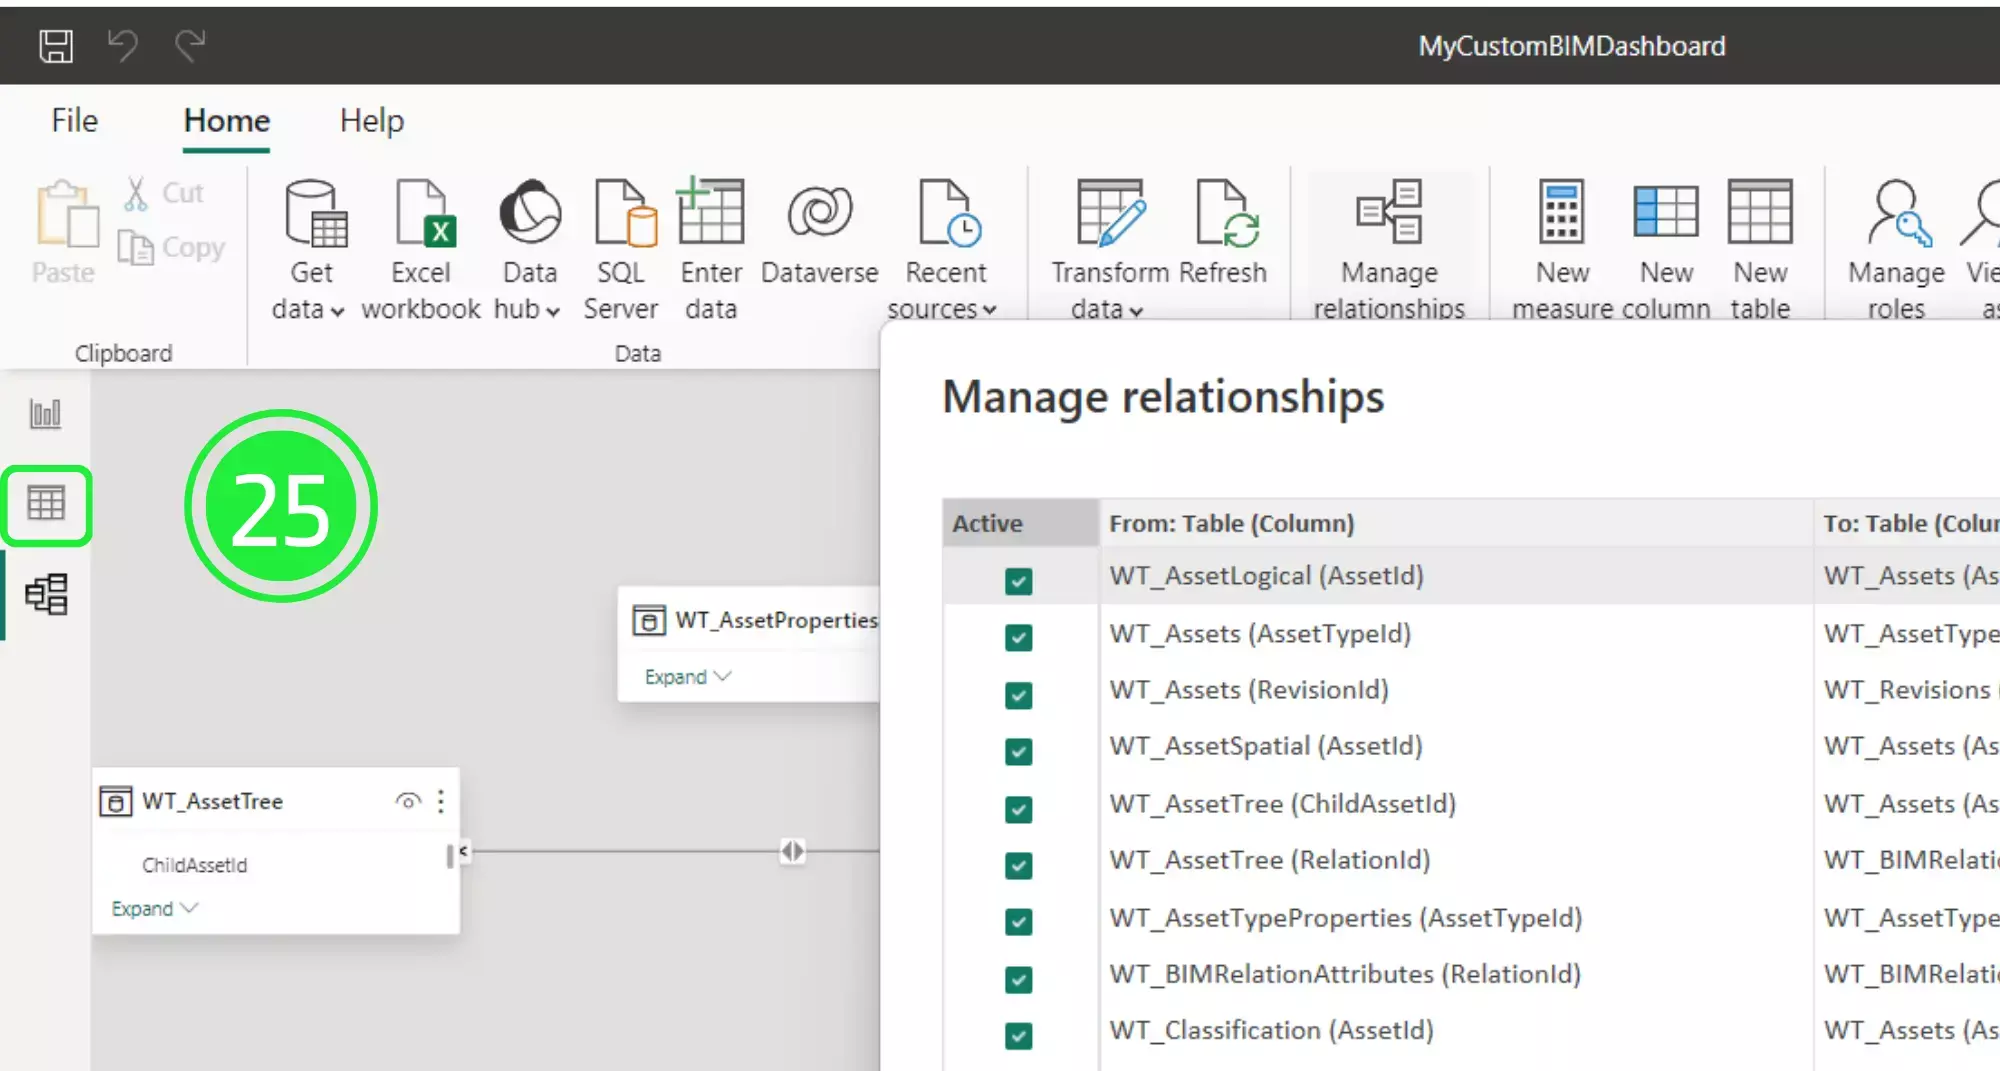
Now click on “Manage Relationships” in the top horizontal menu.
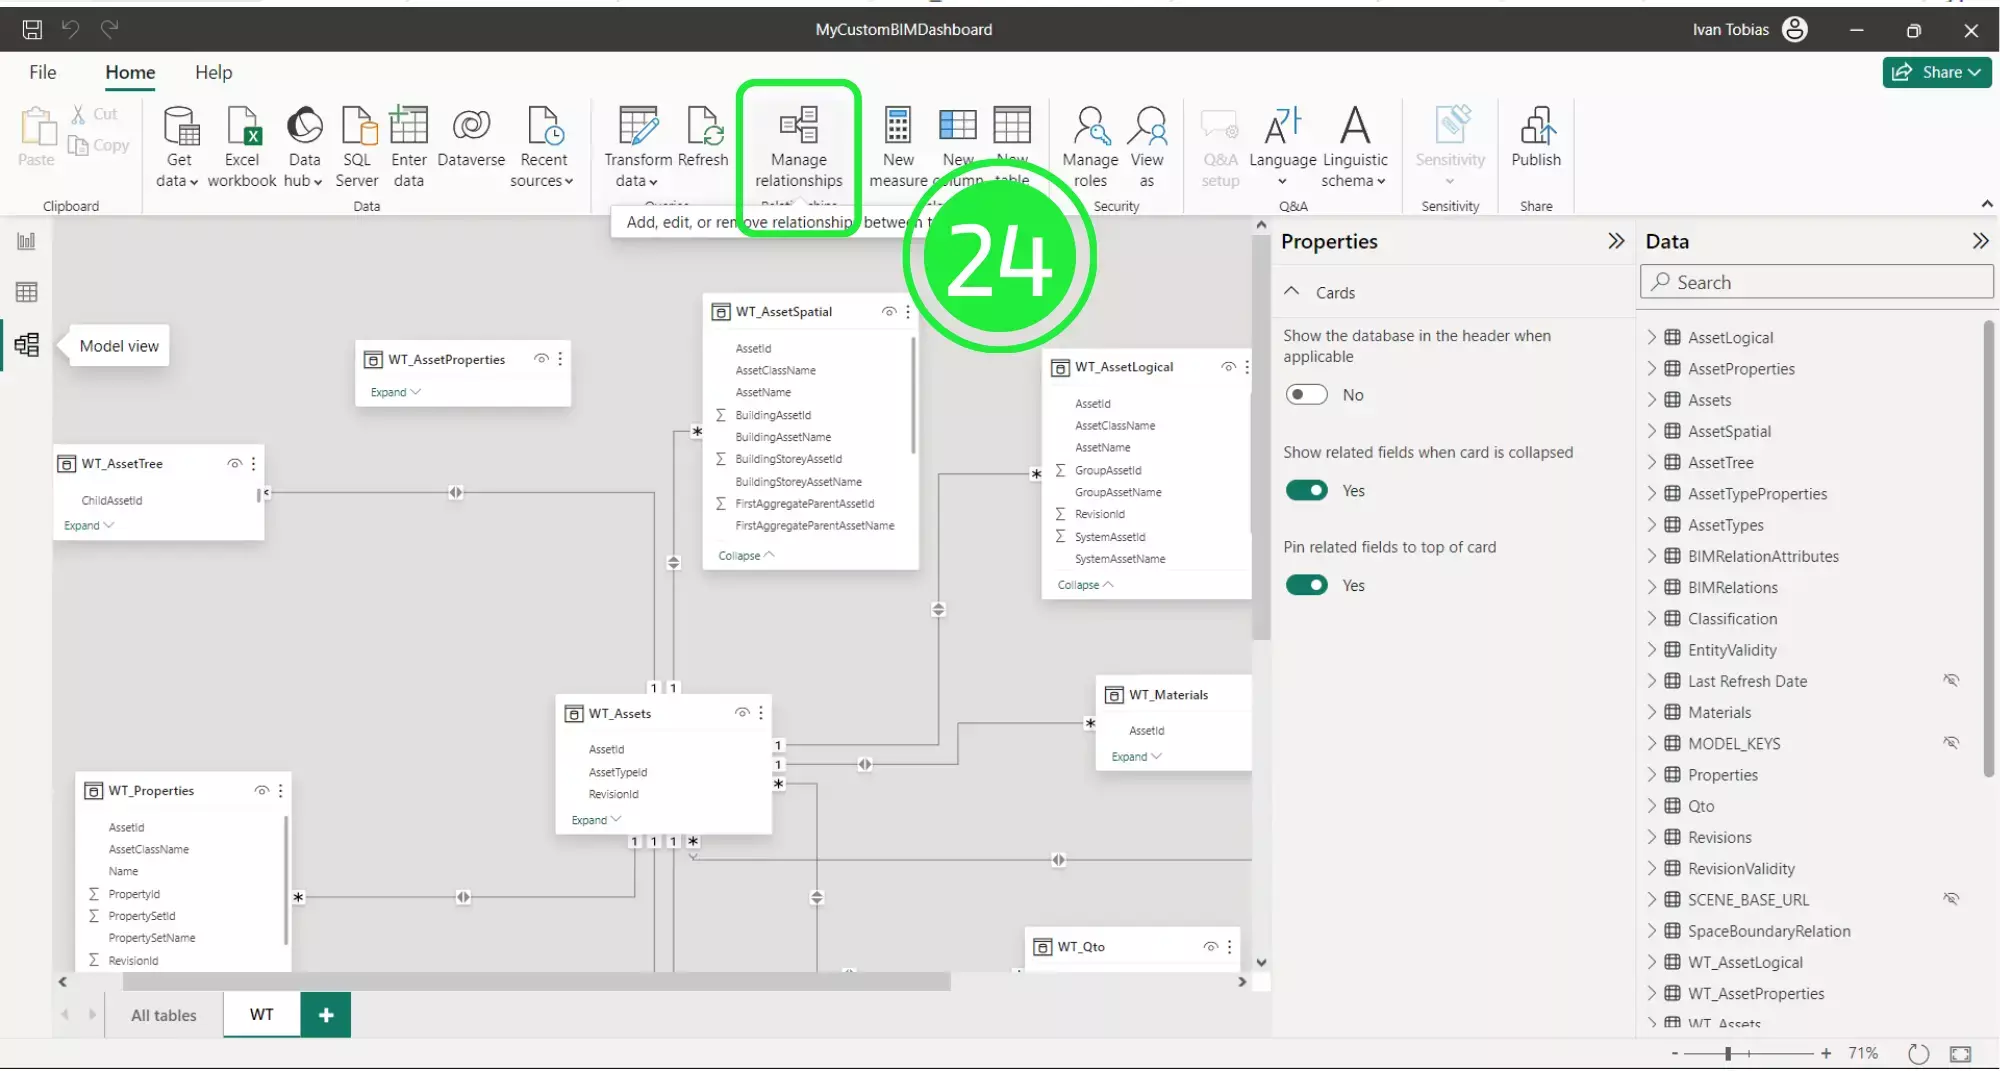
This shows how these relationships are defined and they are important for accurately calculating our results and making sure that the information that’s displayed in our dashboard is correct.
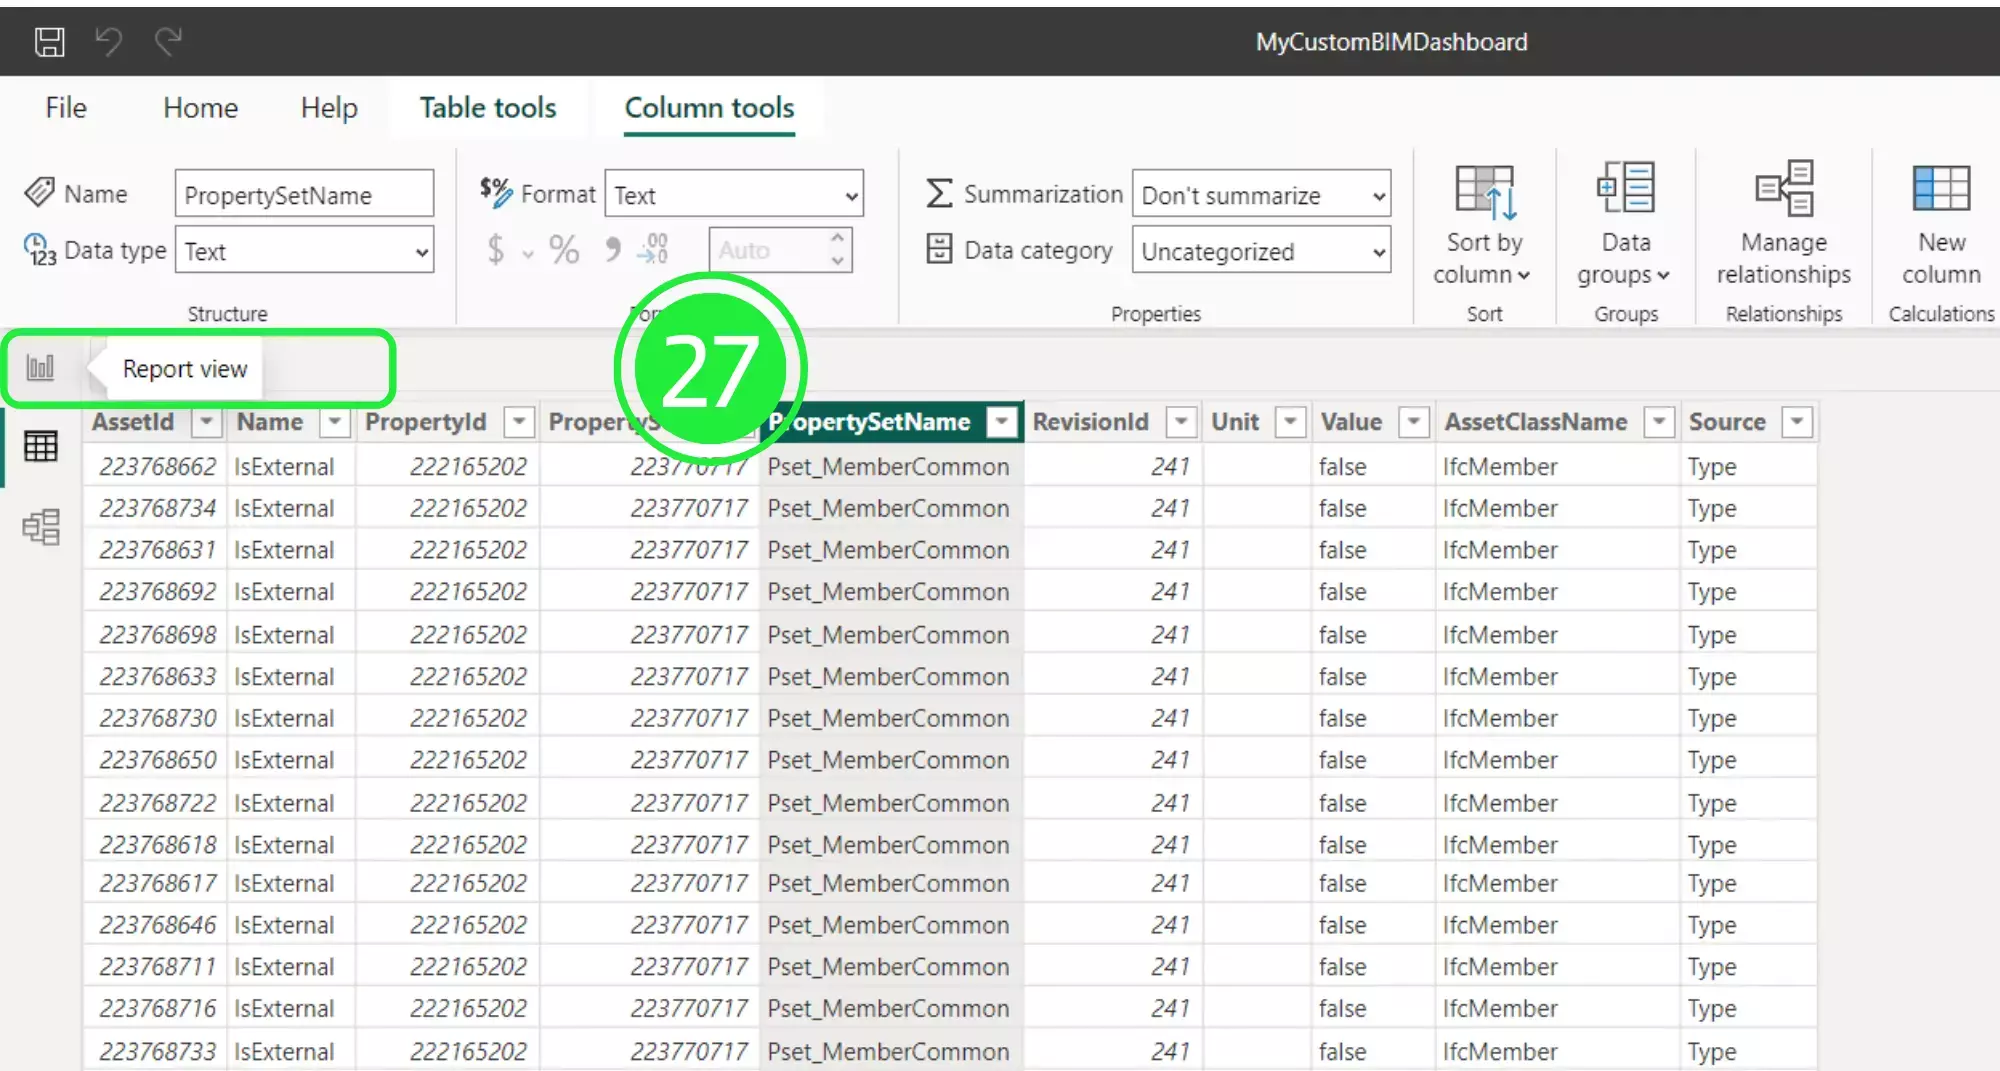
Click on “Table View” to go back to viewing the data as a table again.
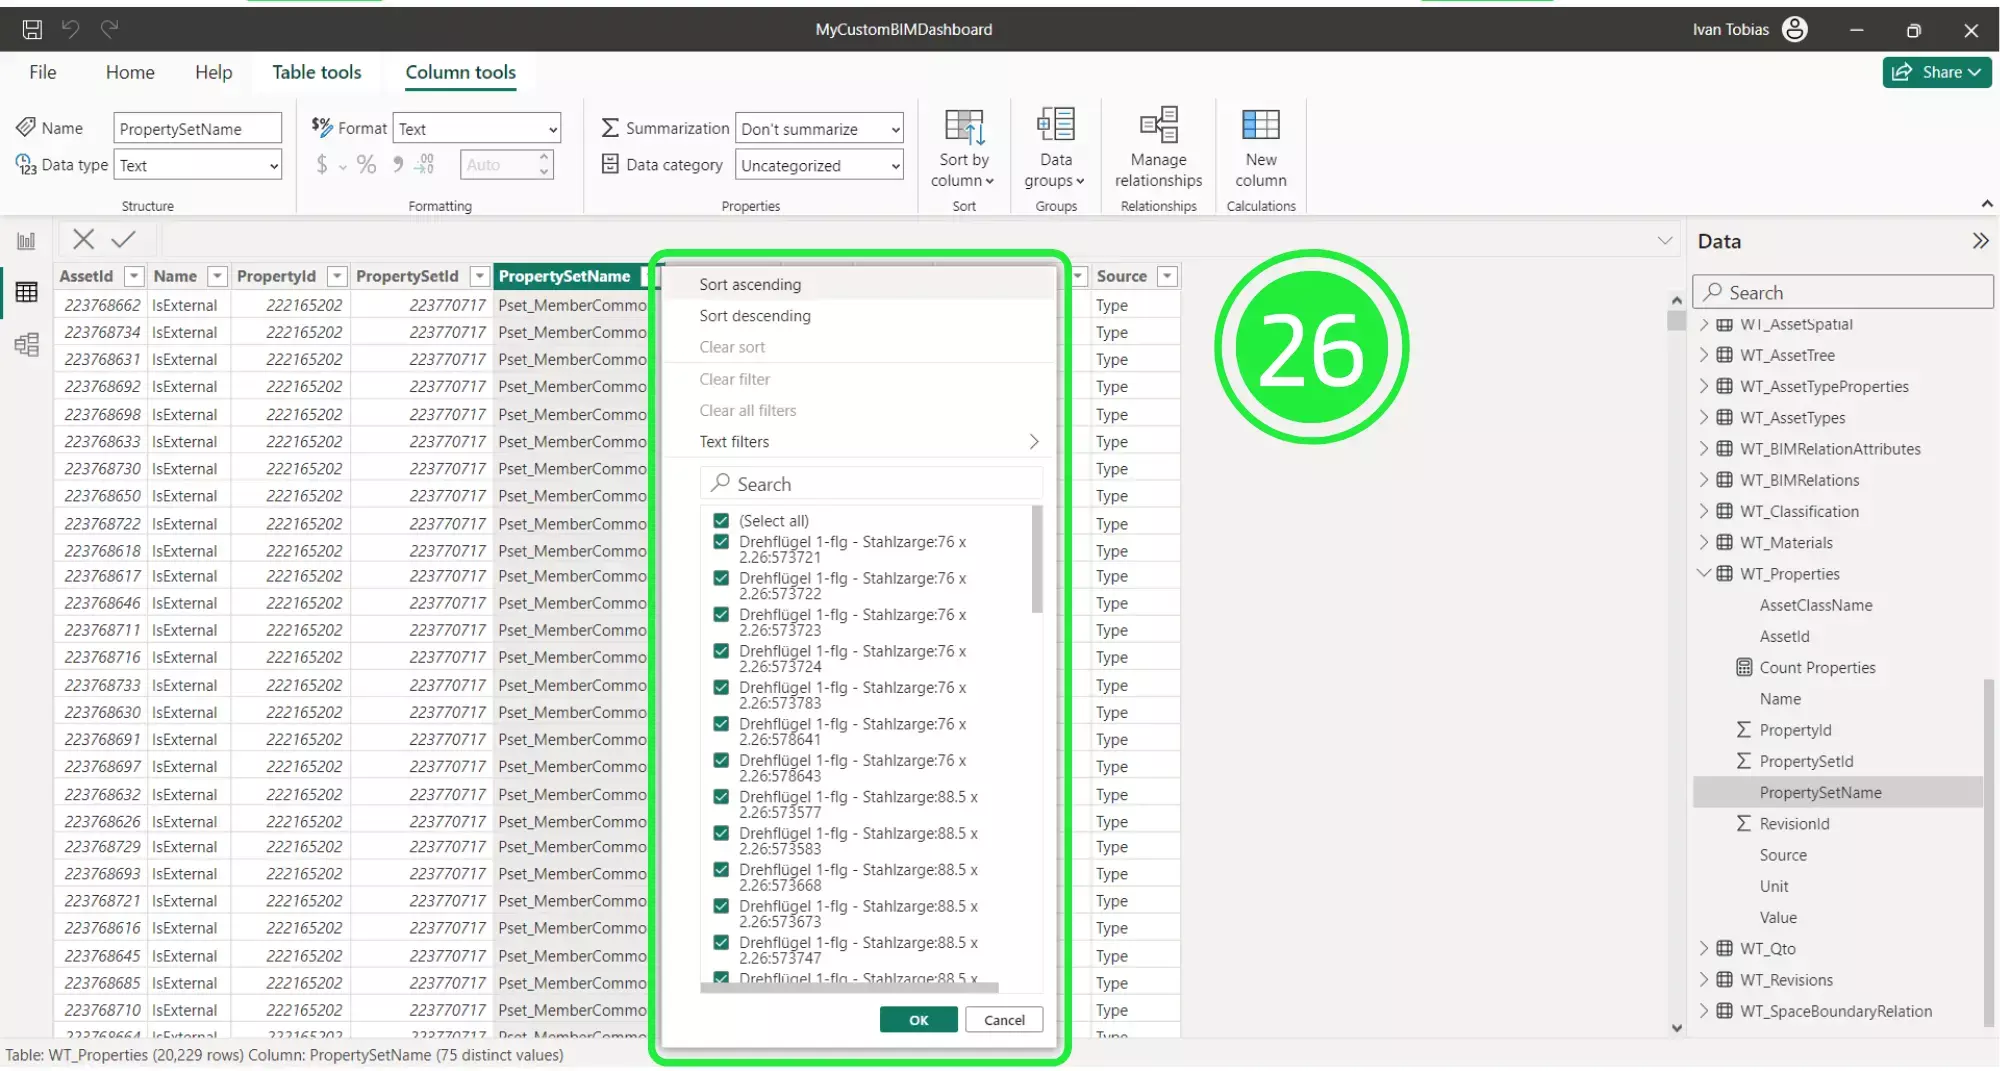
The table contains several different columns. The ones that we will be using for building our “Card Visual” are the “Name”, “PropertySetName” and “Value” columns. “PropertySetName” is a container class that holds properties
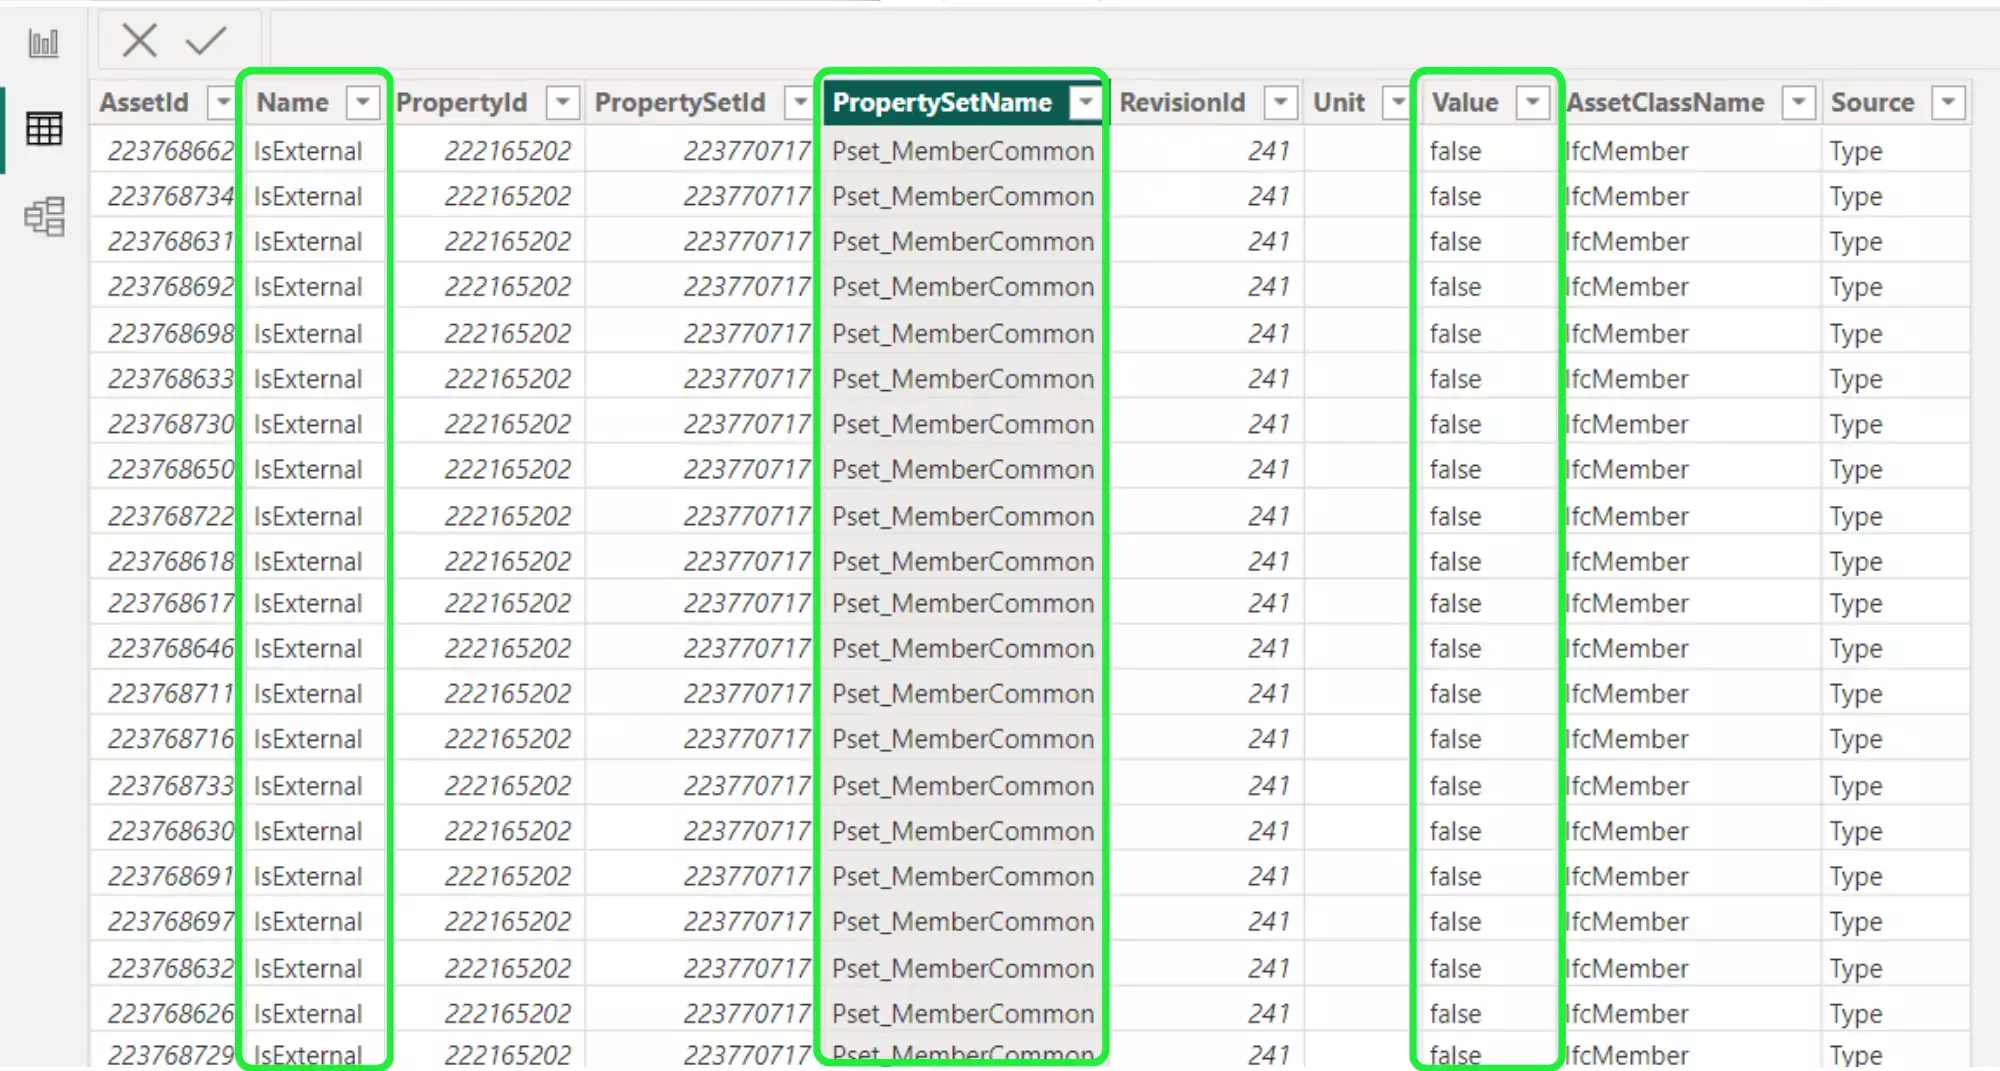
If you click on the drop down arrow on “PropertySetName” then you can explore the data further.
Now we will start building our “Card” visual. Click on “Report View” to go back to the dashboard.
Go to the ‘Visualisations’ pane on the right and under ‘Build Visual’, click on the ‘Card’ visual to add it to our dashboard.
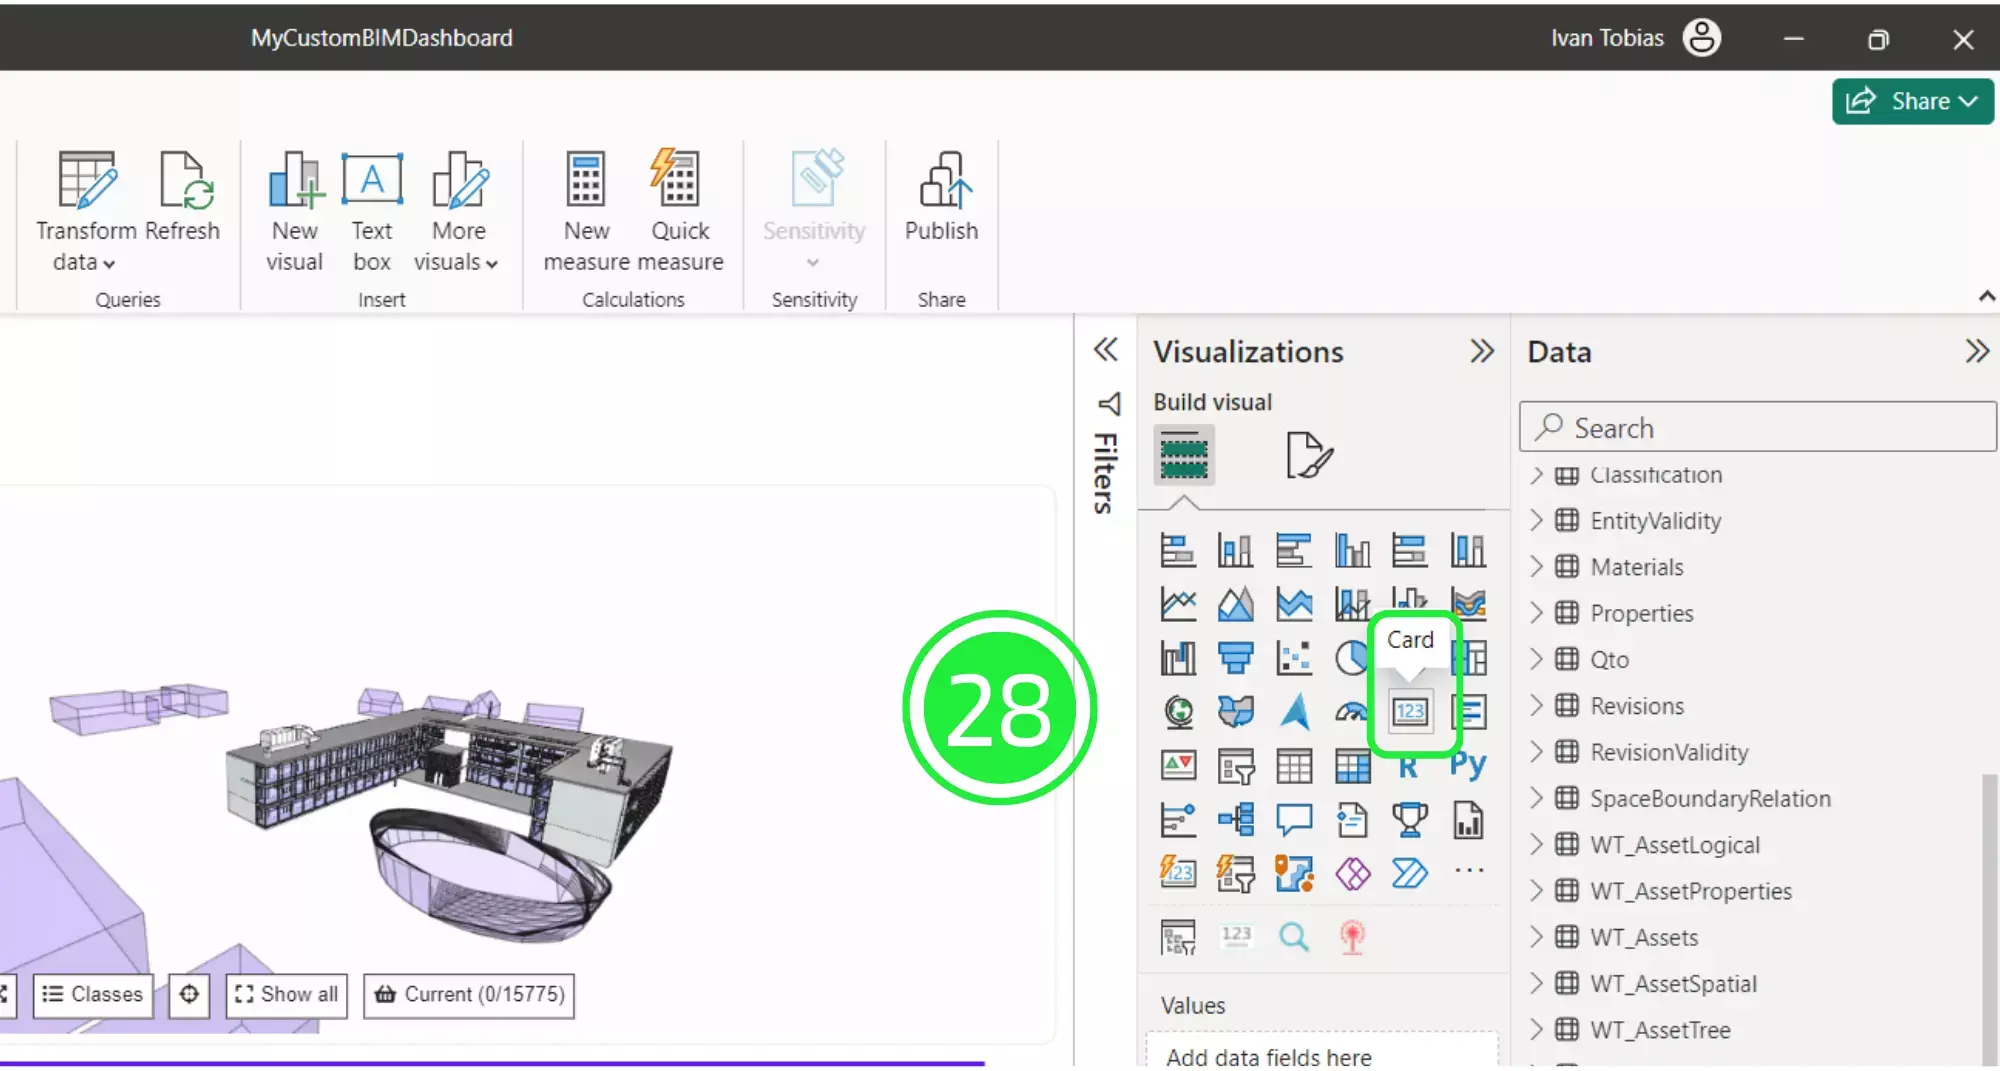
Position and resize your visual so that it doesn’t obstruct the 3D BIM Viewer and it sits neatly underneath any other visuals you have on your dashboard.
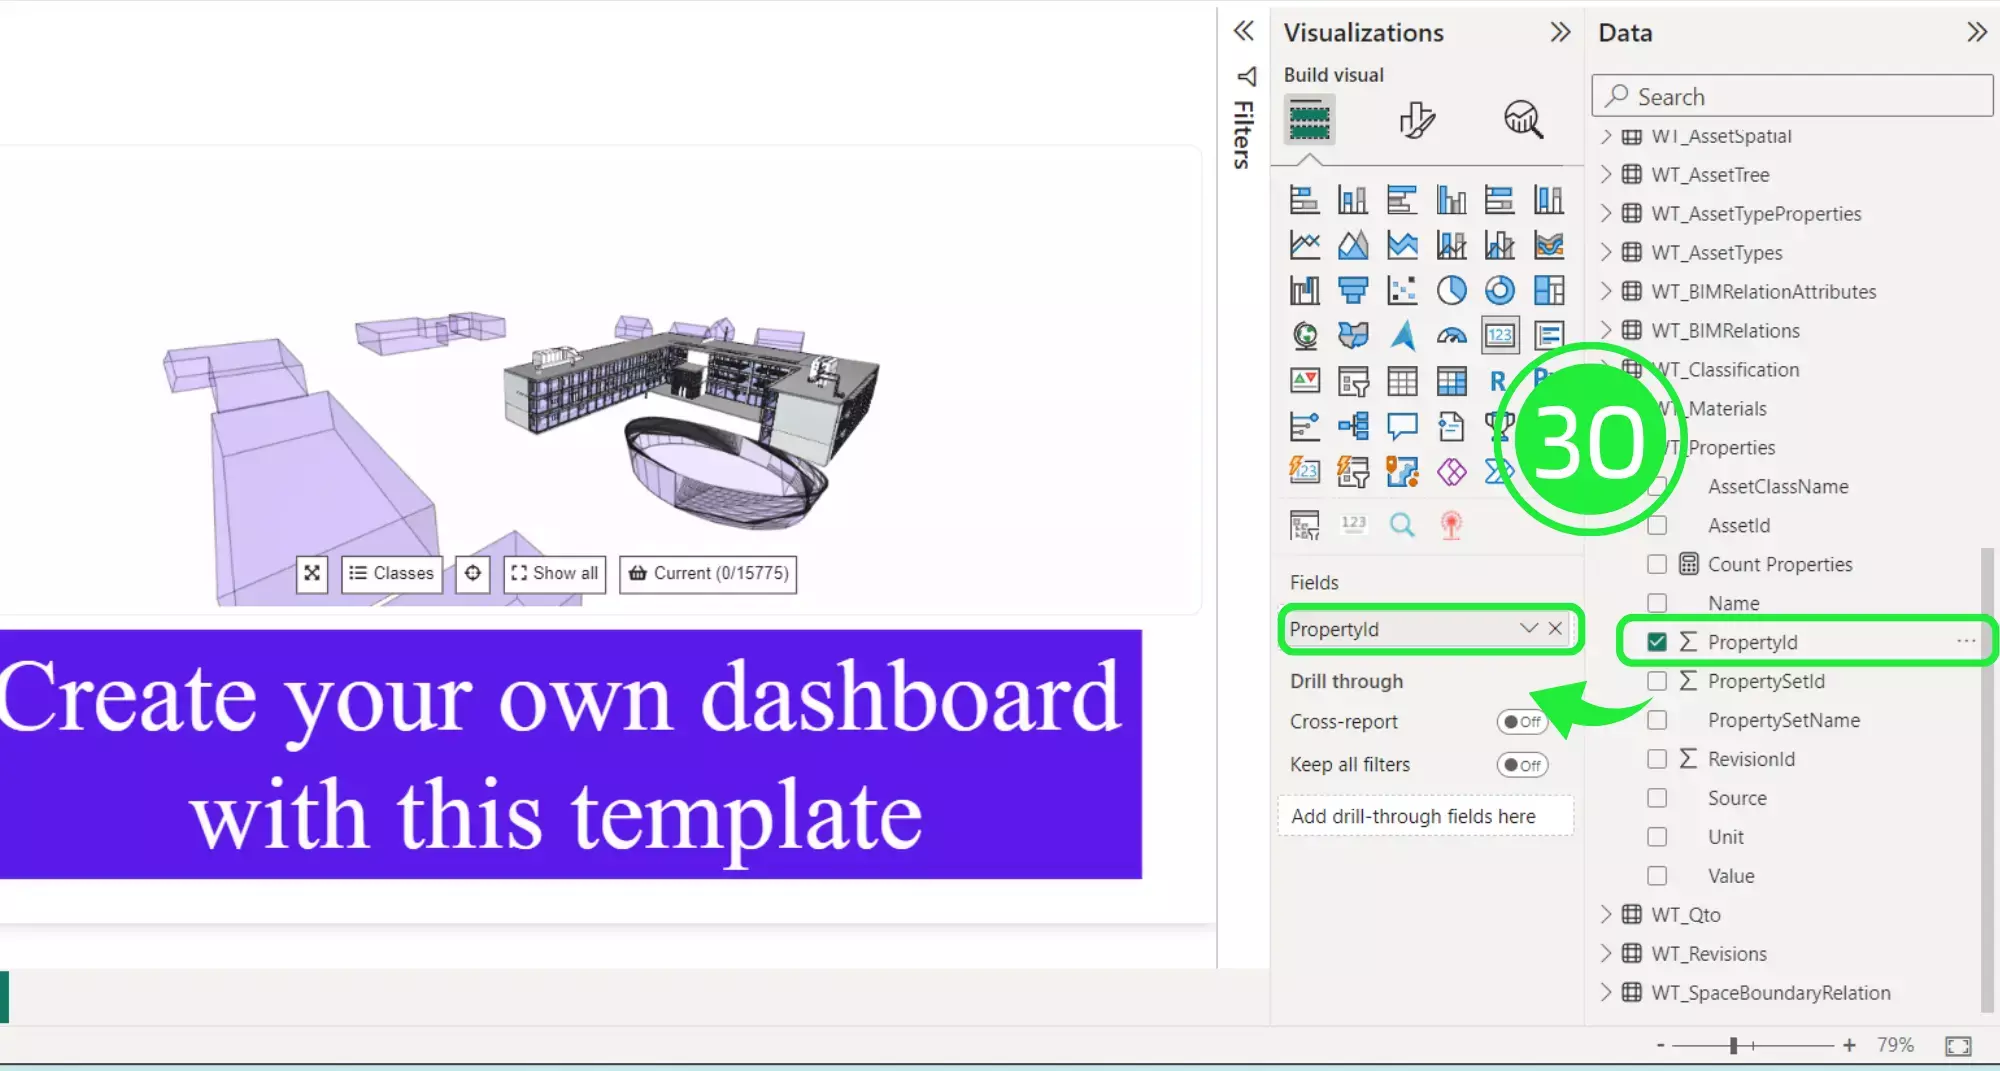
Under the “Data” pane, click on the drop down button on “WT_Properties” to expand the menu. Then drag and drop “Property ID” into the “Field” box to populate the Card visual with the data.
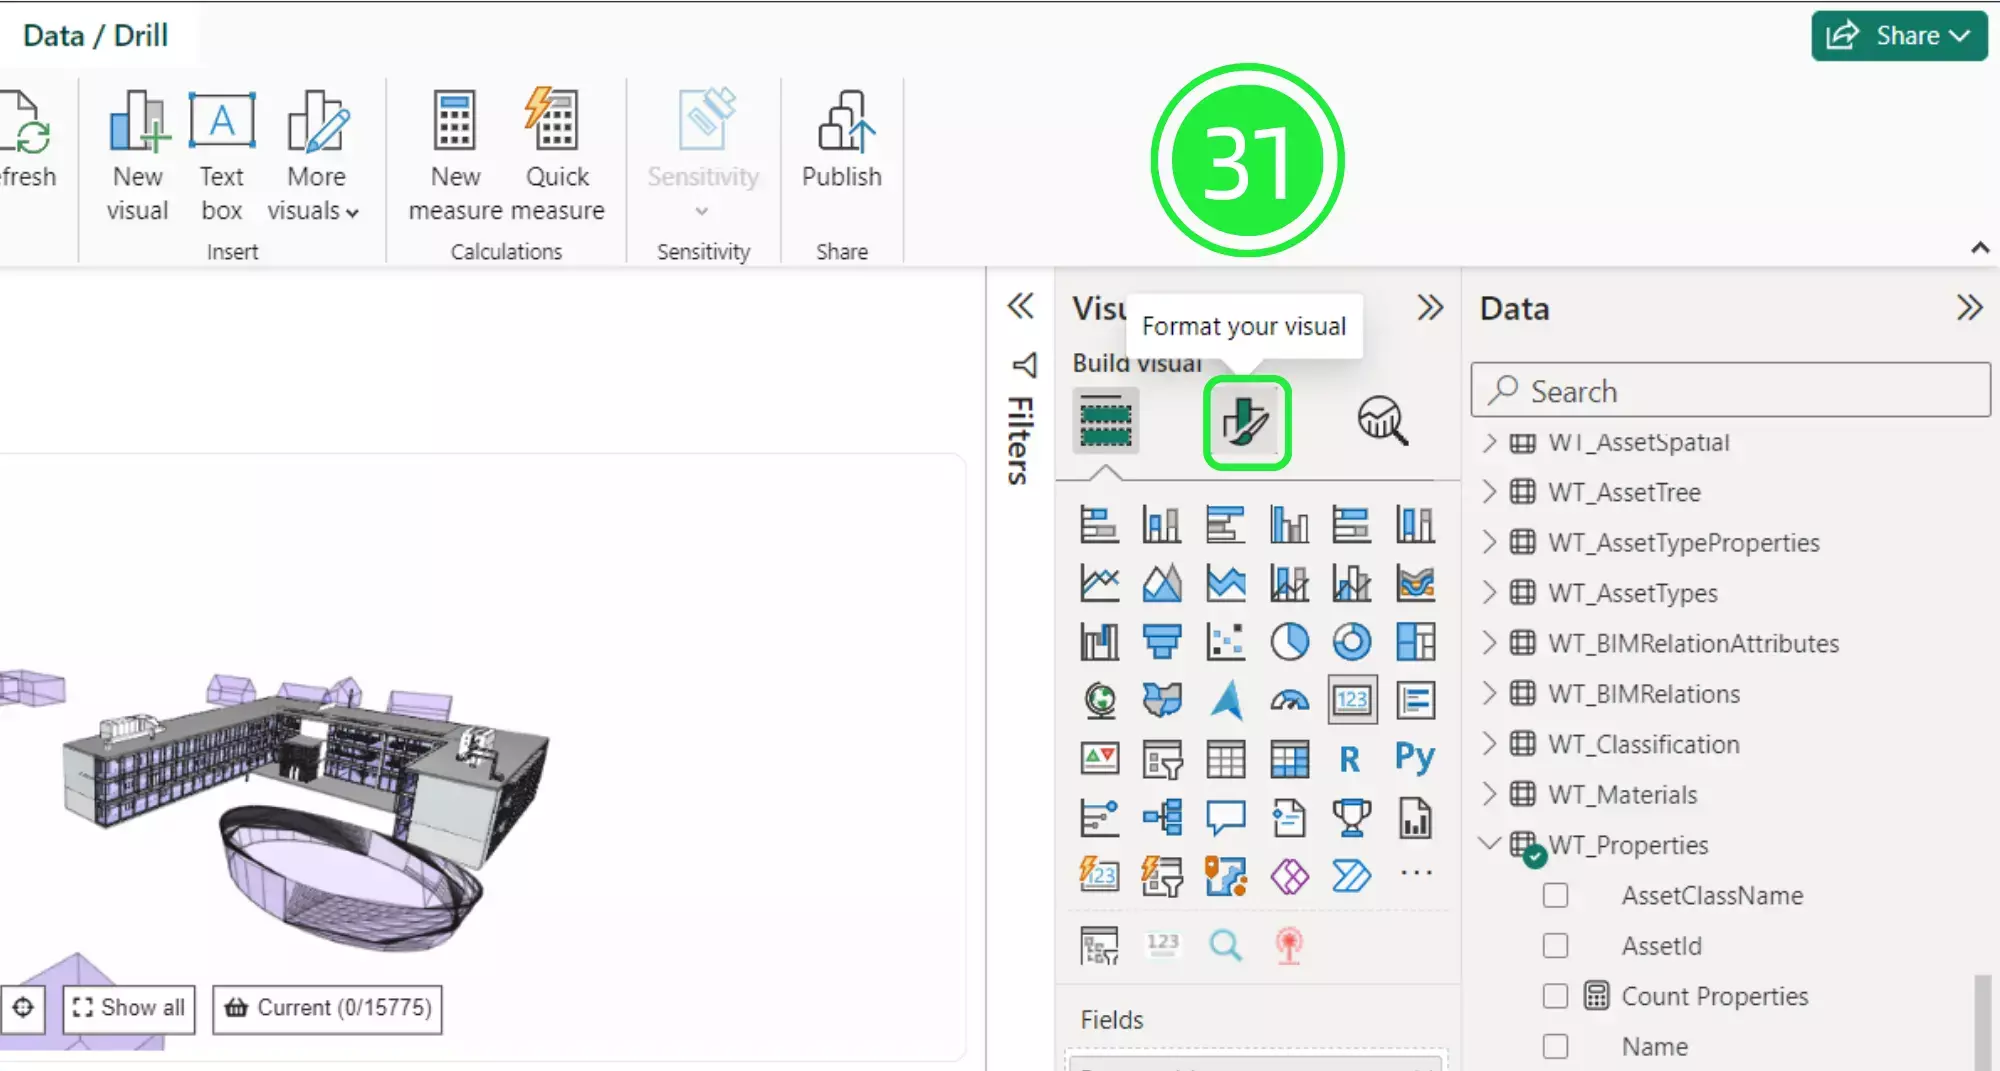
Click on “Format Your Visual” on the “Visualisations” pane.
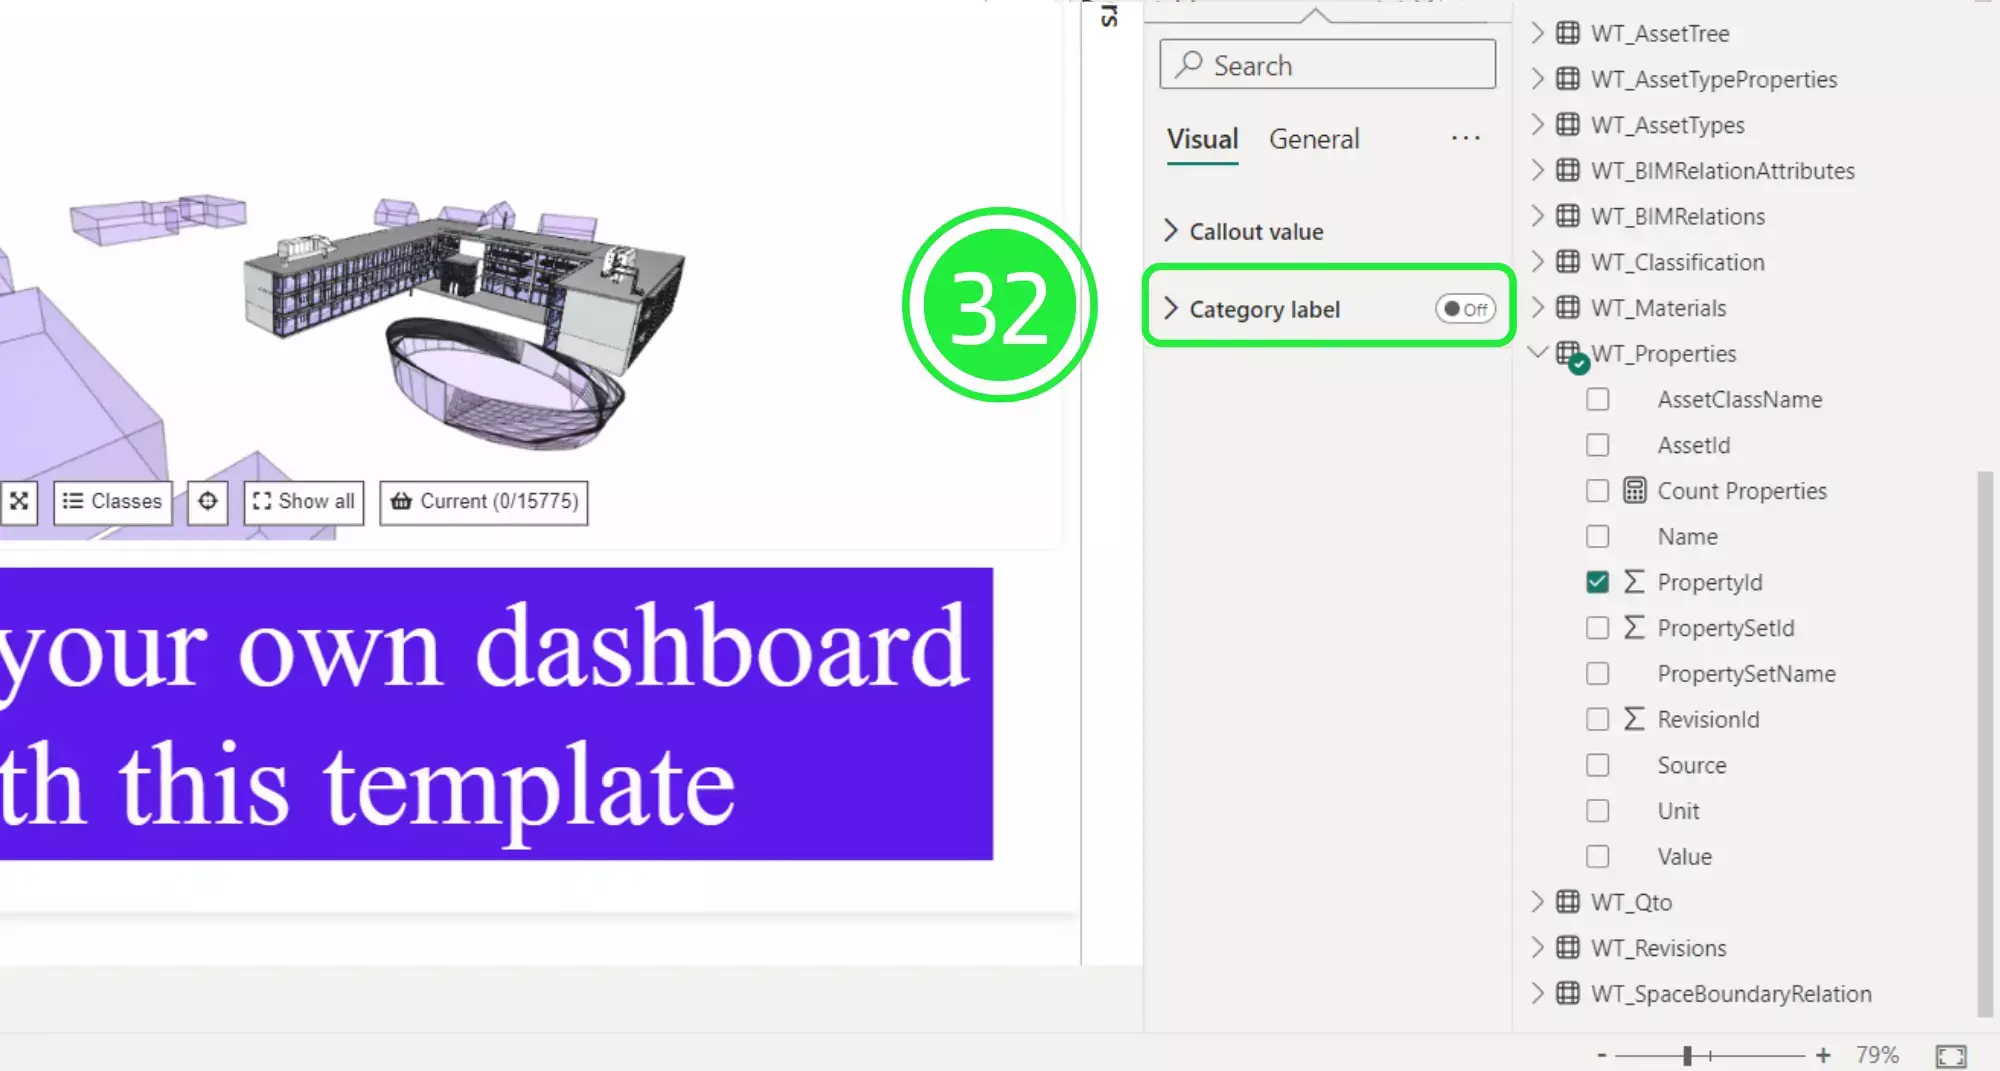
Toggle the “Category Label” to the “off” position.
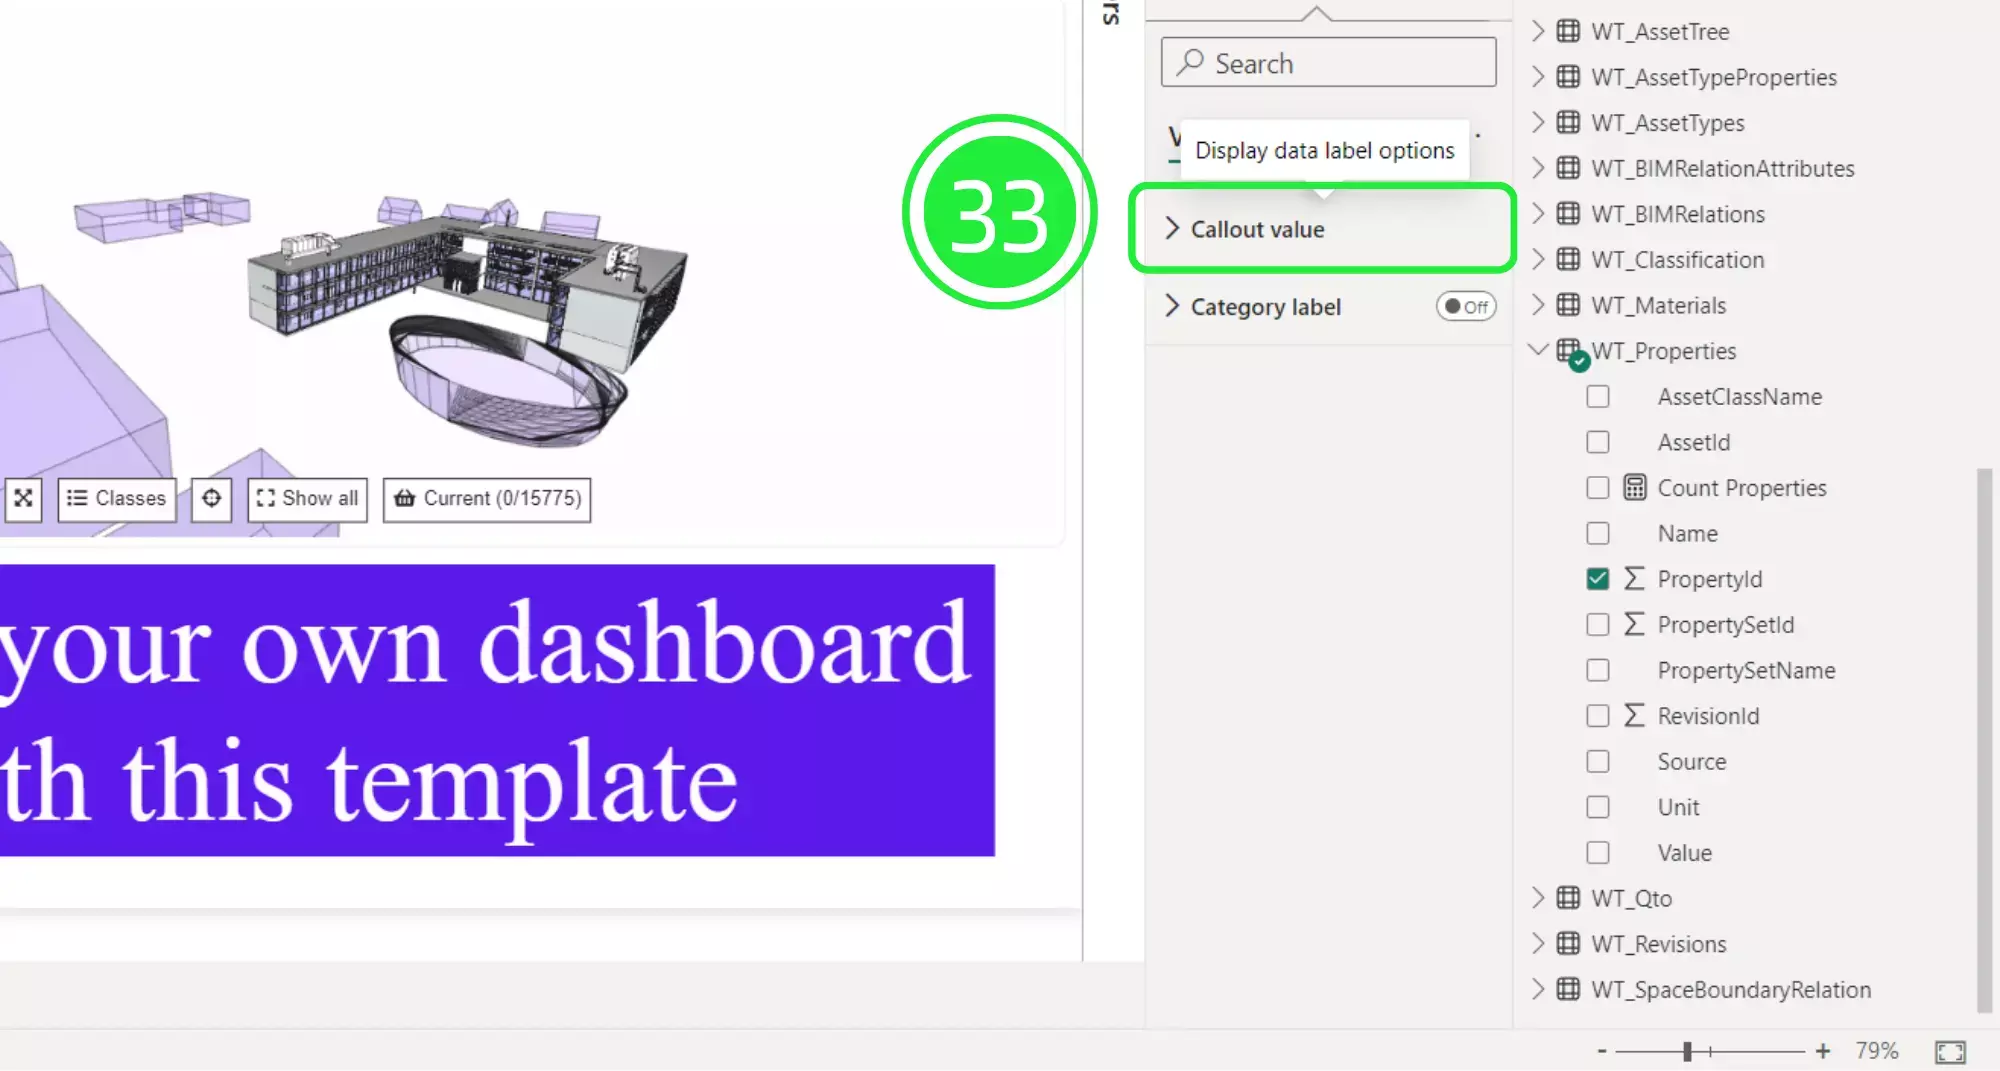
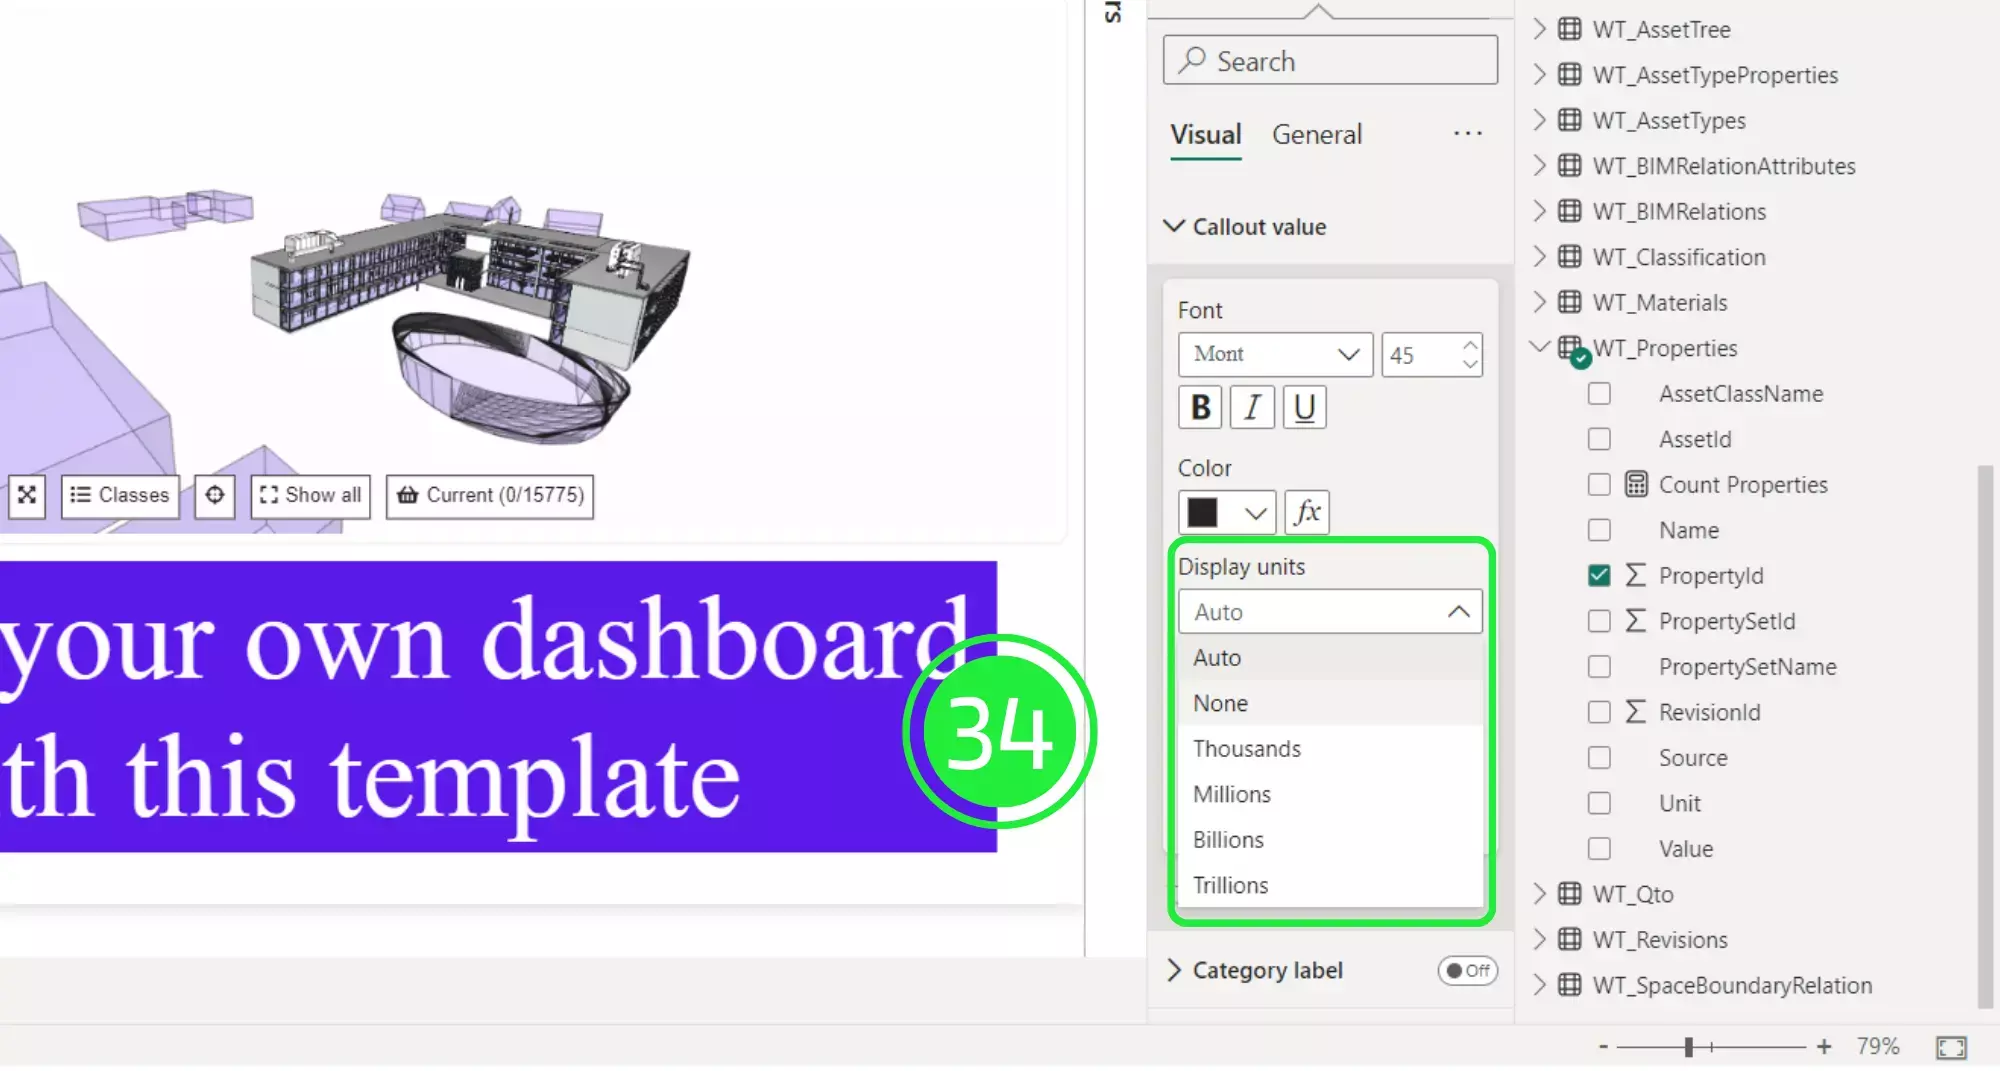
Click on the drop down menu on “Callout Value”.
Click on the dropdown menu on ‘Display Units’ and choose ‘None’ to change the units to show in full.
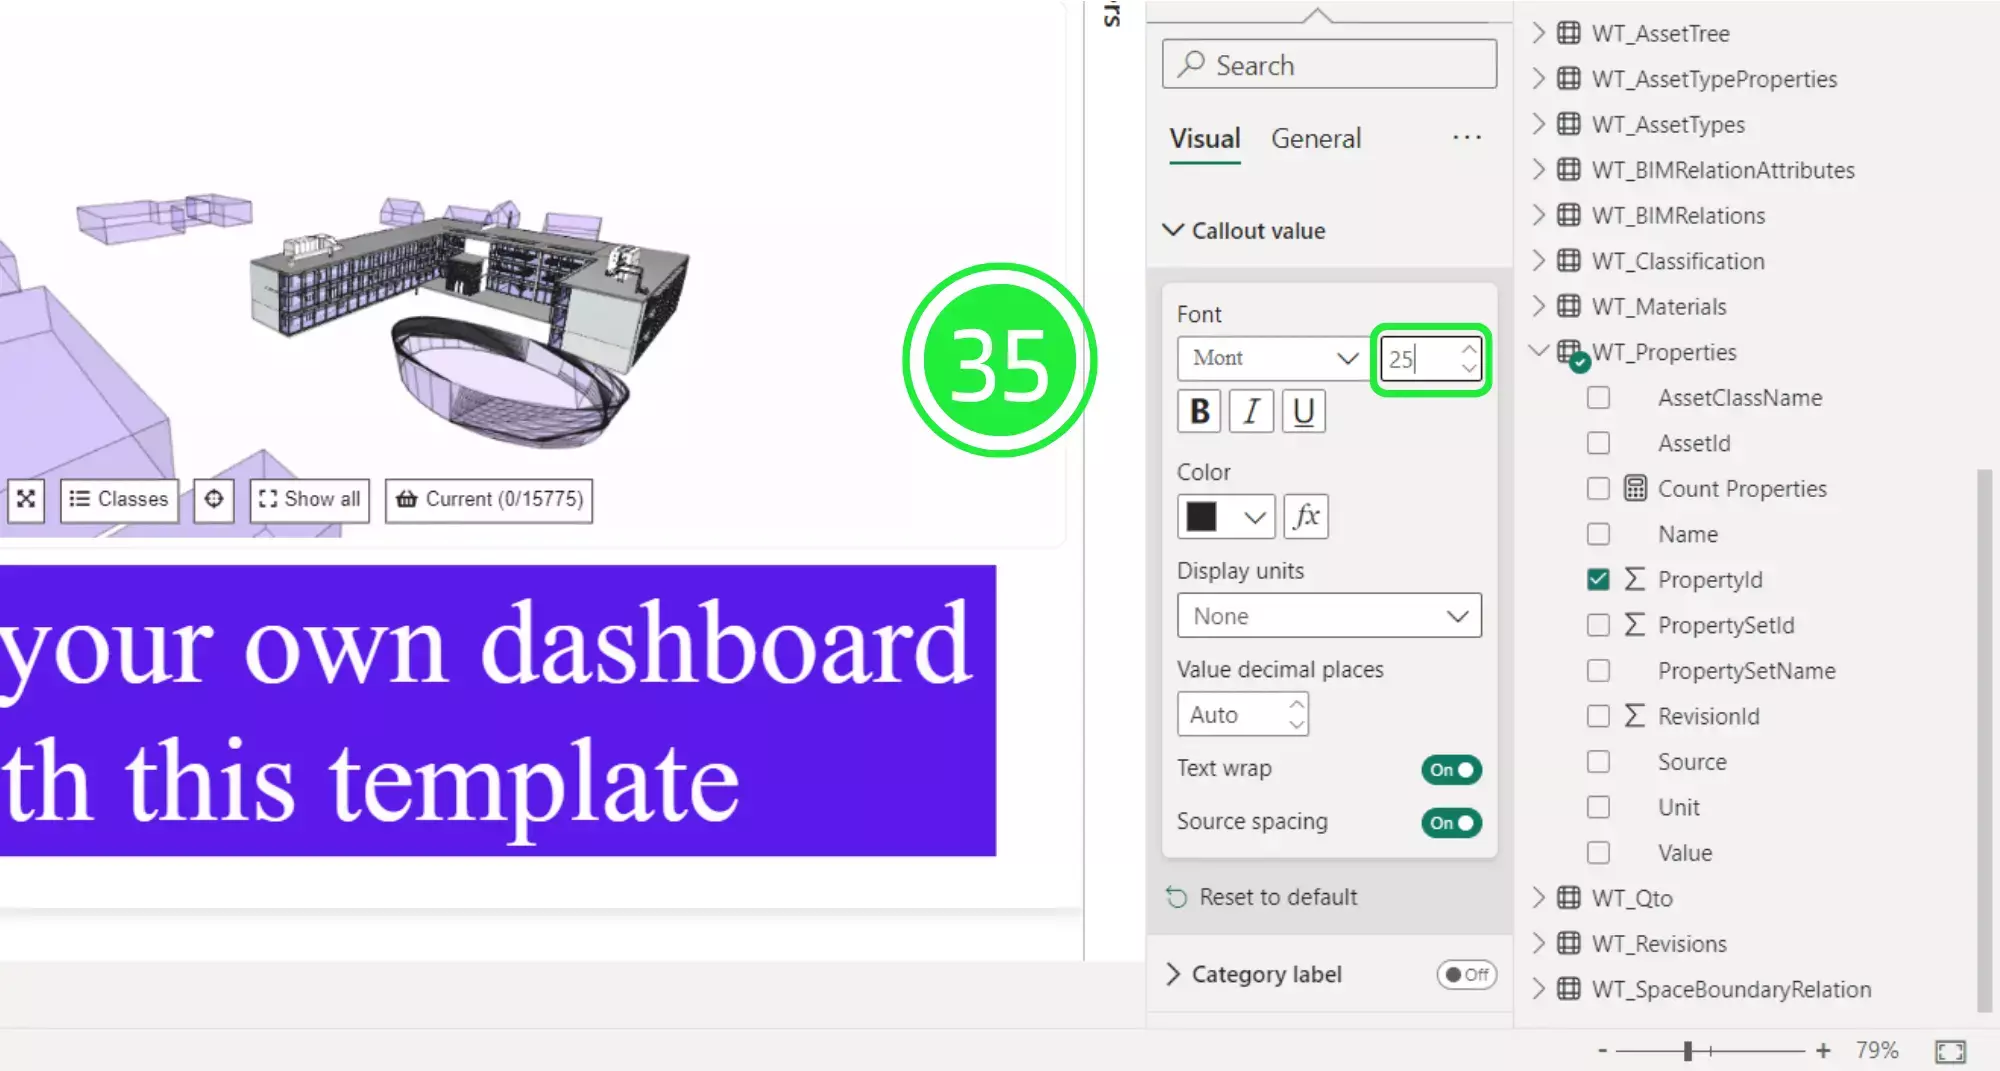
Change the font size so that the data can display correctly. You can also format your text by changing the font, style or colour.
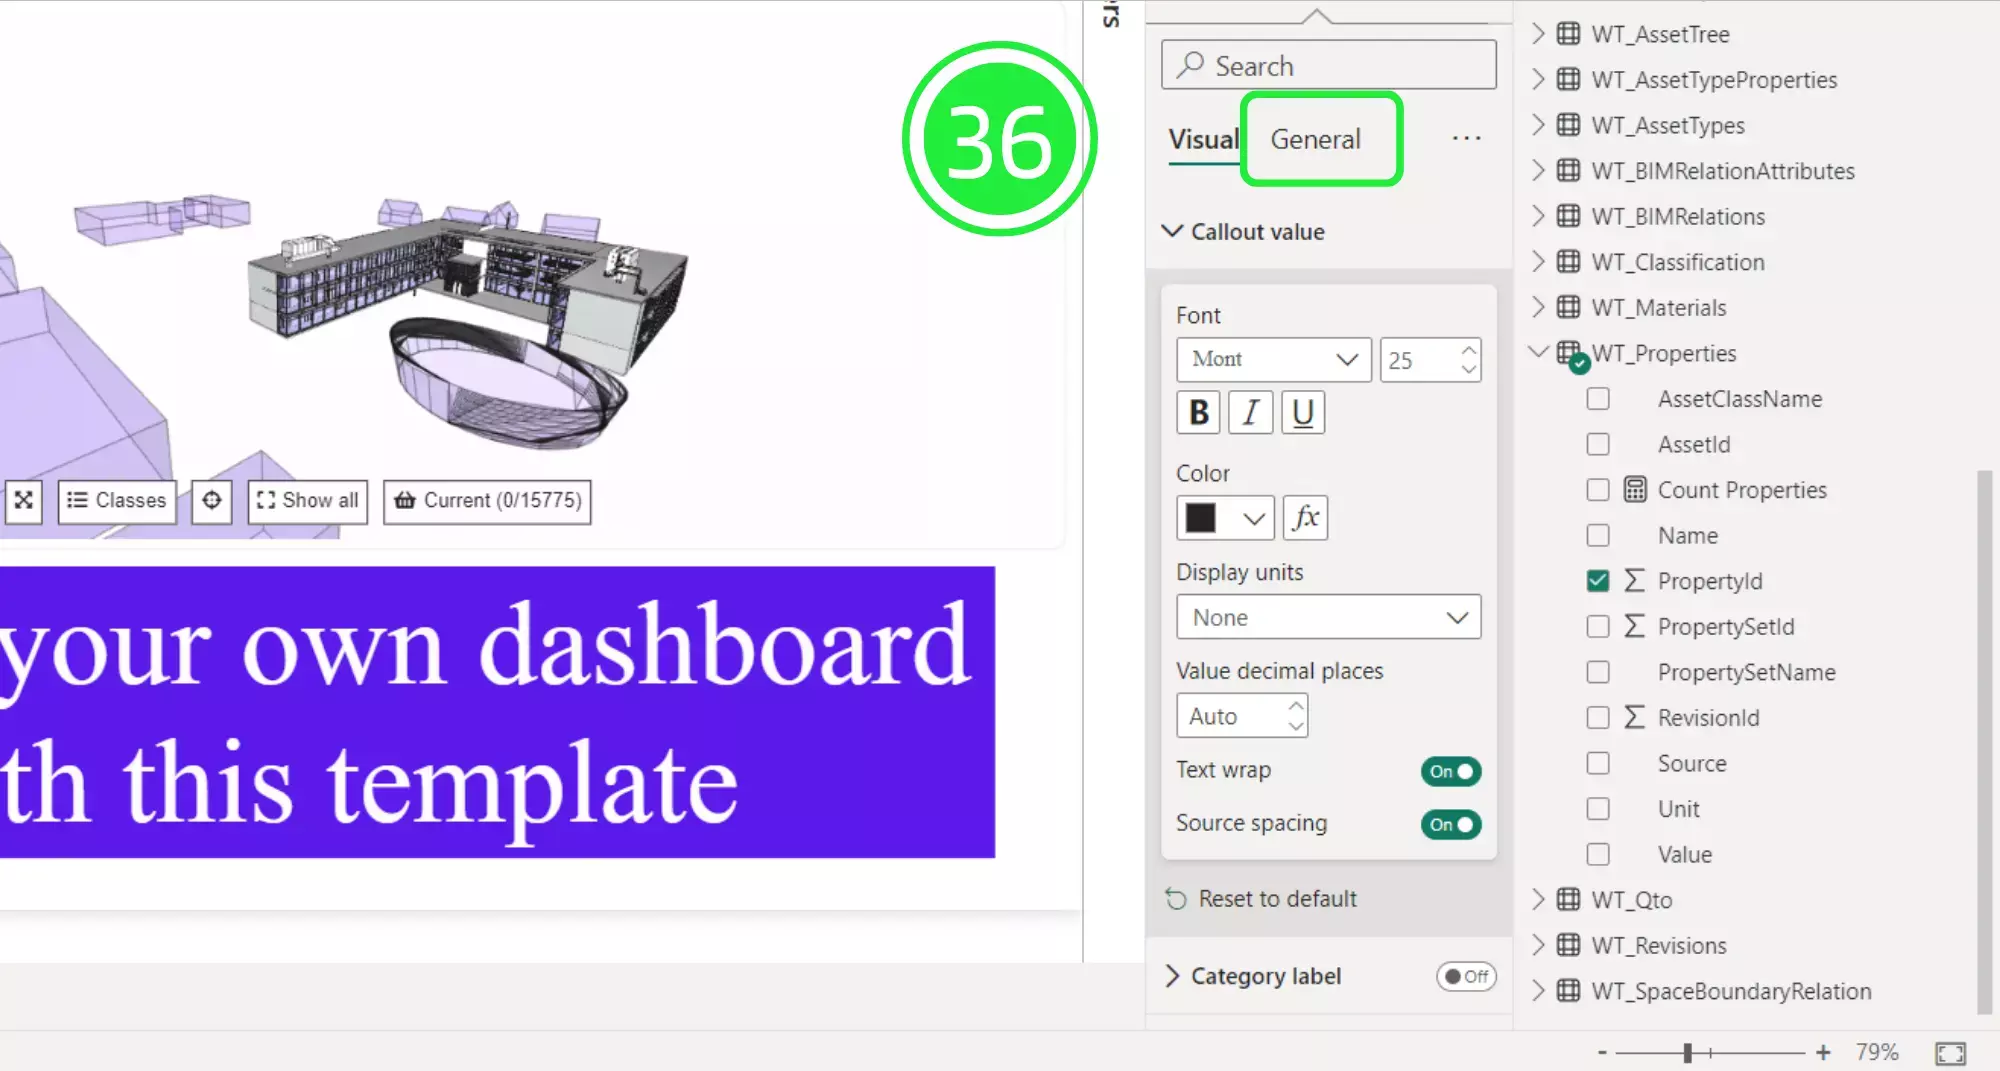
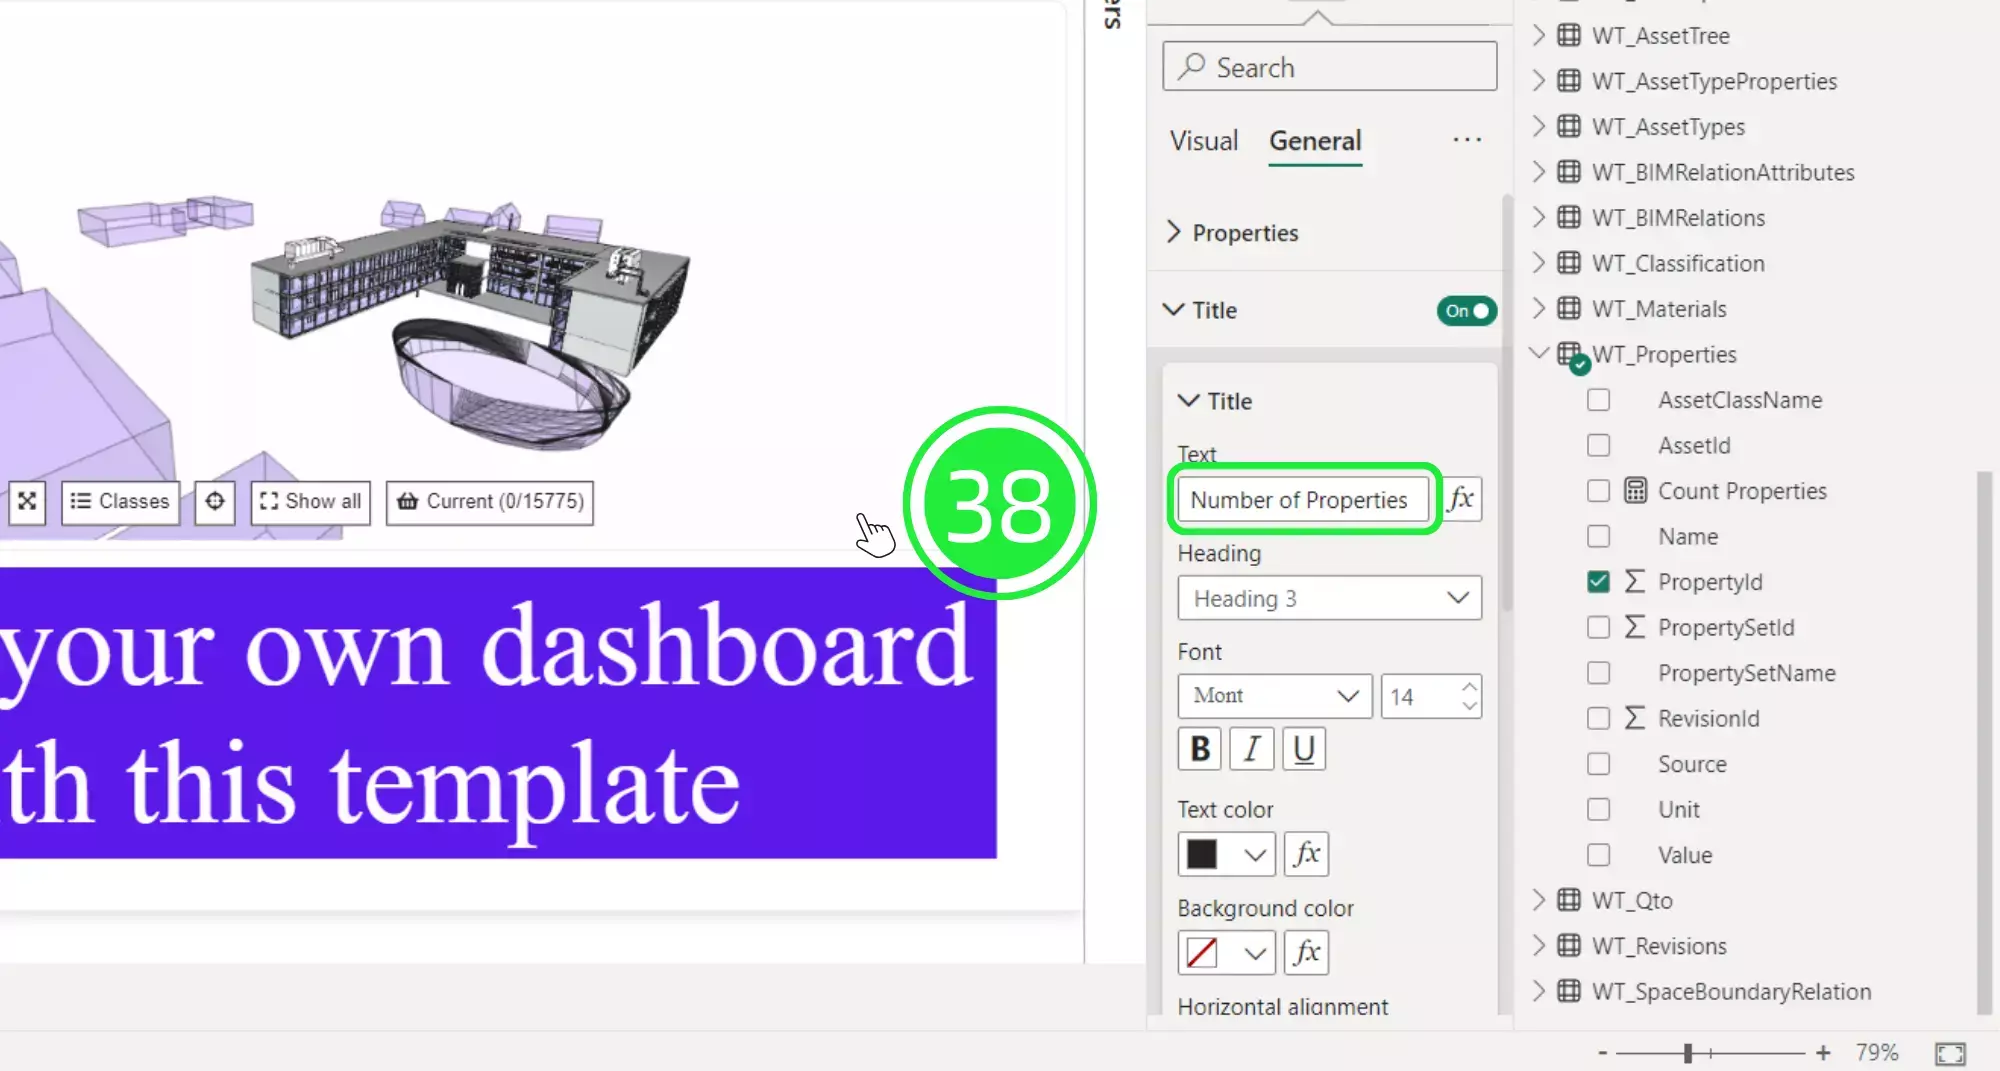
To add a title to the visual, first click on “General”.
Toggle “Title” to the “on” position. The drop down menu will automatically be shown.
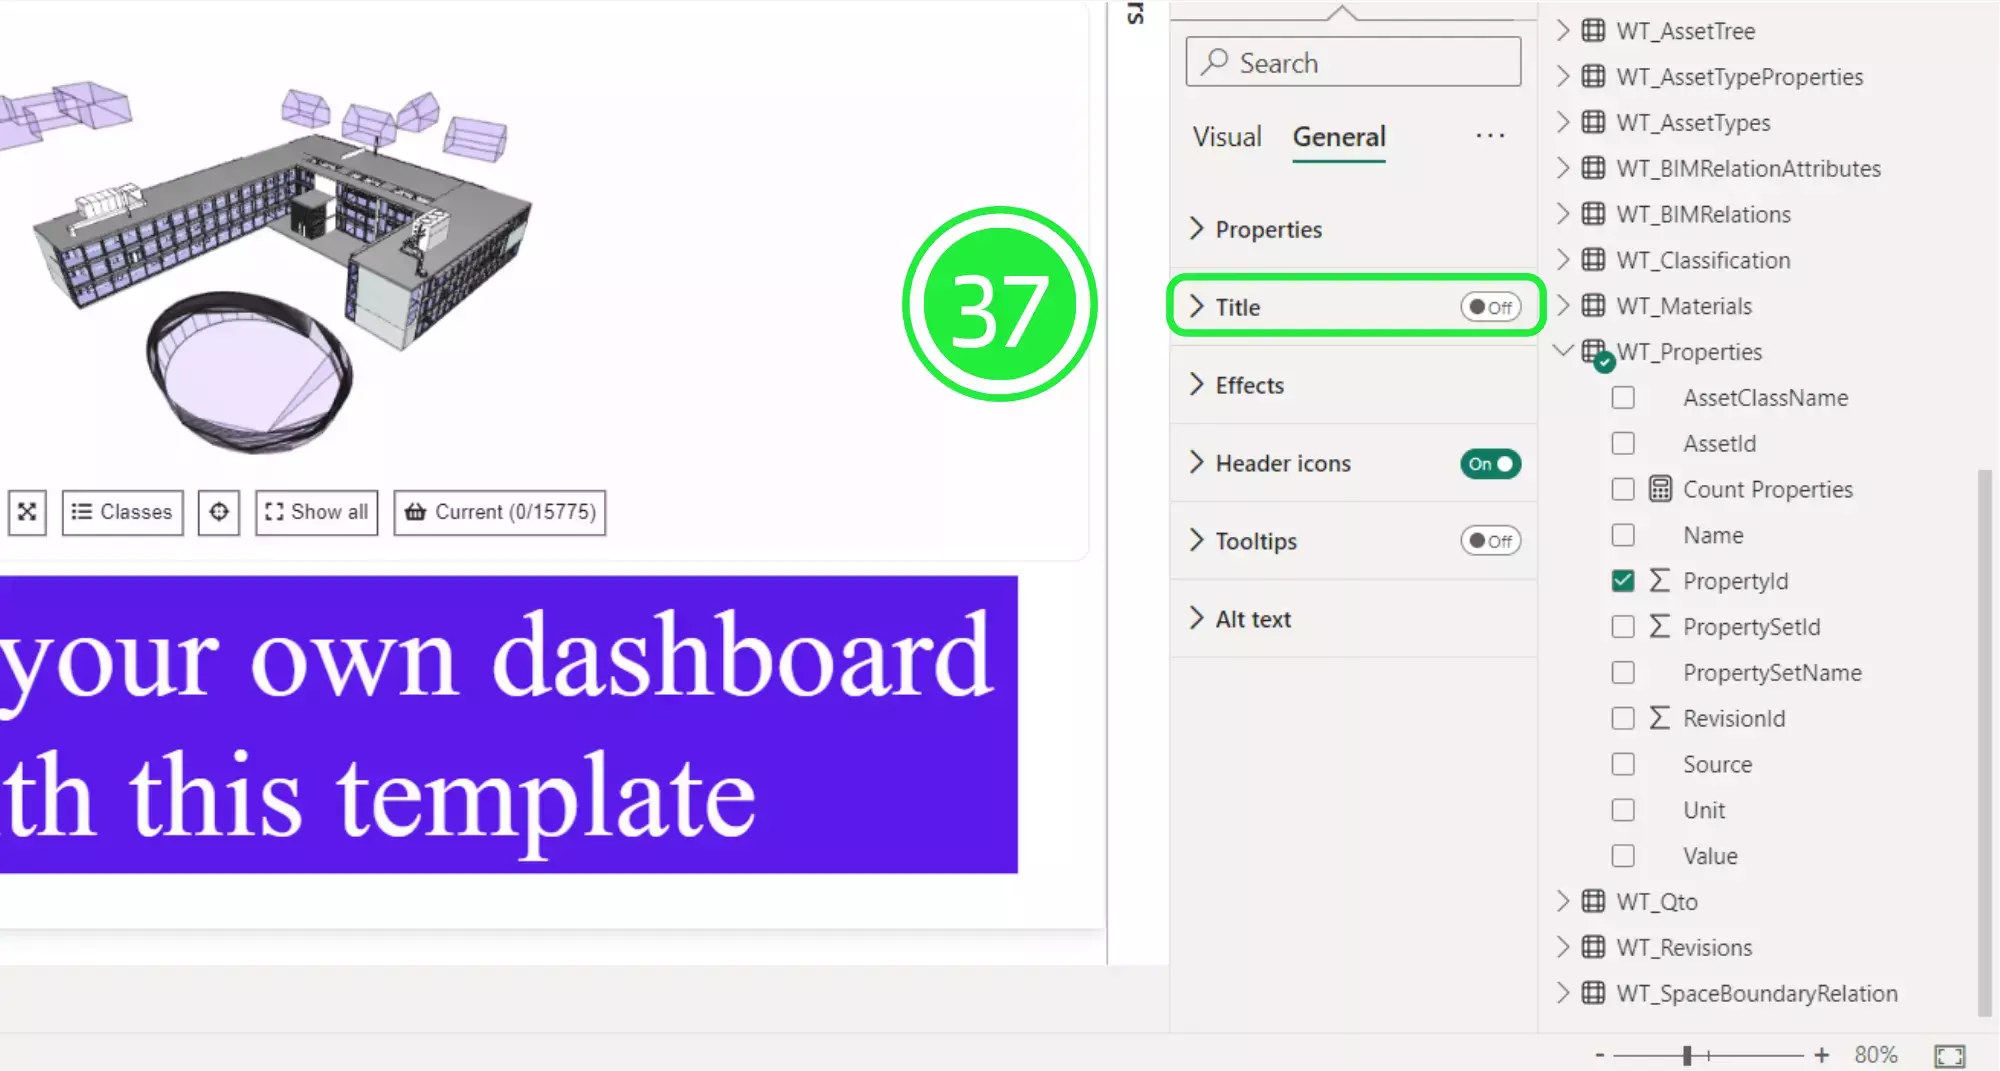
Write into the “Text” box “Number of Properties” and it’ll be immediately displayed inside the card visual.
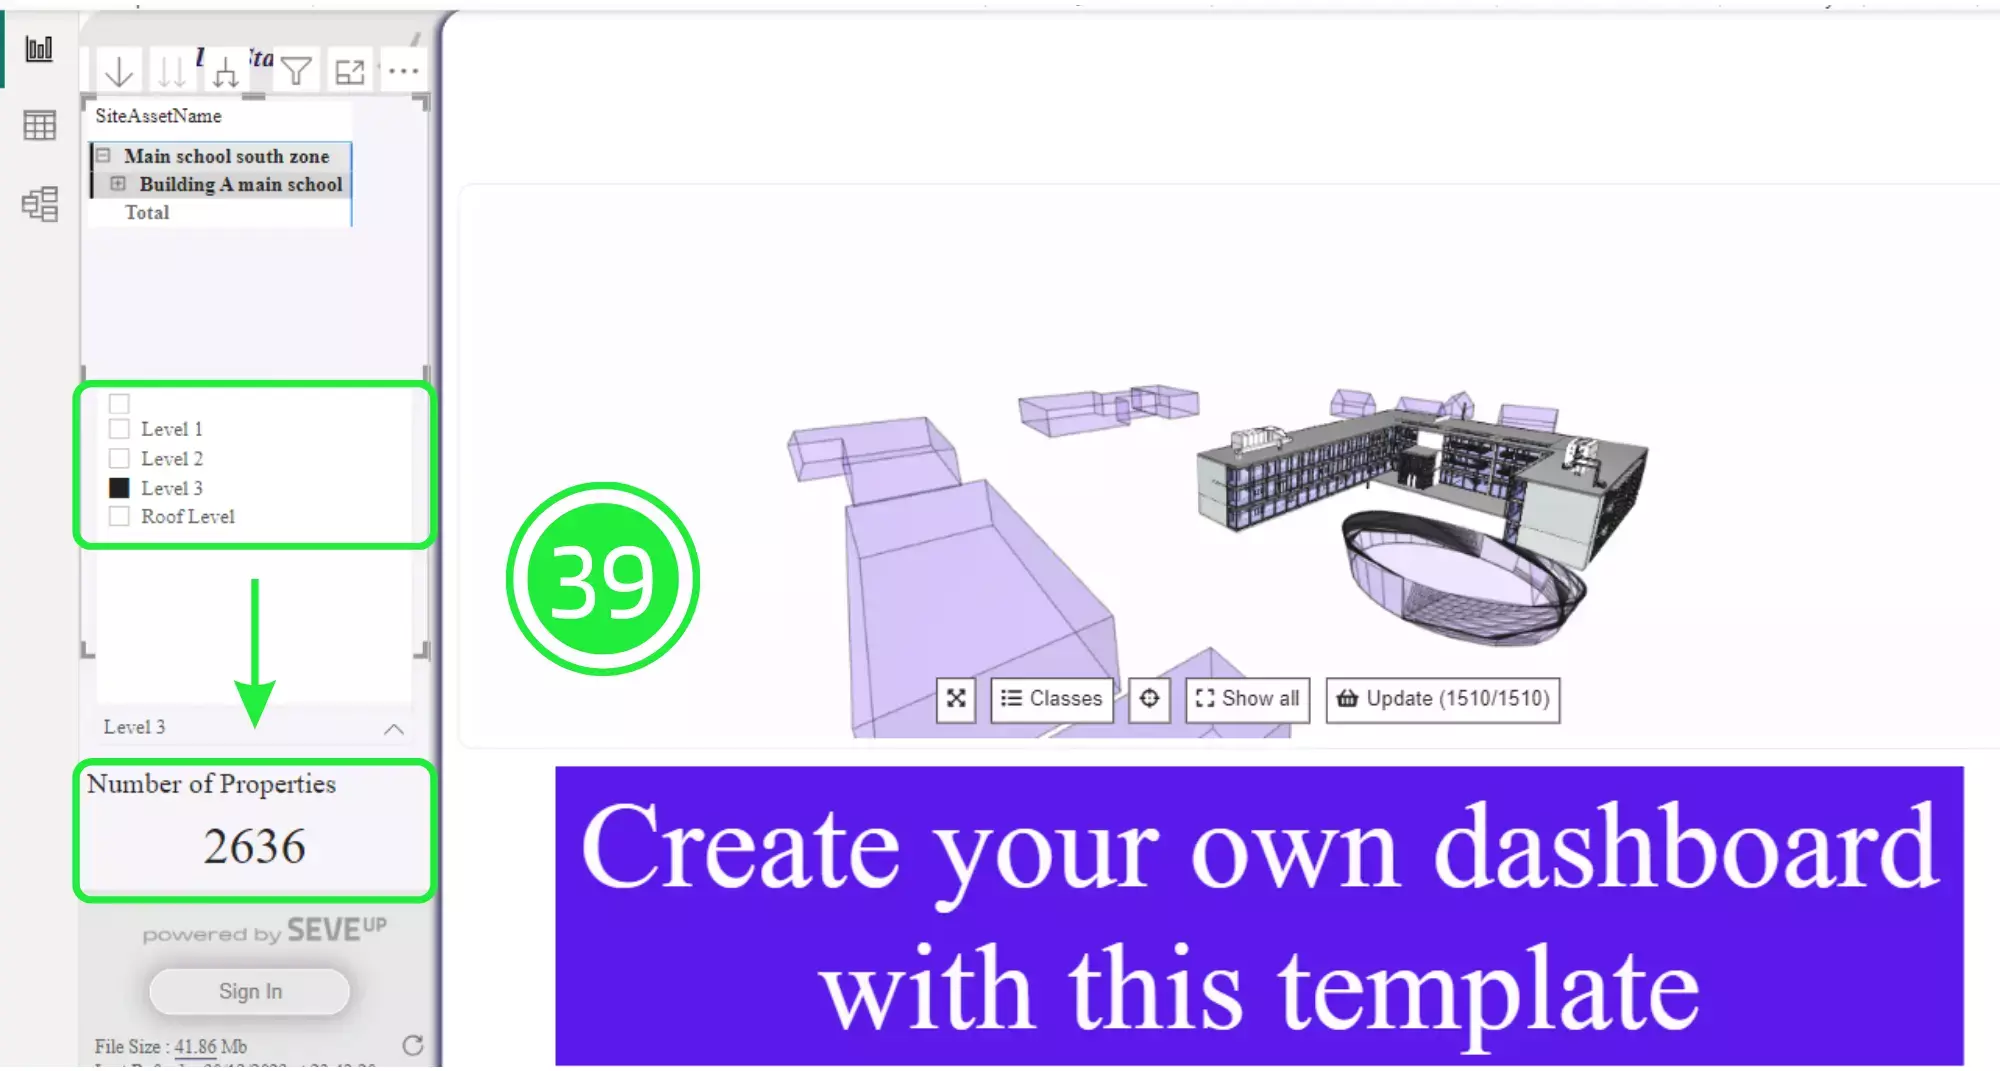
Our “Card” visual is now finished and ready to be used to quickly display the number of assets in our BIM model. As an example, select level 3 in the “Slicer” visual above then the total number of properties for that level will be displayed within our new Card visual. You’re ready now to count BIM properties with Power BI in 1 min
Before uploading the Power BI custom template back into the SeveUp app, it needs to be saved as a template file with the extension .PBIT. To do this click on ‘File’ in the top left corner. You progress: you could be proud because you know how to count your BIM properties with Power BI
Select “Save As” from the drop down menu.
Click on “Browse this device” at the bottom of the screen.

Choose to save the file as a Power BI template file (.pbit).
Click on the “Save” button to save your project to your computer. Only a few steps left to count your BIM properties with Power BI in less than 60 seconds.
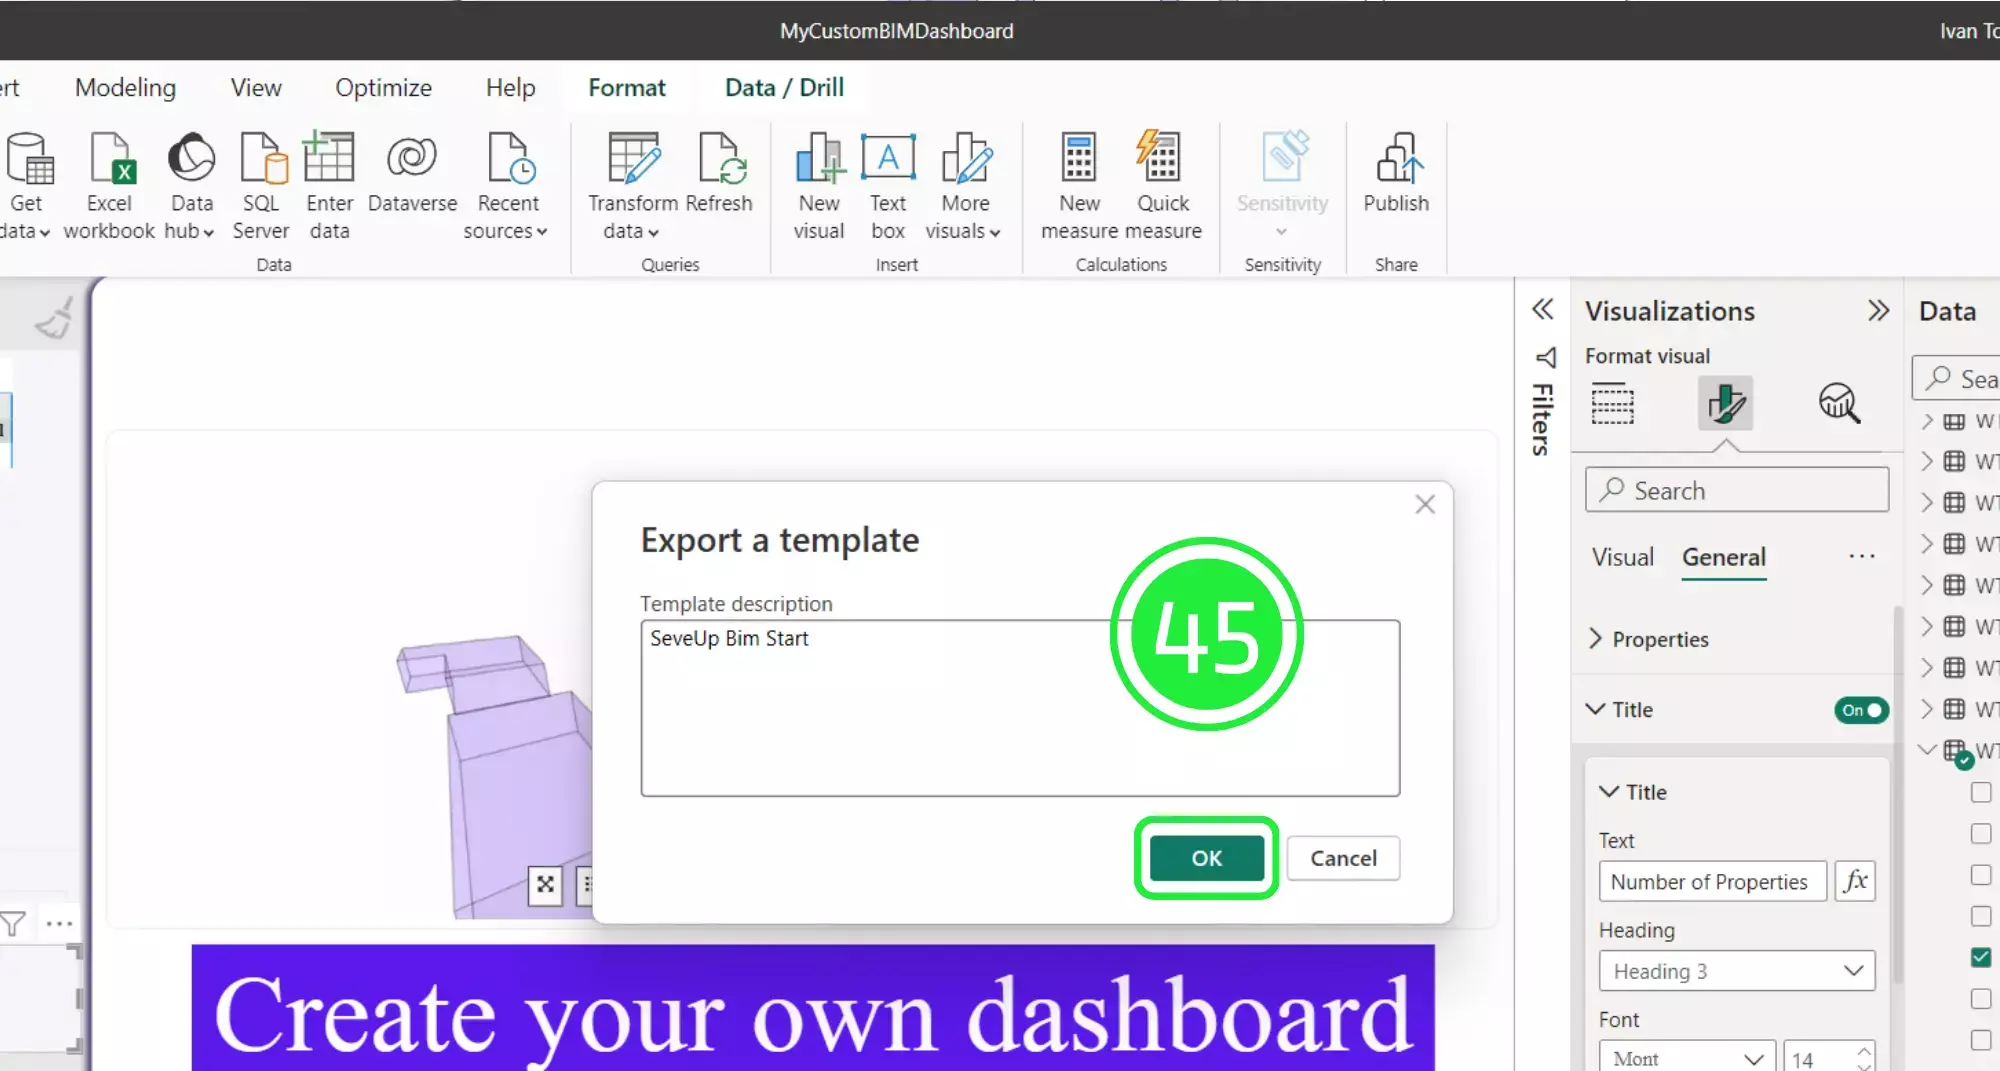
Press on “ok” when the “Export a Template” popup appears.
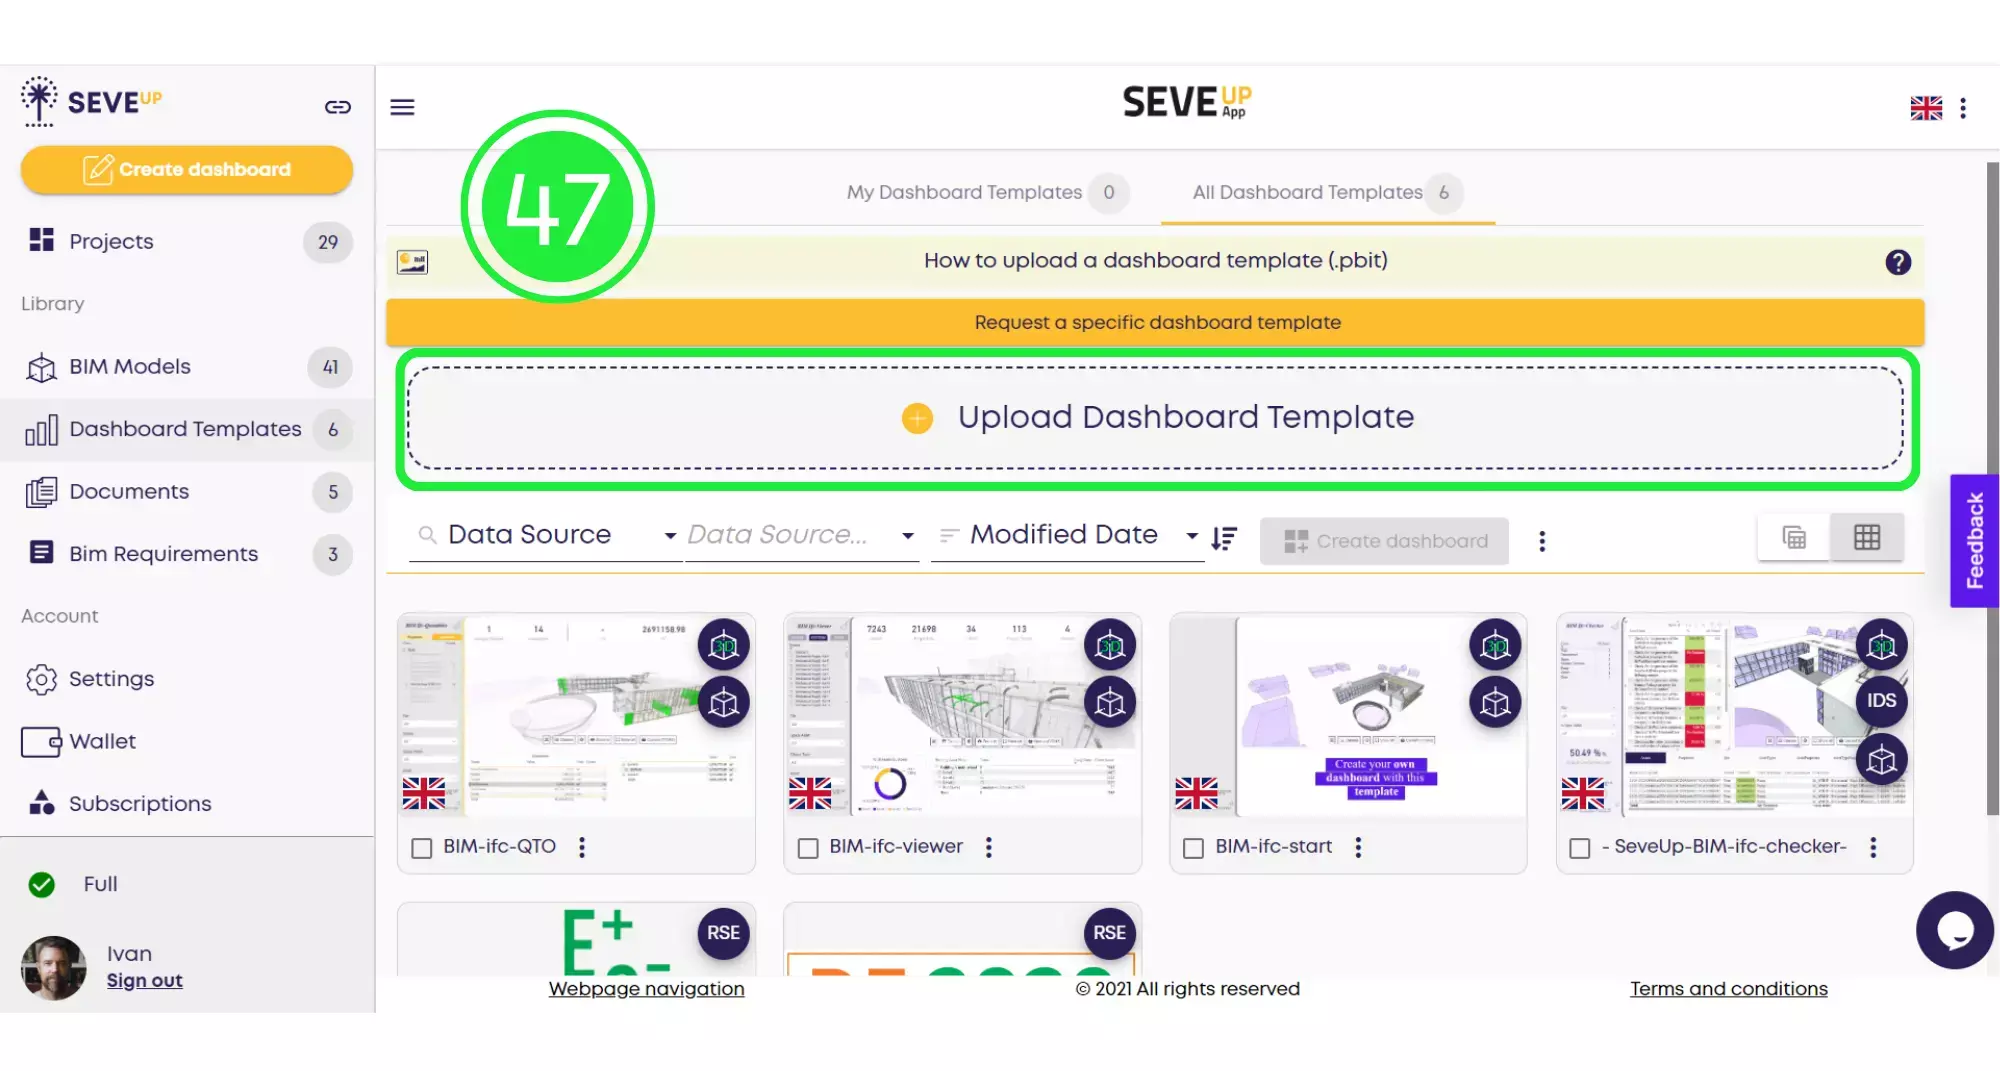
Open the SeveUp App again and click on “Dashboard Templates” on the left hand side.
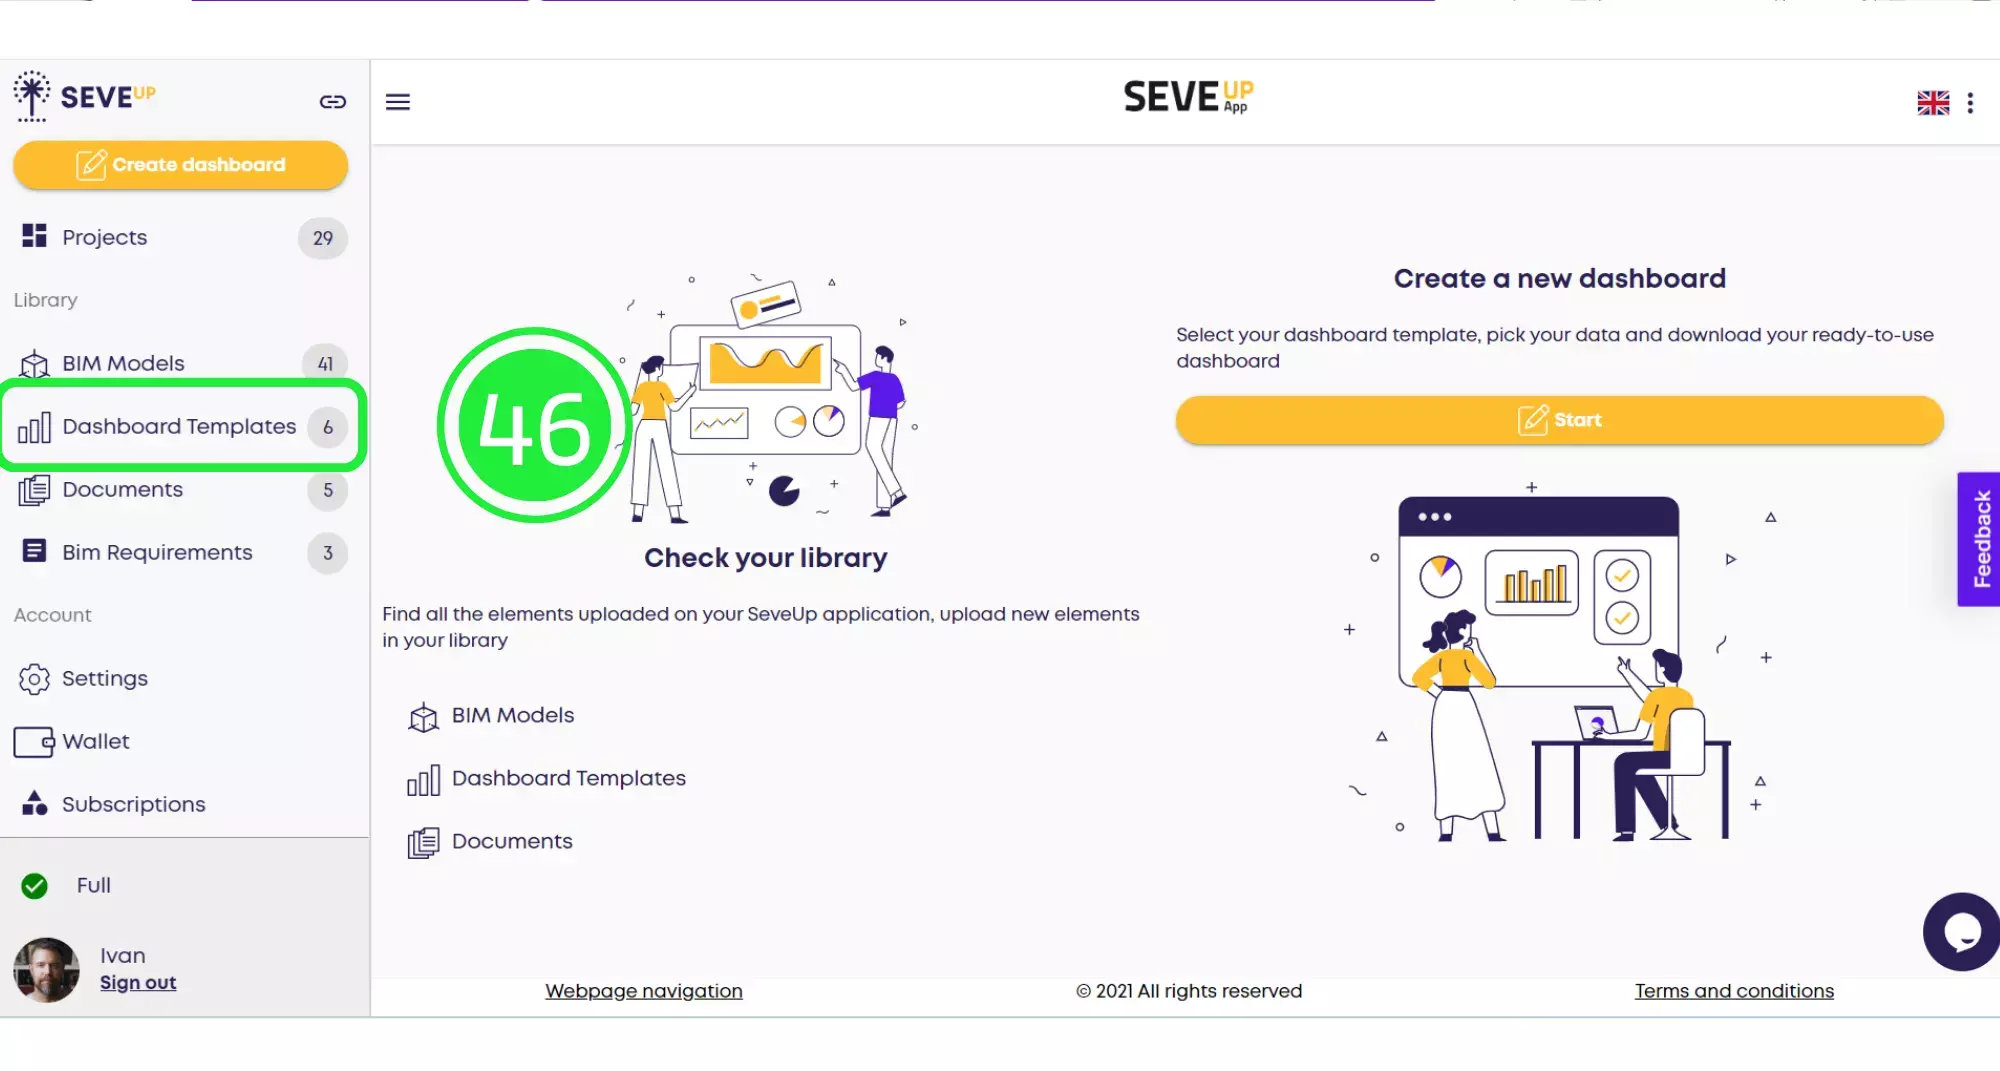
Click on the large “Upload Dashboard Template” button in the centre of the folder.
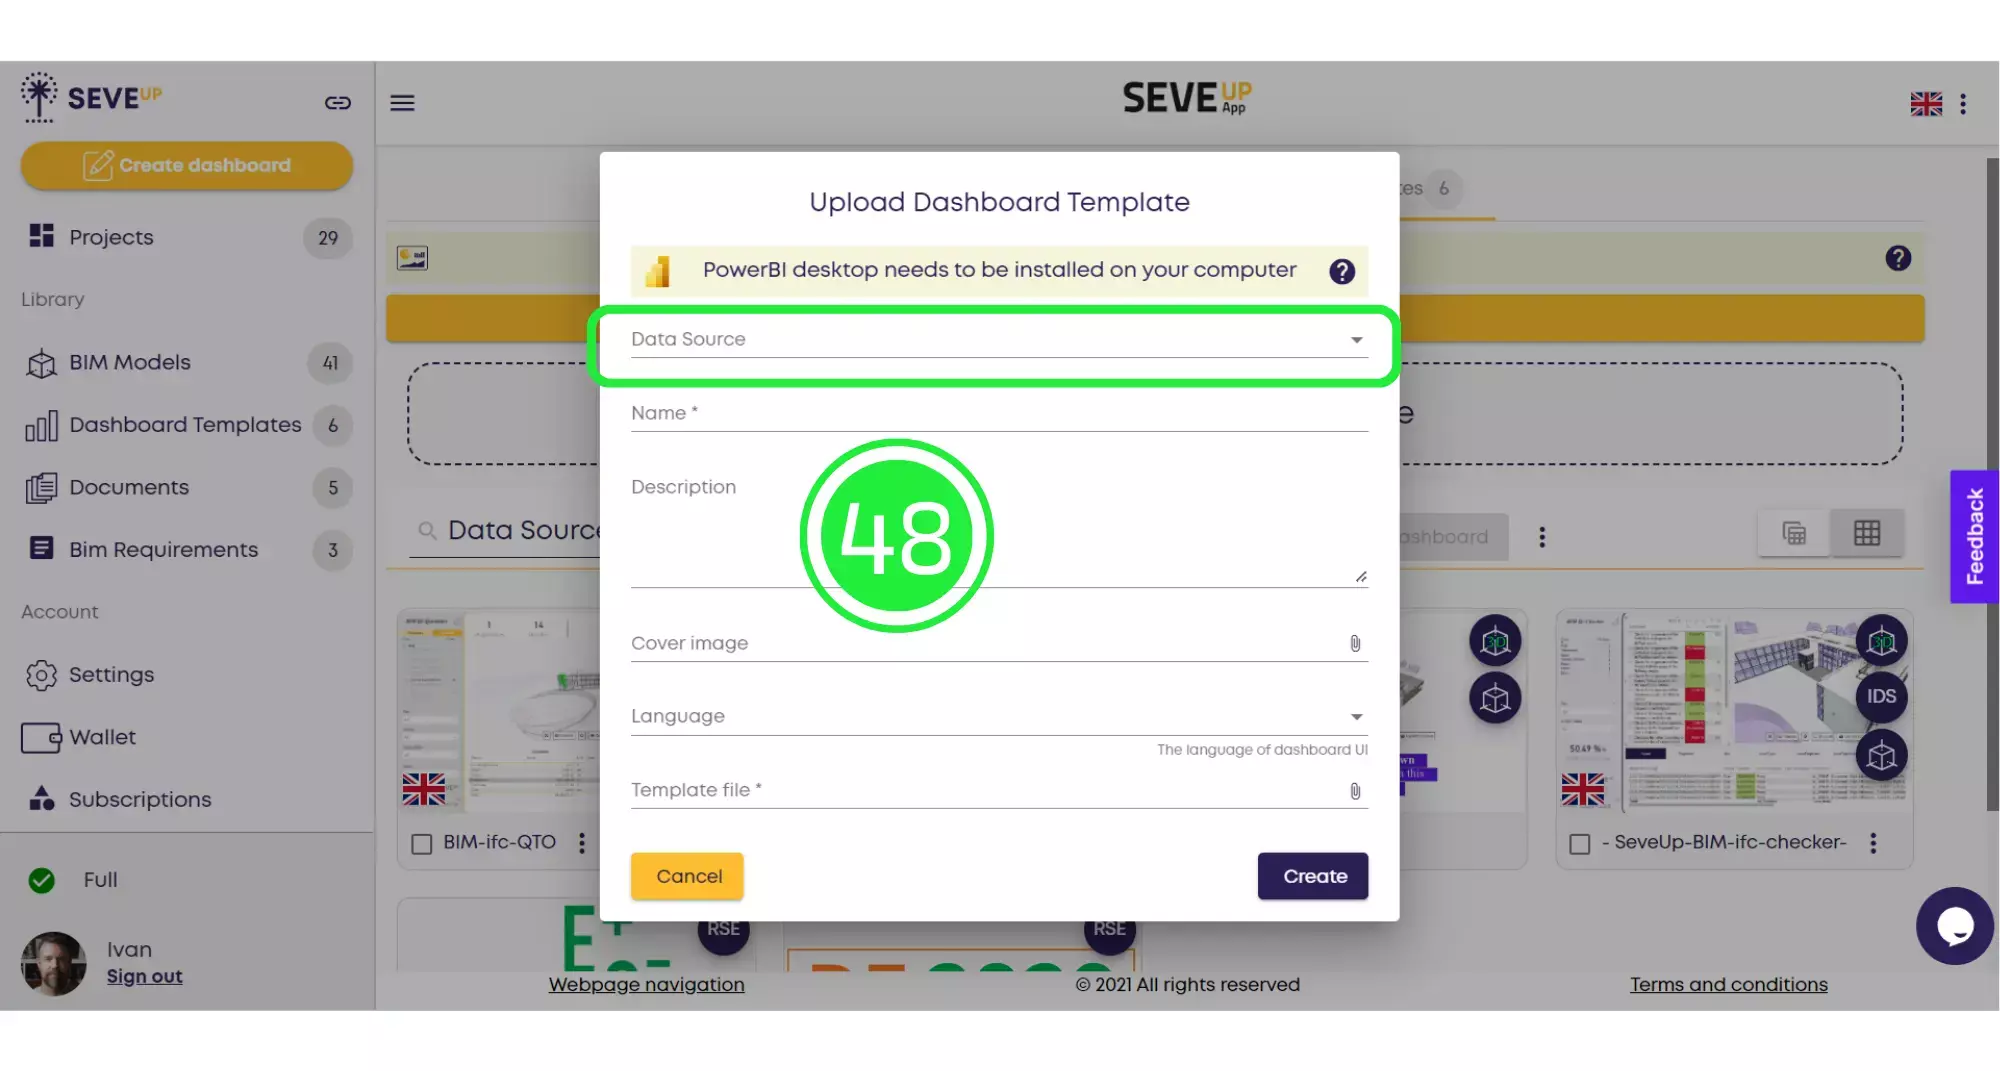
When the pop-up appears, click on “Data Source”.
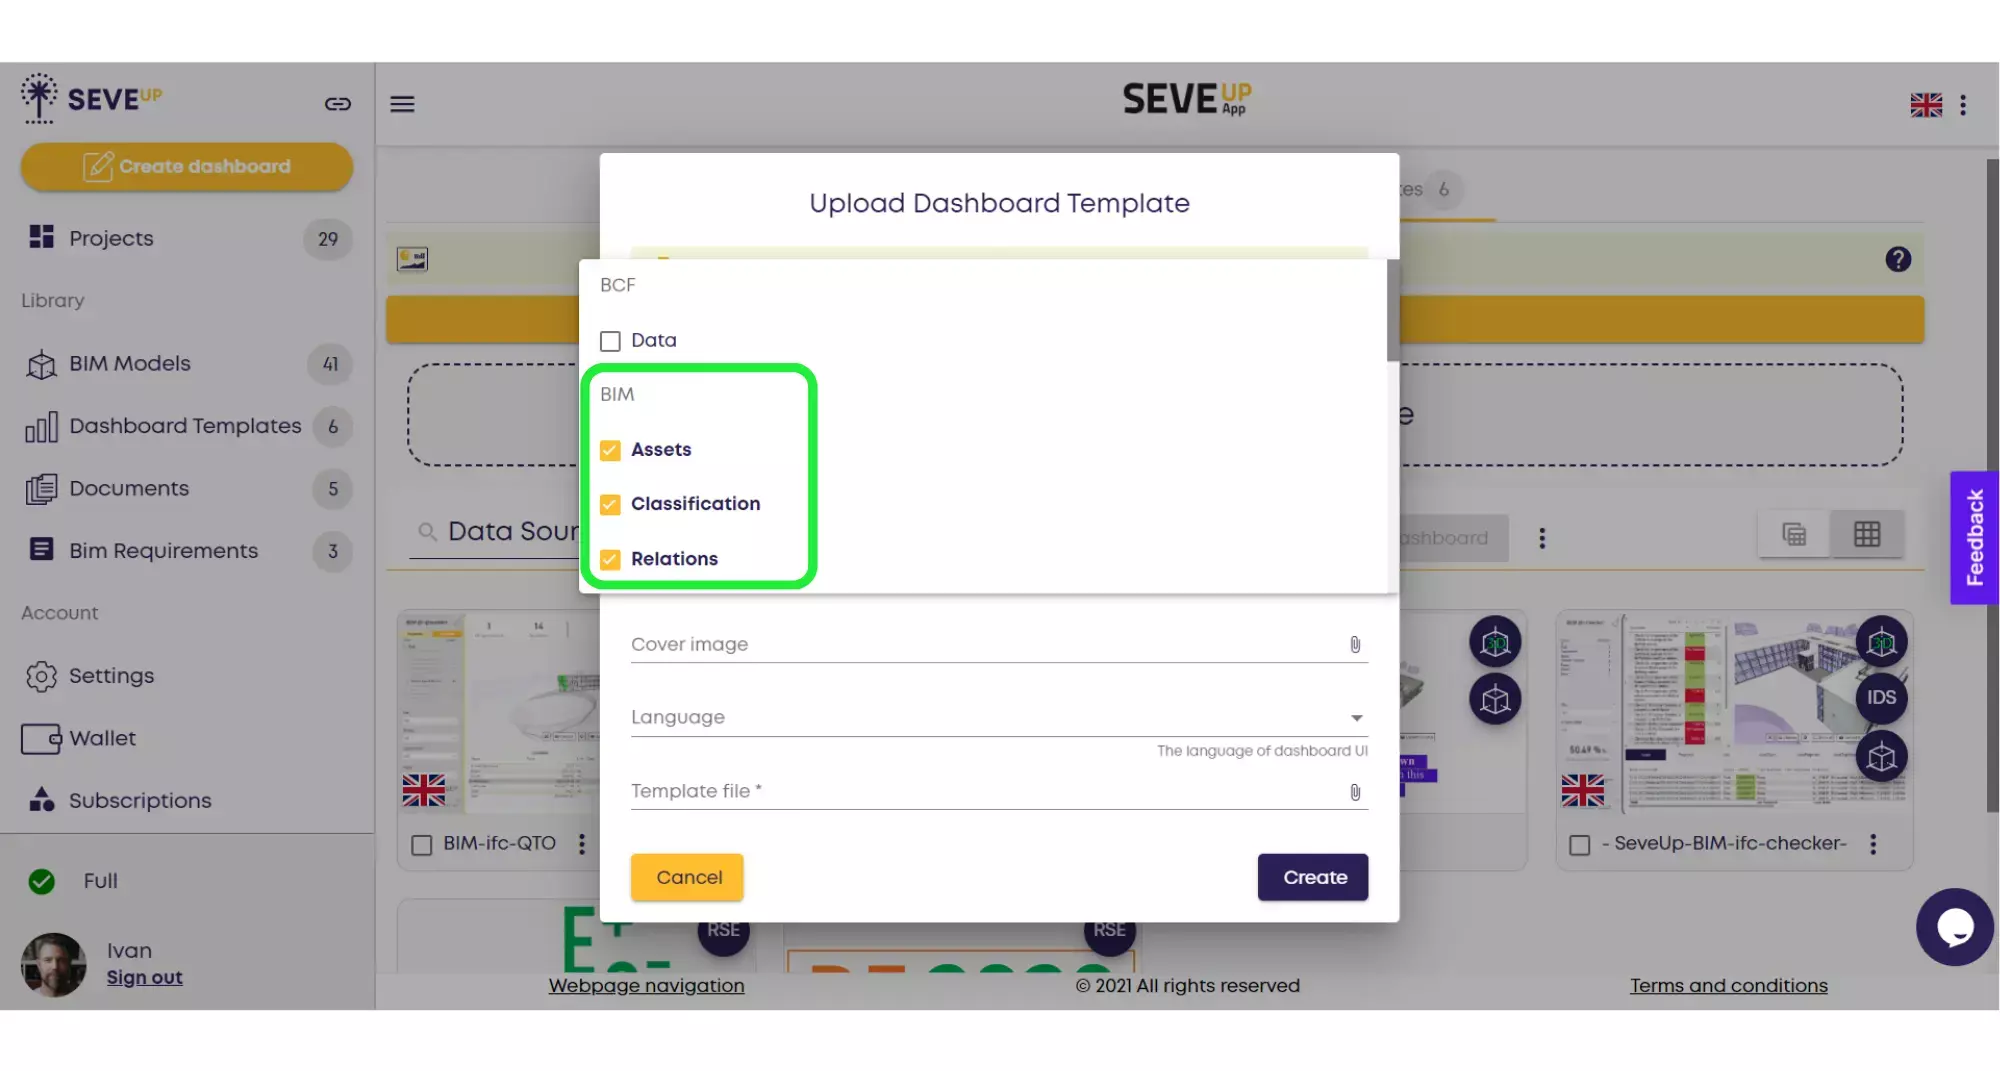
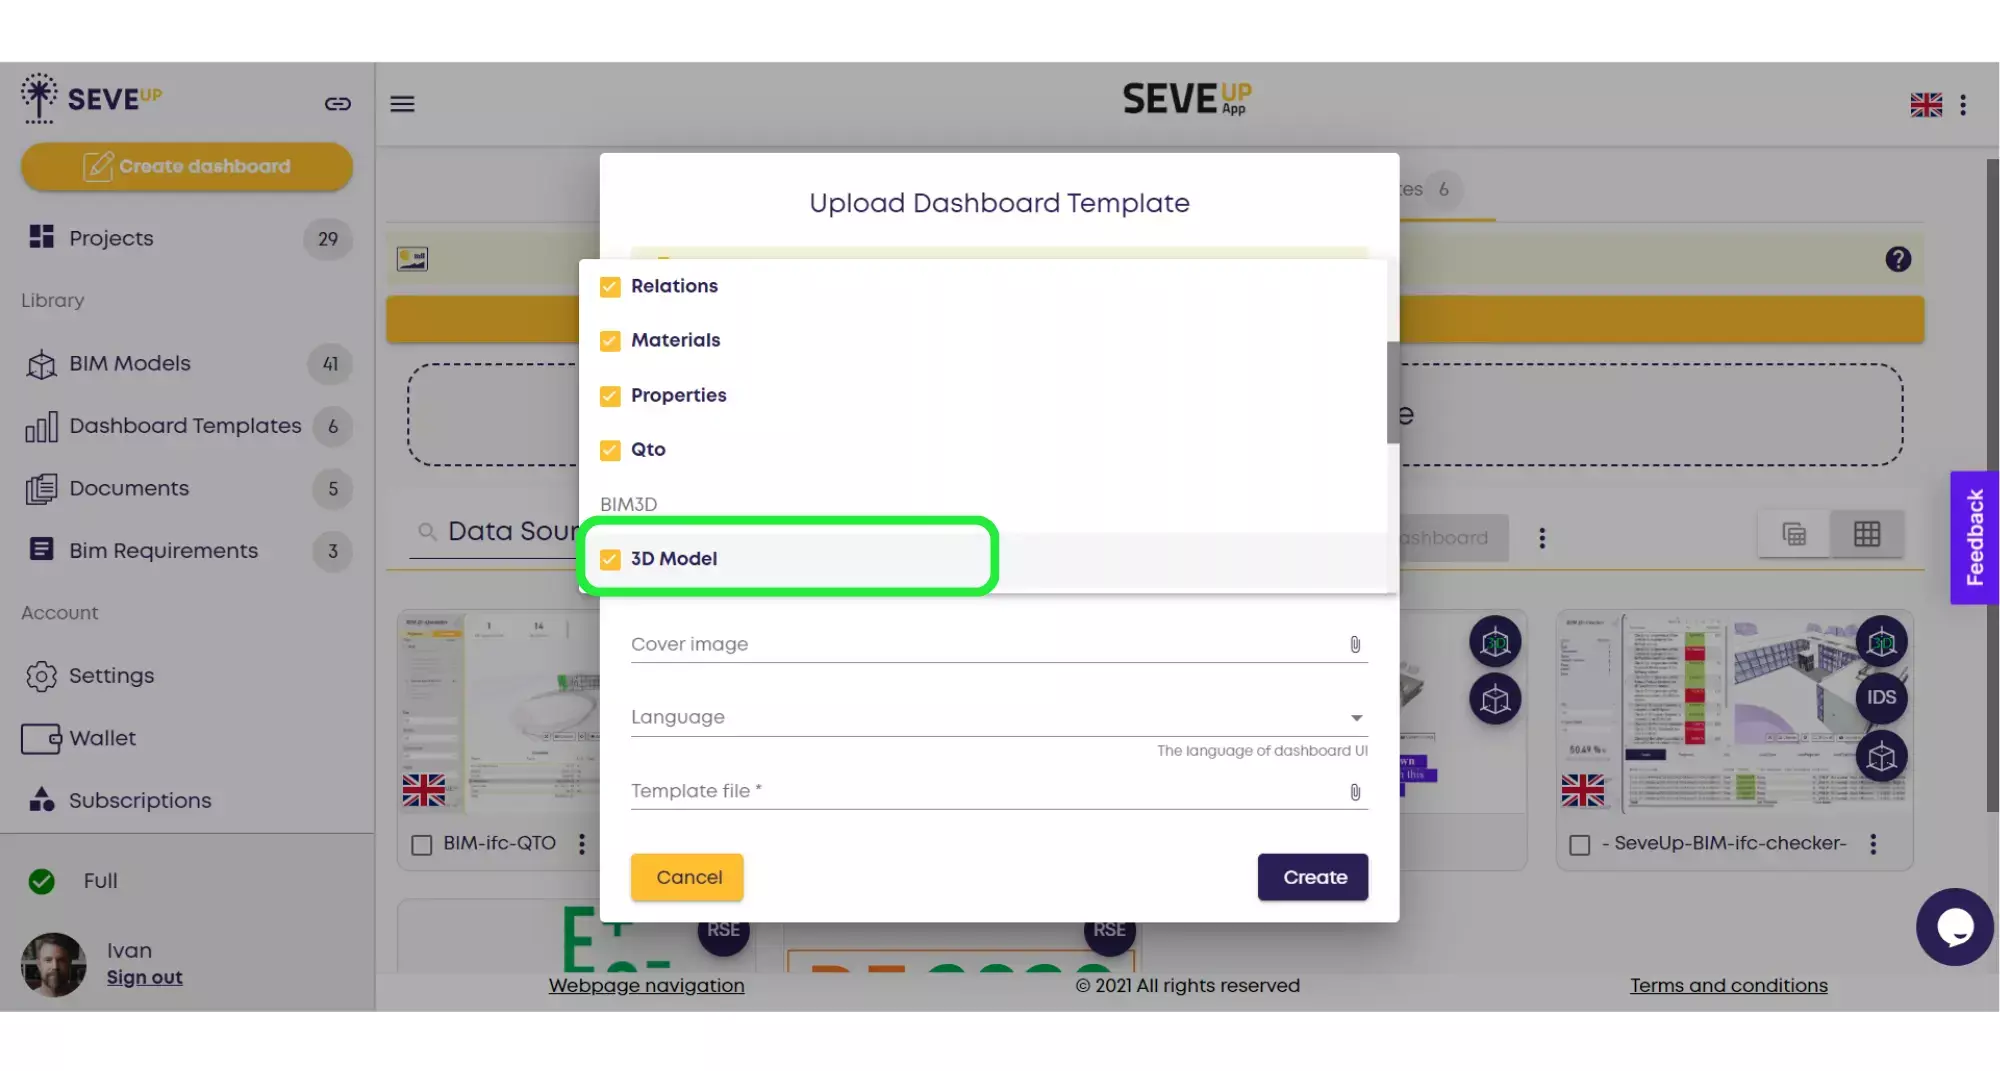
Check off all of the groups of tables under BIM and also make sure to check the BIM 3D option so that the 3D model is included as well.
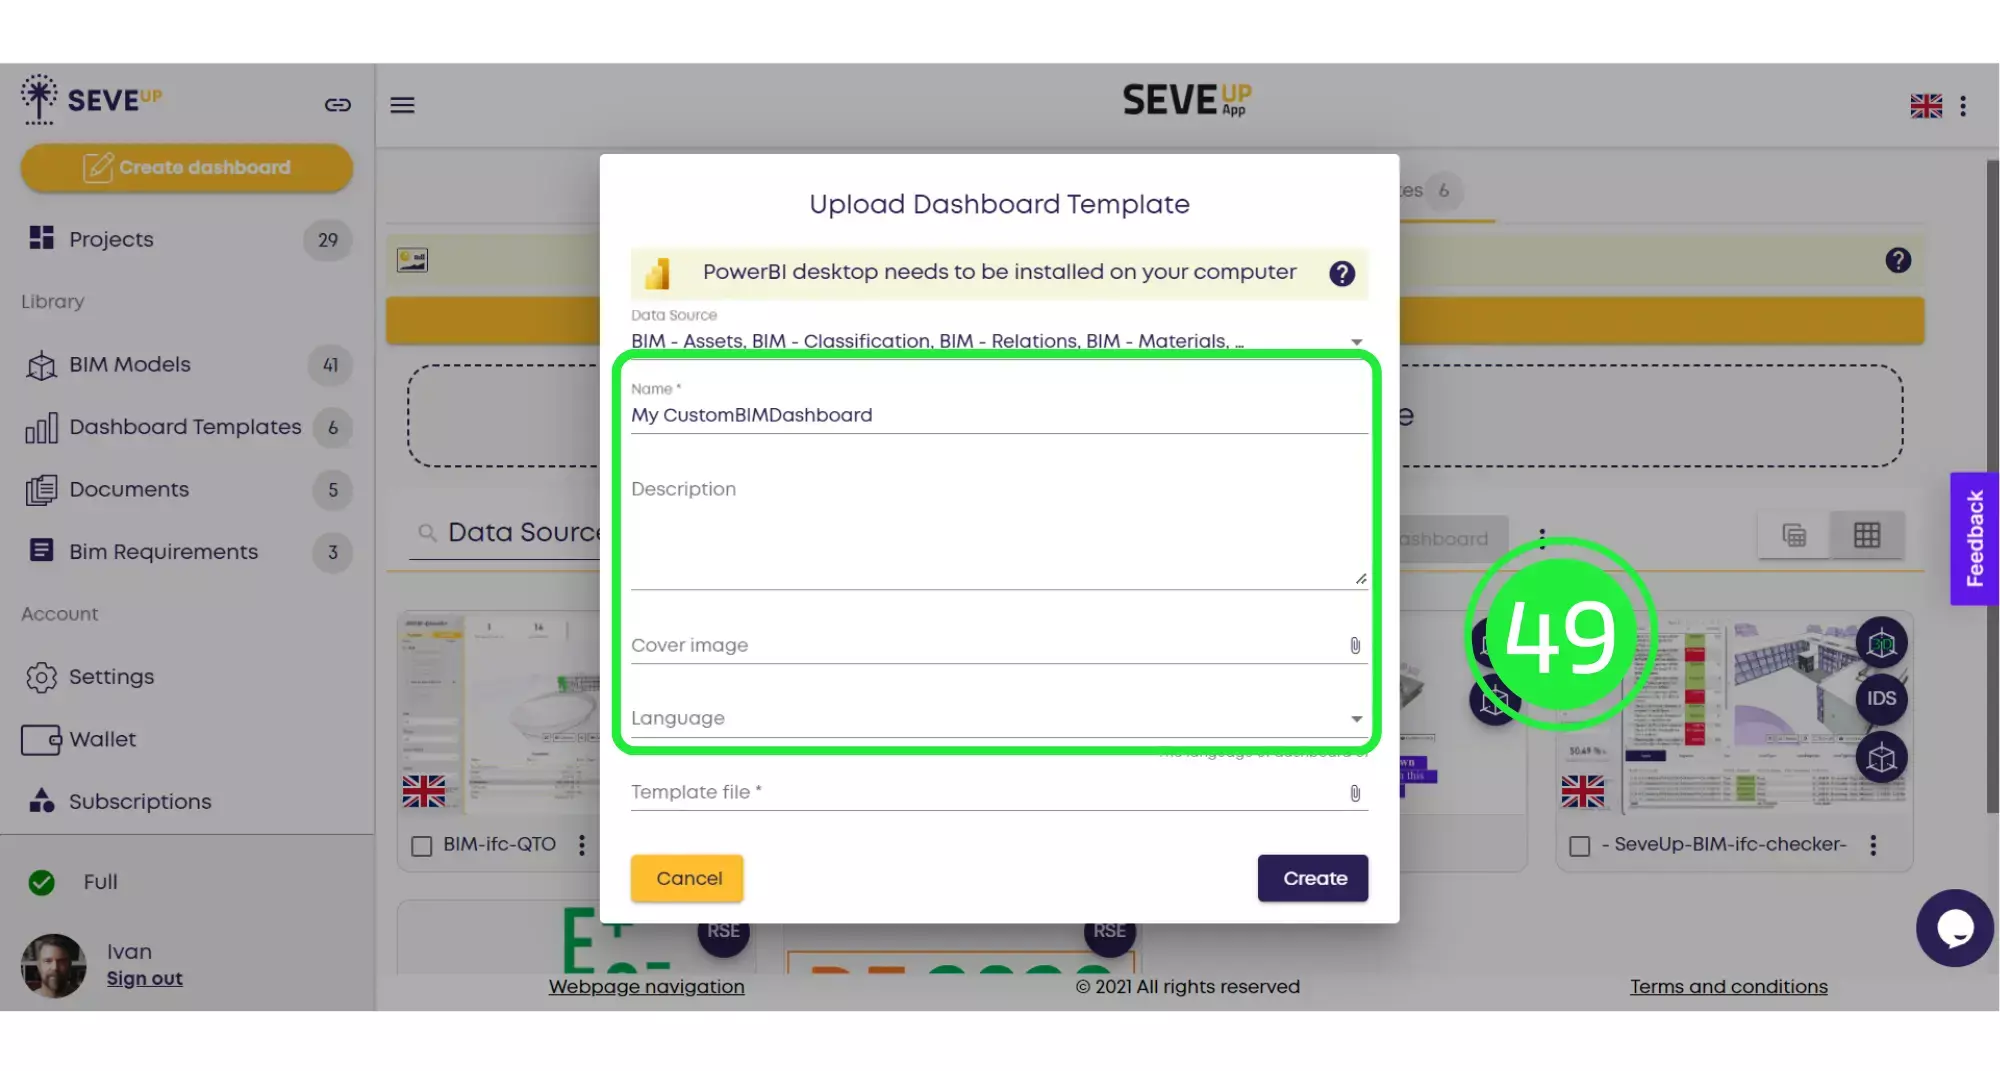
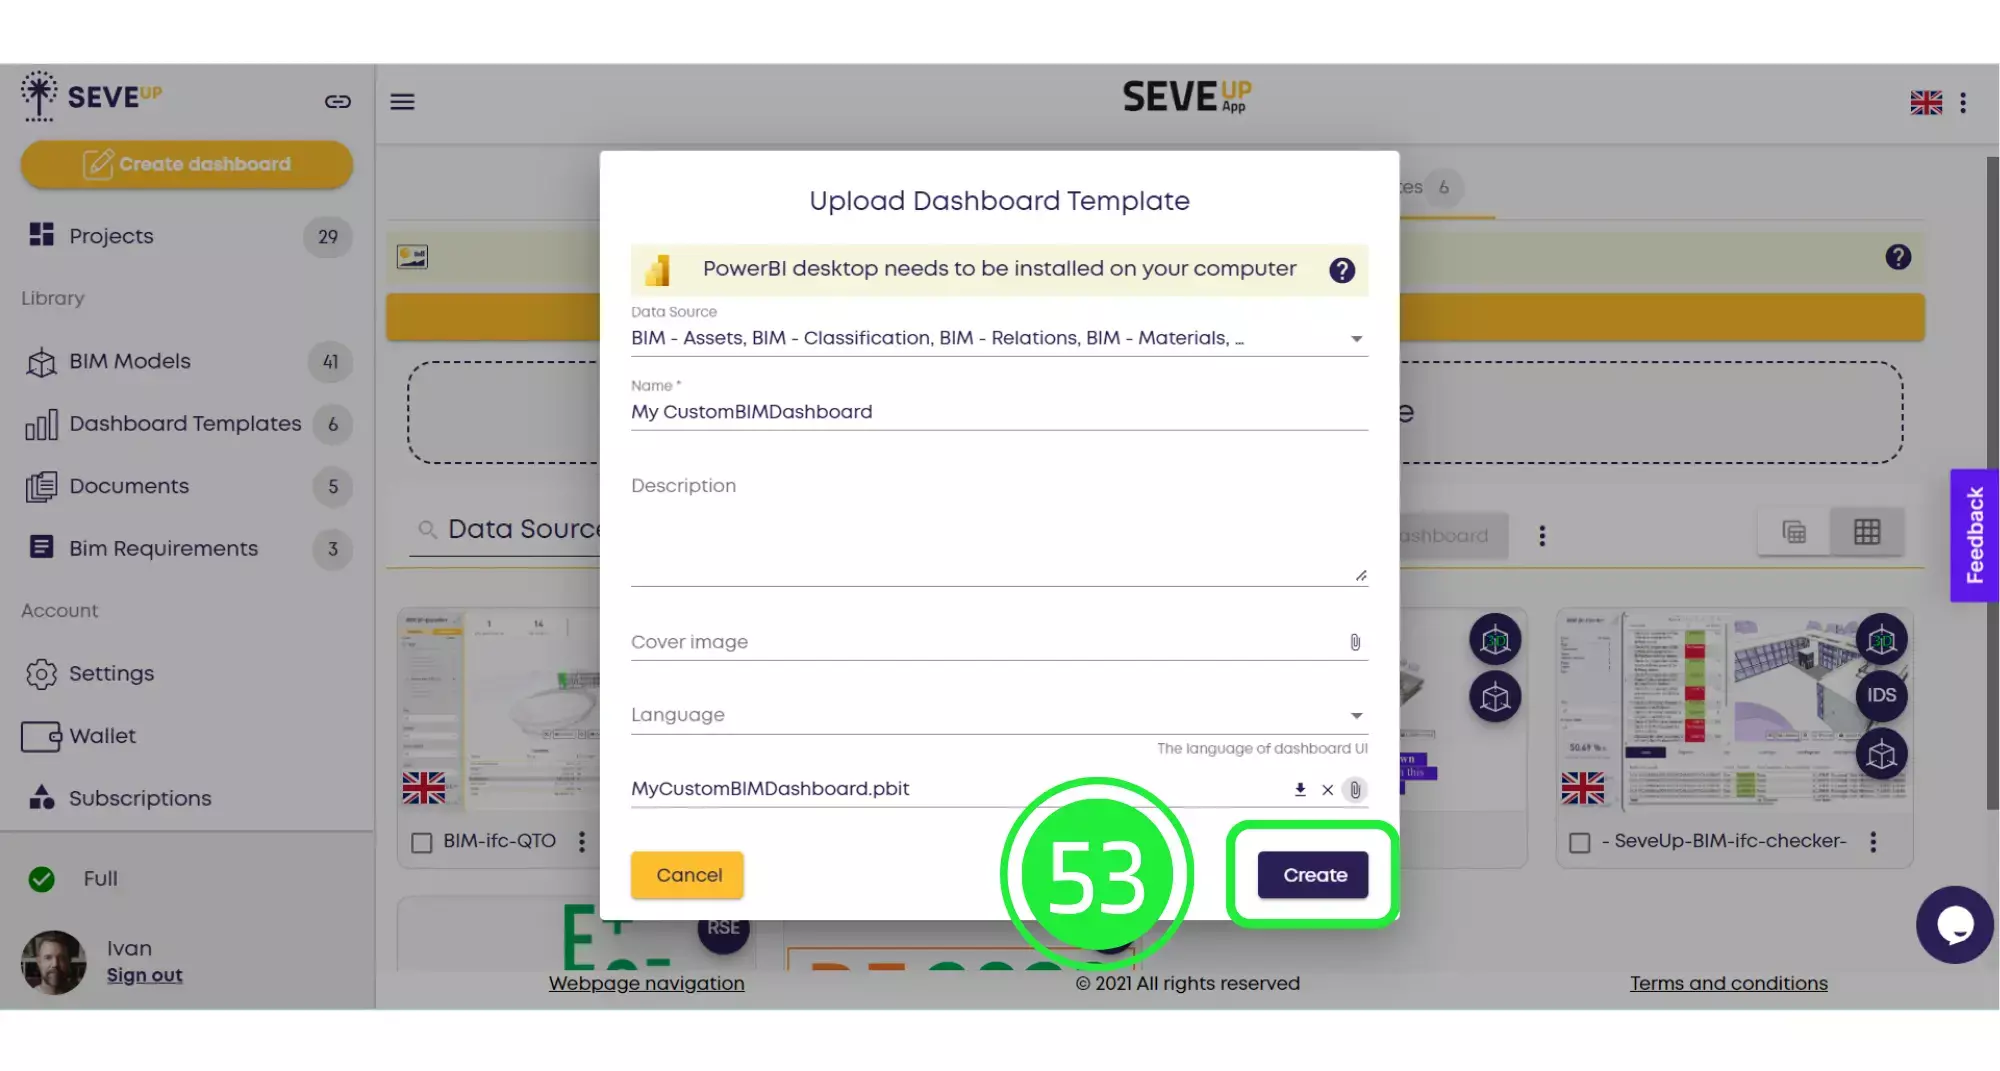
Enter the name and description of your project. You can also attach a cover image or choose a different language.
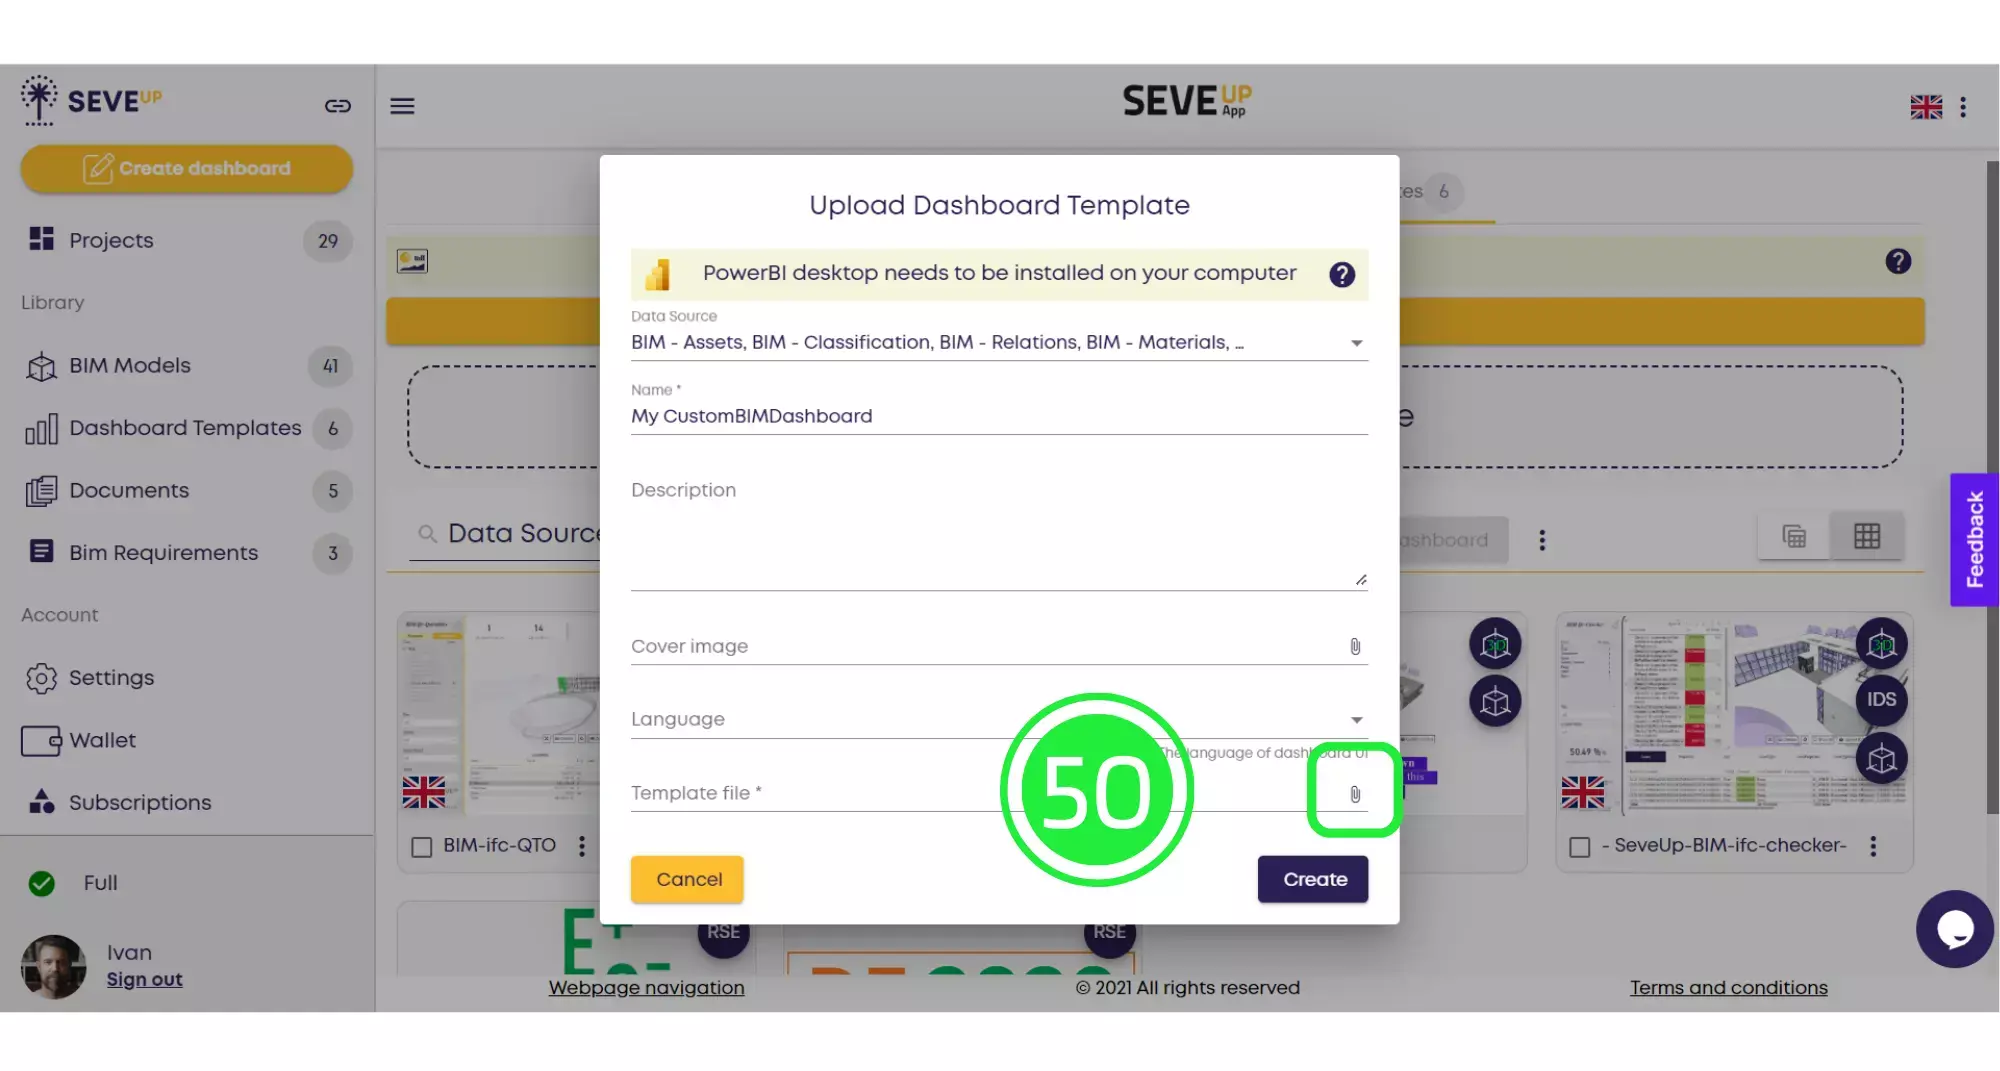
Click on the “Attach File” icon on the “Template File” line.
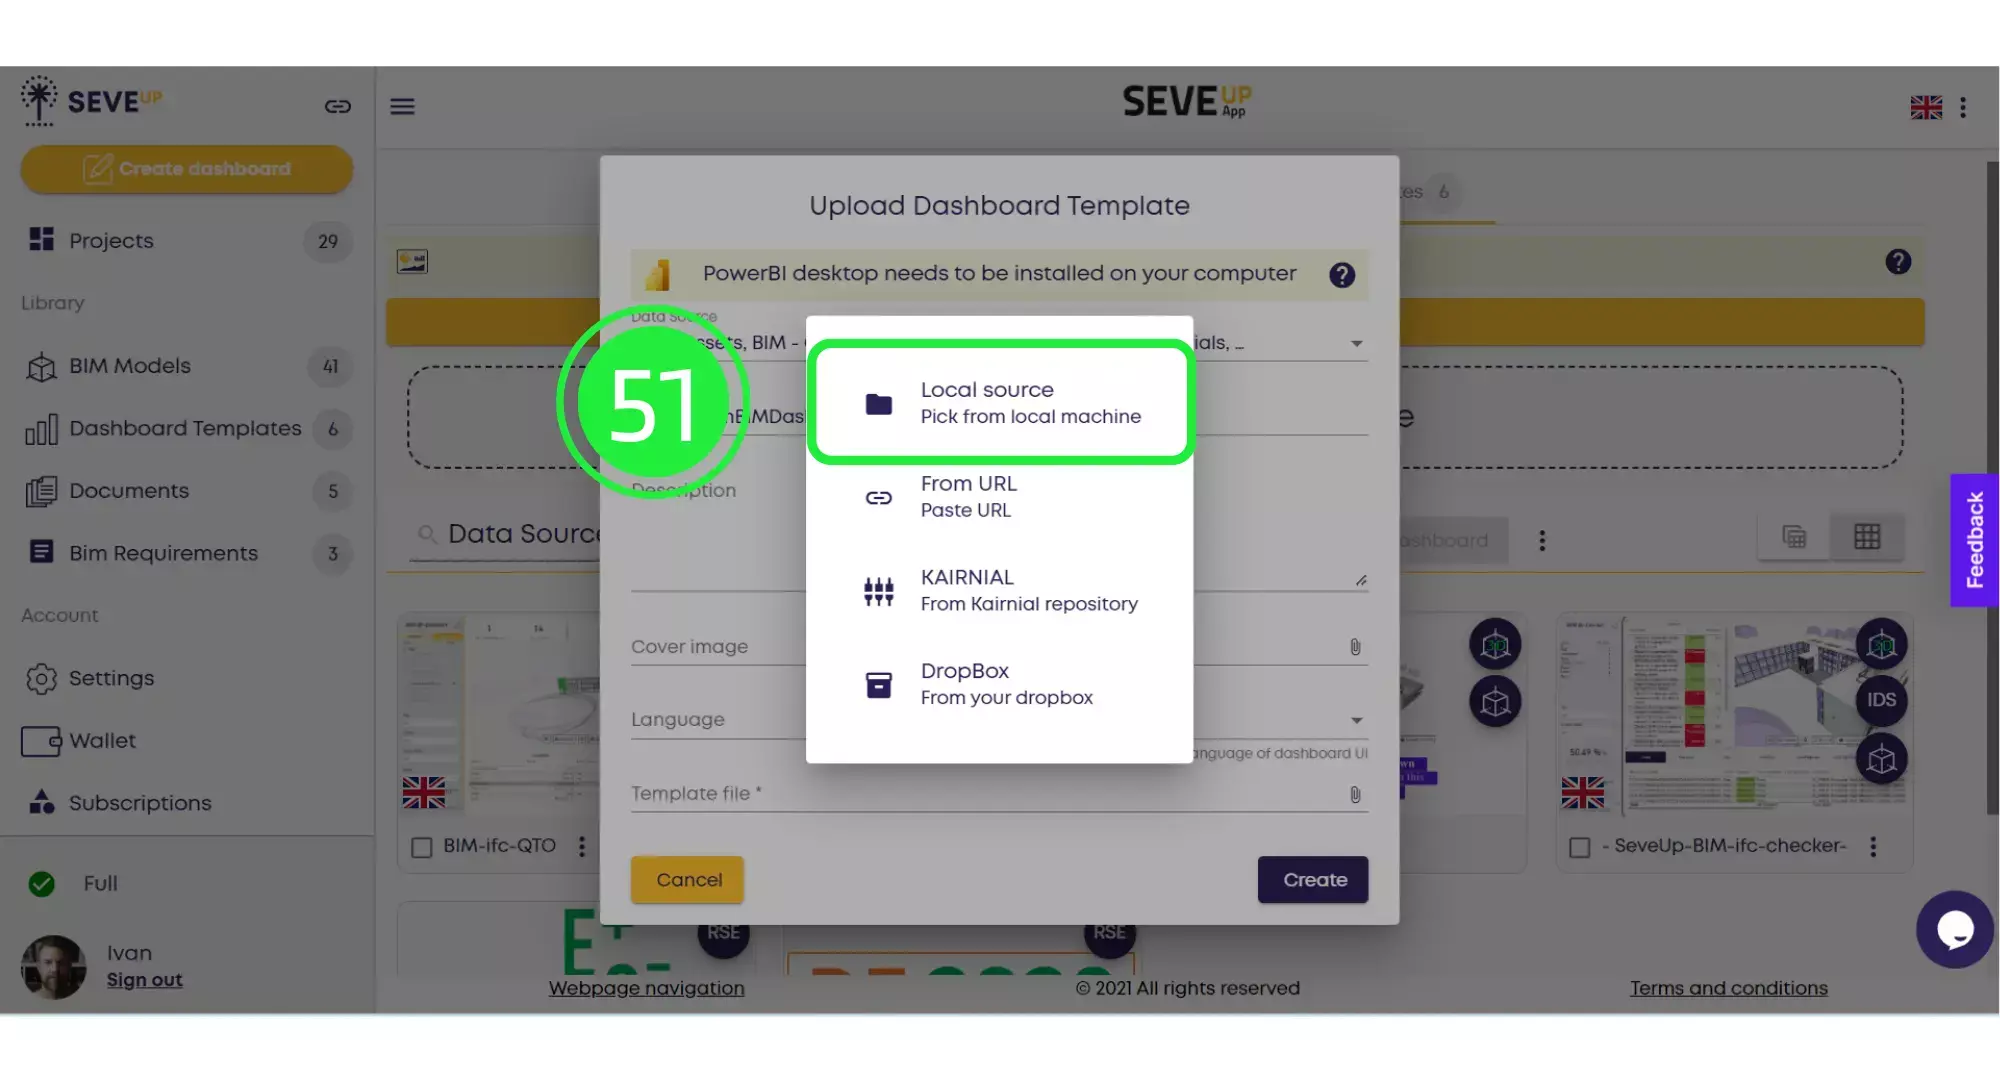
From the pop-up menu choose “Local Source” to attach the file from your computer.
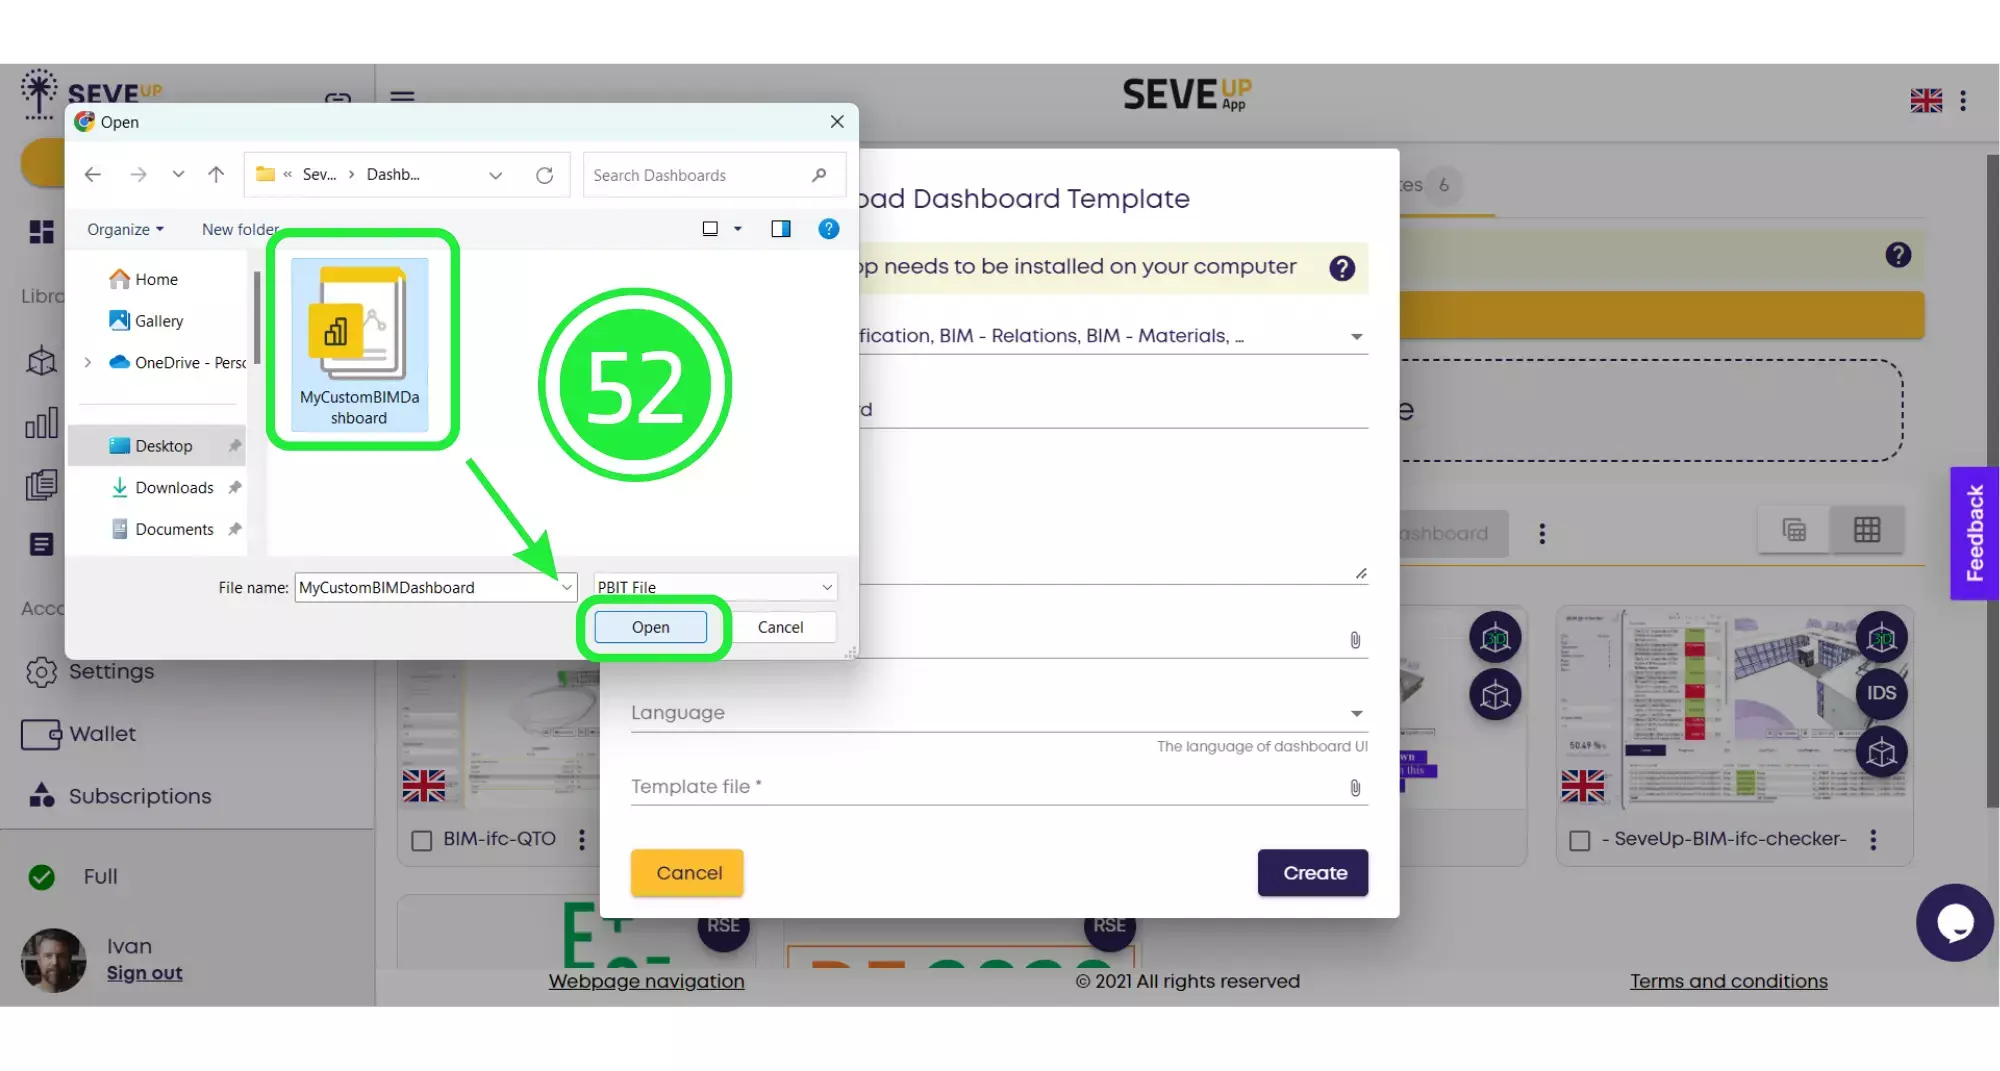
Select your template and click on “Open”
Click on “Create” to finish uploading your template into the SeveUp app.
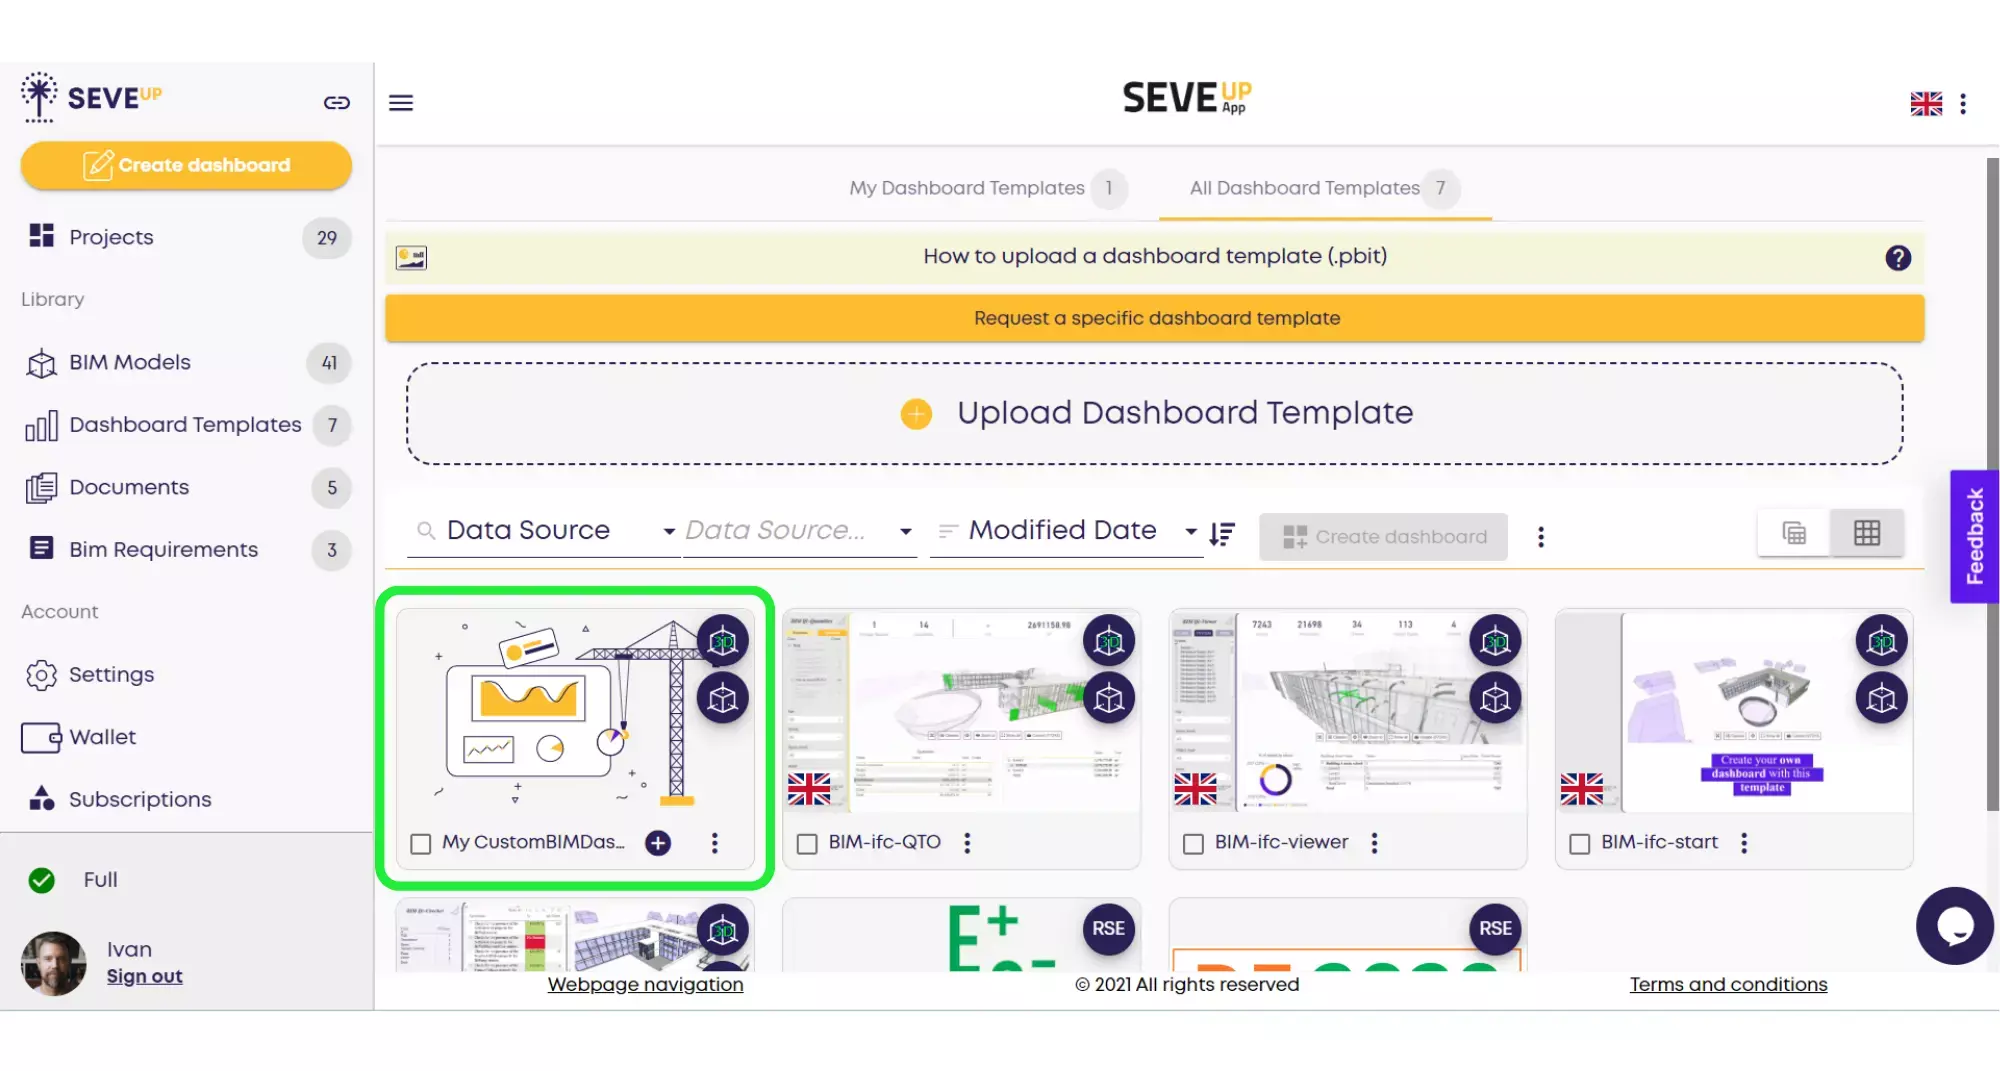
Your newly created template file will now appear in the Dashboard Templates folder and it can be used in any number of projects without the need to create a brand new template each time. You can see how very simple it is to count your BIM properties. I let you continue watching the tutorials on the website. Don’t hesitate to leave a comment and to share the SeveUp’s App.
Want to get started with your very own BIM project? You’ll be surprised by just how easy it is. Create your own free account is SeveUp today and give it a try.


Want to get started with your very own BIM project? You’ll be surprised by just how easy it is. Create your own free account is SeveUp today and give it a try.

Unlock the power of your building data with SeveUp. Tailored dashboards, seamless integration
🎓 Free BIM Checker Training Learn how to automate your BIM model checks and get certified. Register for Free Click
Learn More🎓 Free BIM Checker Training Learn how to automate your BIM model checks and get certified. Register for Free Click
Learn More🎓 Free BIM Checker Training Learn how to automate your BIM model checks and get certified. Register for Free Choose
Learn More