Trusted by companies
all over the world:
Uncover the power of Microsoft Power BI in conjunction with the SeveUp App BIM dataset to efficiently administer and highlight BIM properties. The focus of this tutorial is on creating a BIM properties table using Power BI's Matrix visual and SeveUp, allowing you to manage and present BIM property data in a structured and insightful manner.
In the architecture, engineering, and construction industries, having access to organised and sortable data is paramount for effective decision-making and project management. With Power BI's intuitive interface and the robust BIM dataset provided by SeveUp, we have the perfect toolkit at our disposal to harness the full potential of our BIM data.
Join us as we embark on a journey to create a customizable table that not only sorts but also displays BIM properties with precision and clarity. Through this tutorial, we'll explore how to leverage Power BI's Matrix visual to arrange BIM property data in rows and columns, enabling us to analyse and compare different properties effortlessly.
Whether you're a seasoned BIM analyst looking to streamline your data visualisation process or just beginning your journey into the realm of data analytics, this tutorial is designed to equip you with the skills and knowledge needed to leverage Power BI's Matrix visual effectively. By the end of this tutorial, you'll have the tools to create informative and visually appealing tables that empower you to make informed decisions and drive efficiency in your projects.
At the end of this tutorial you will become an expert to Organize and showcase your BIM properties. Let’s start !
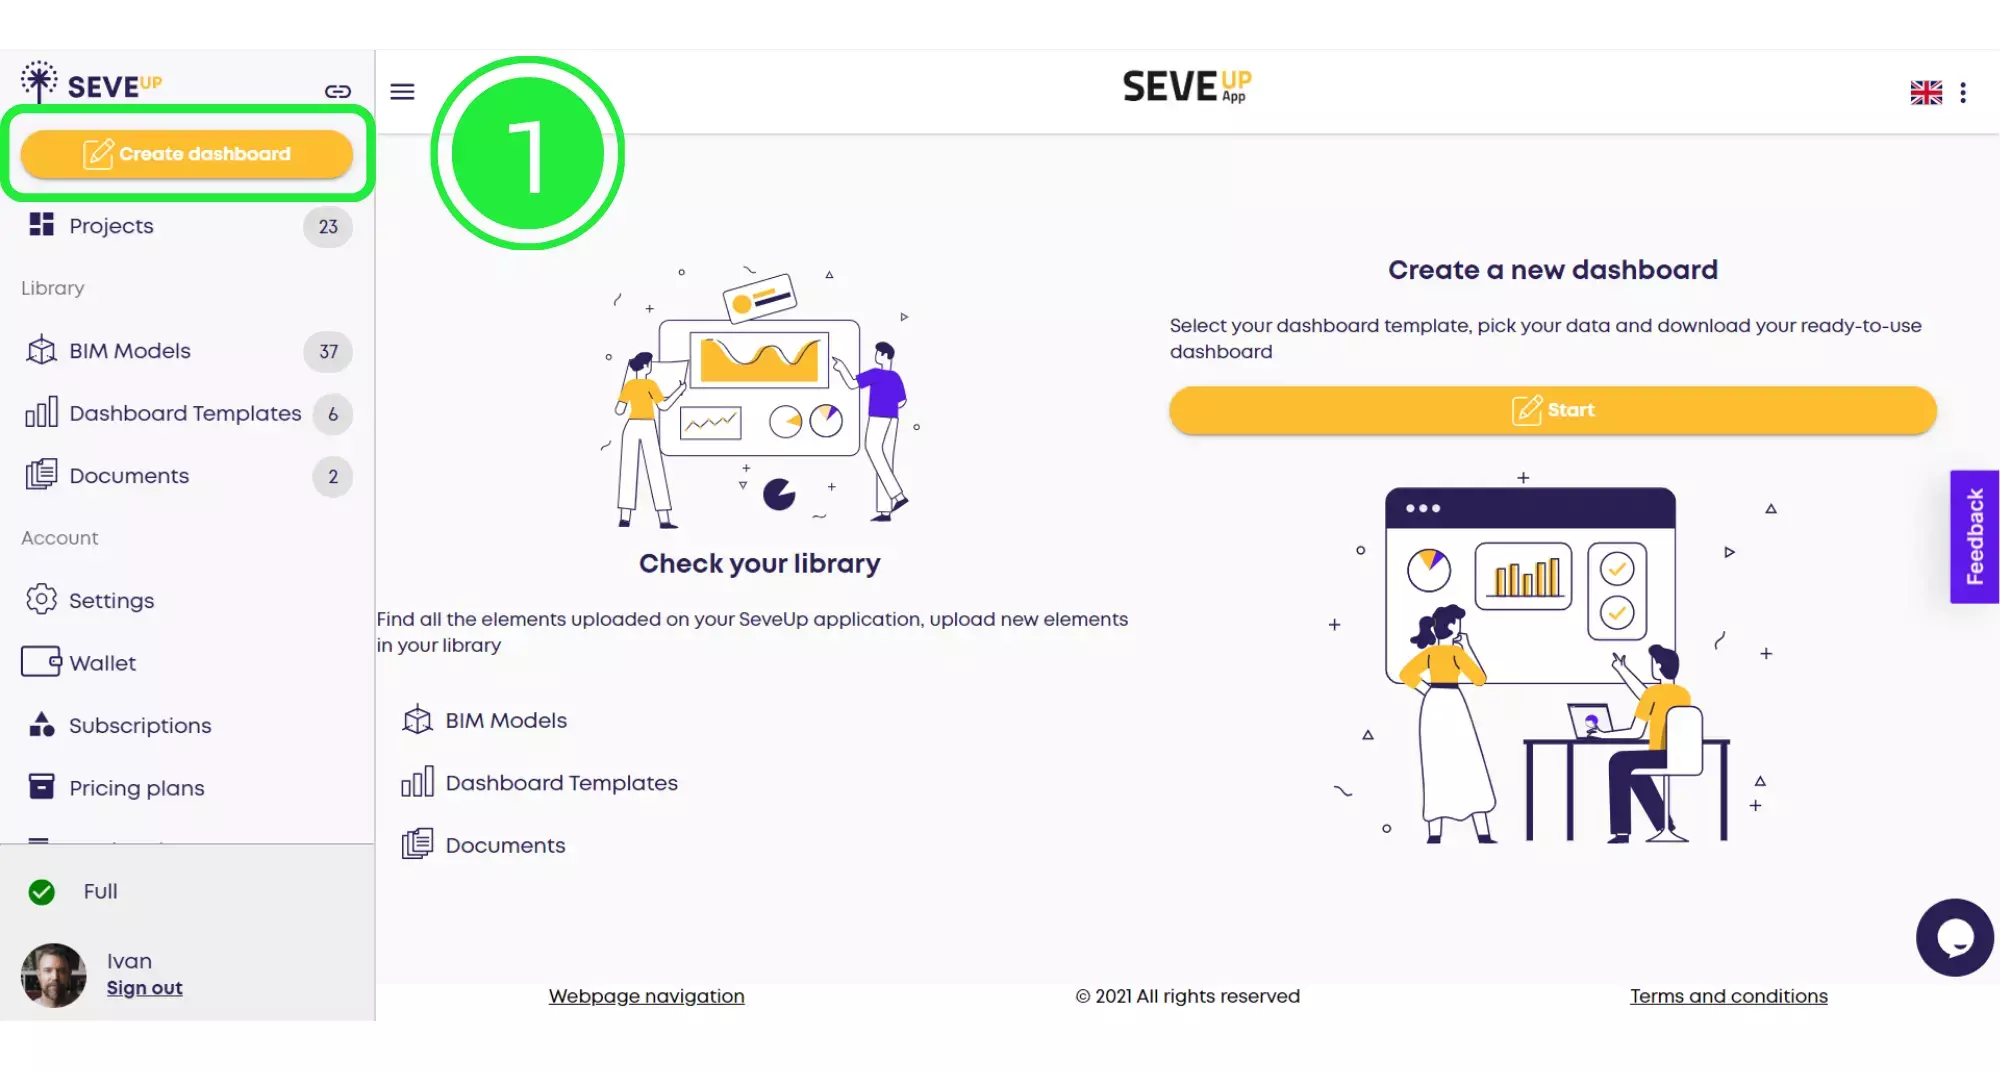
Start off by logging in to your SeveUp App account and then click on the “Create Dashboard” button.
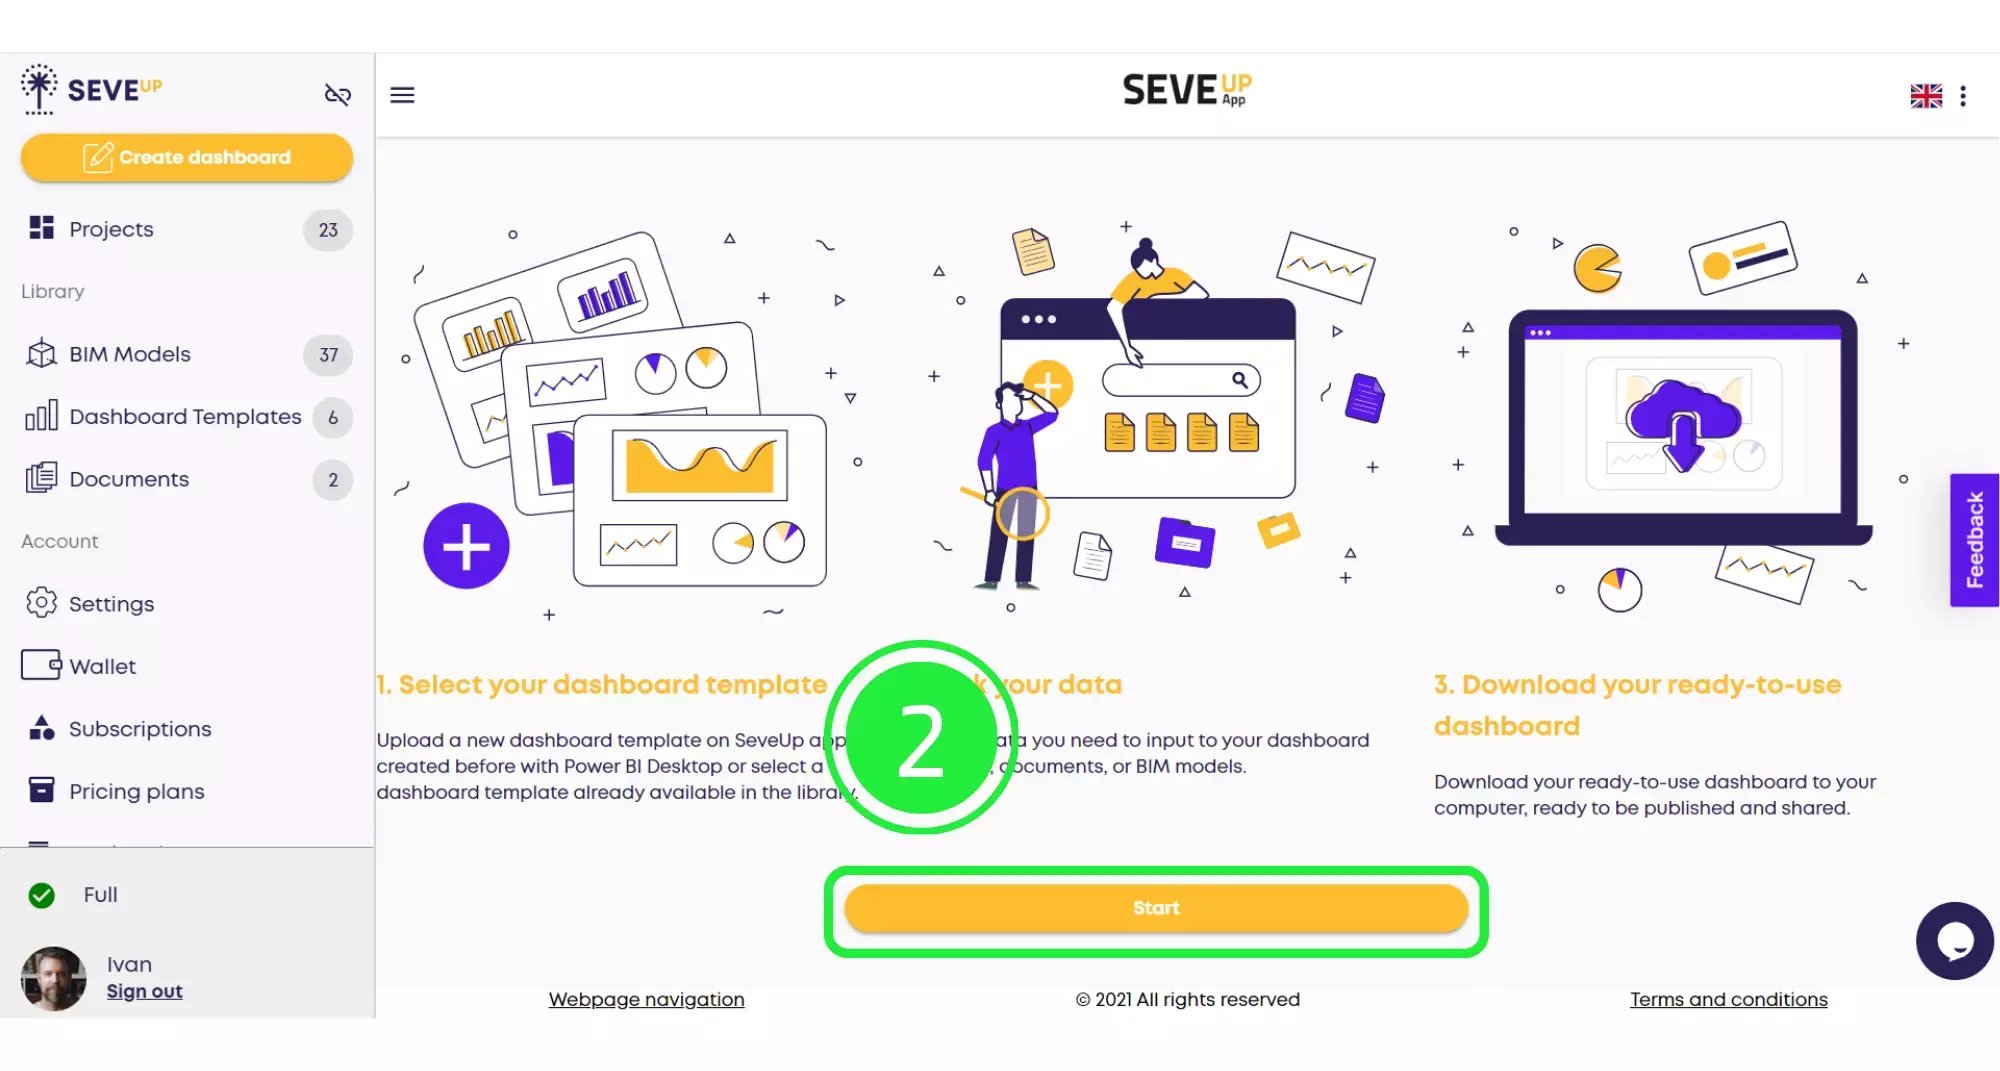
In the centre of the tutorial page you’ll find the “Start” button. Click on that to start creating your new dashboard.
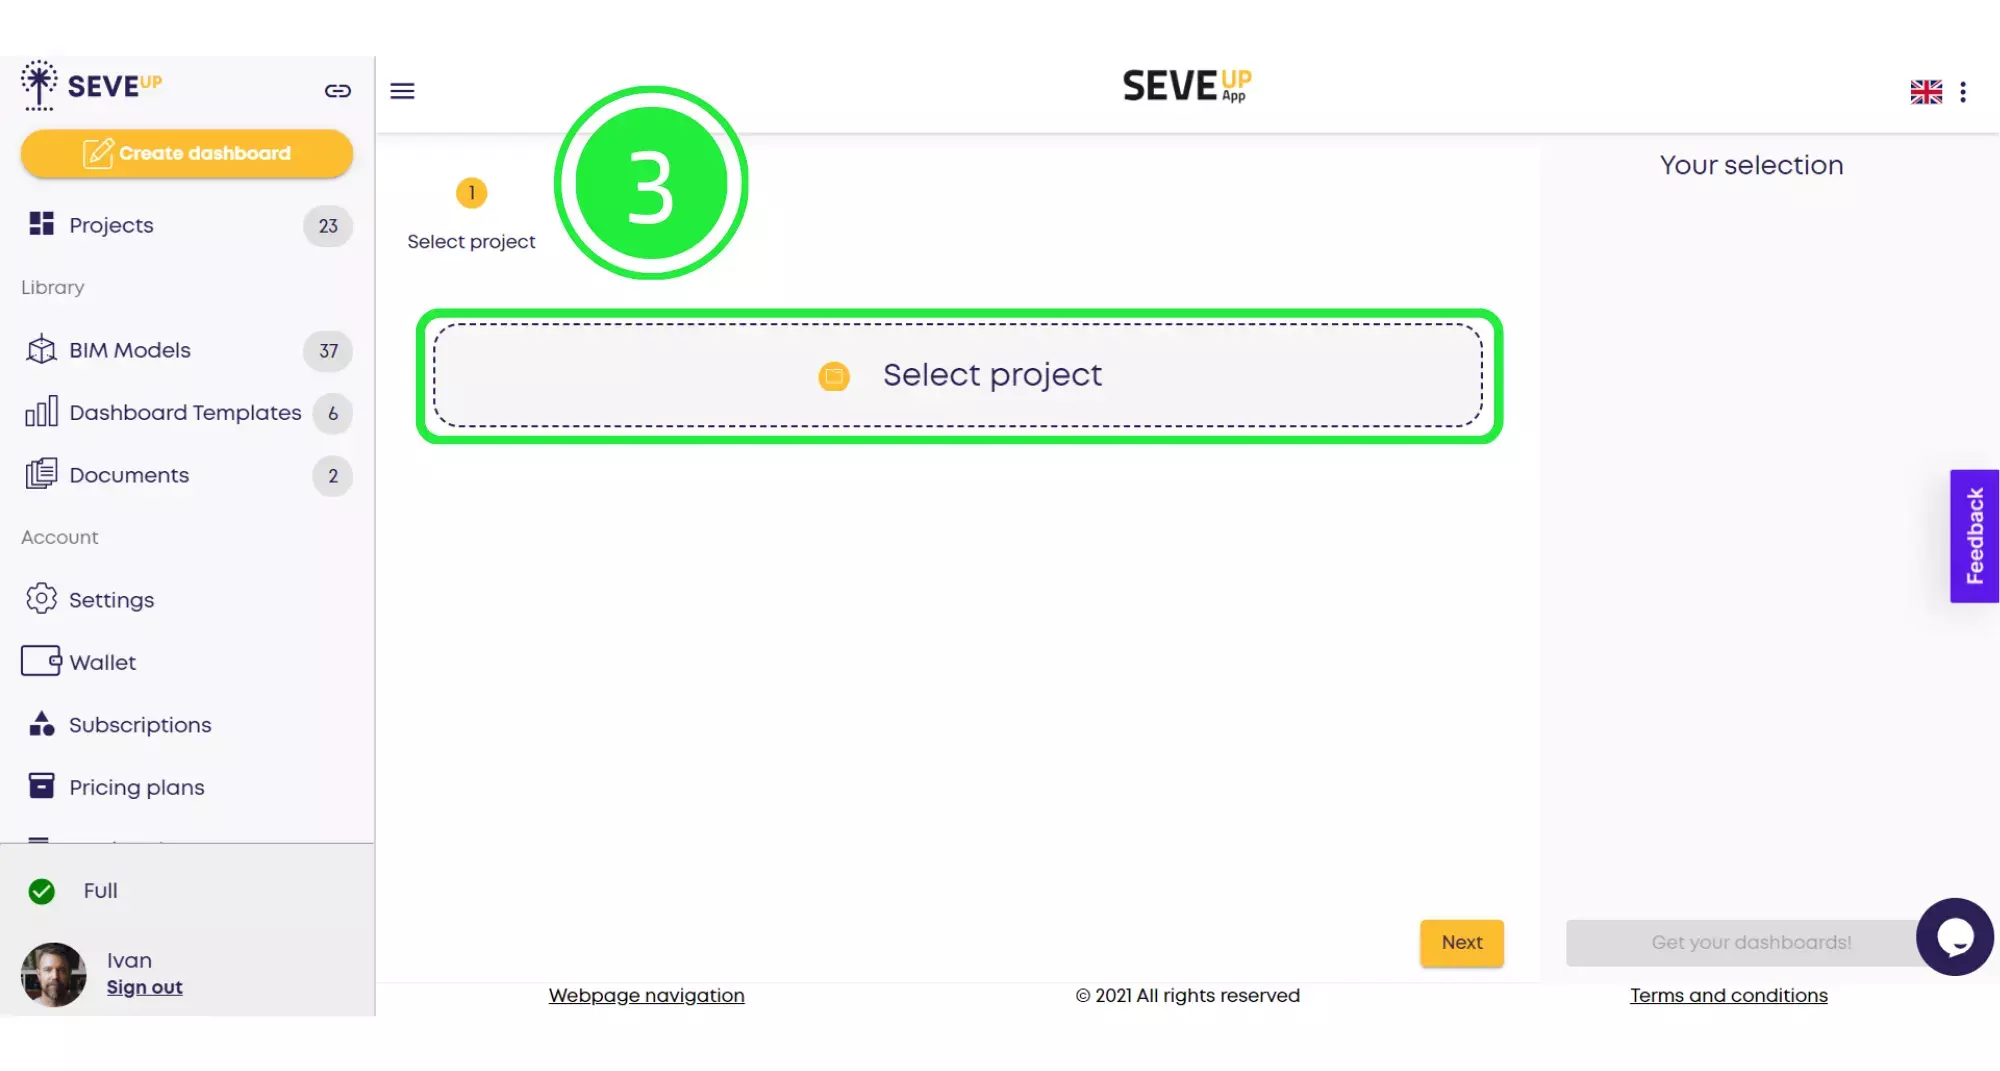
At the top of the page, you’ll see the wizard is now showing your progress. Click on the large “Select Project” button in the centre.
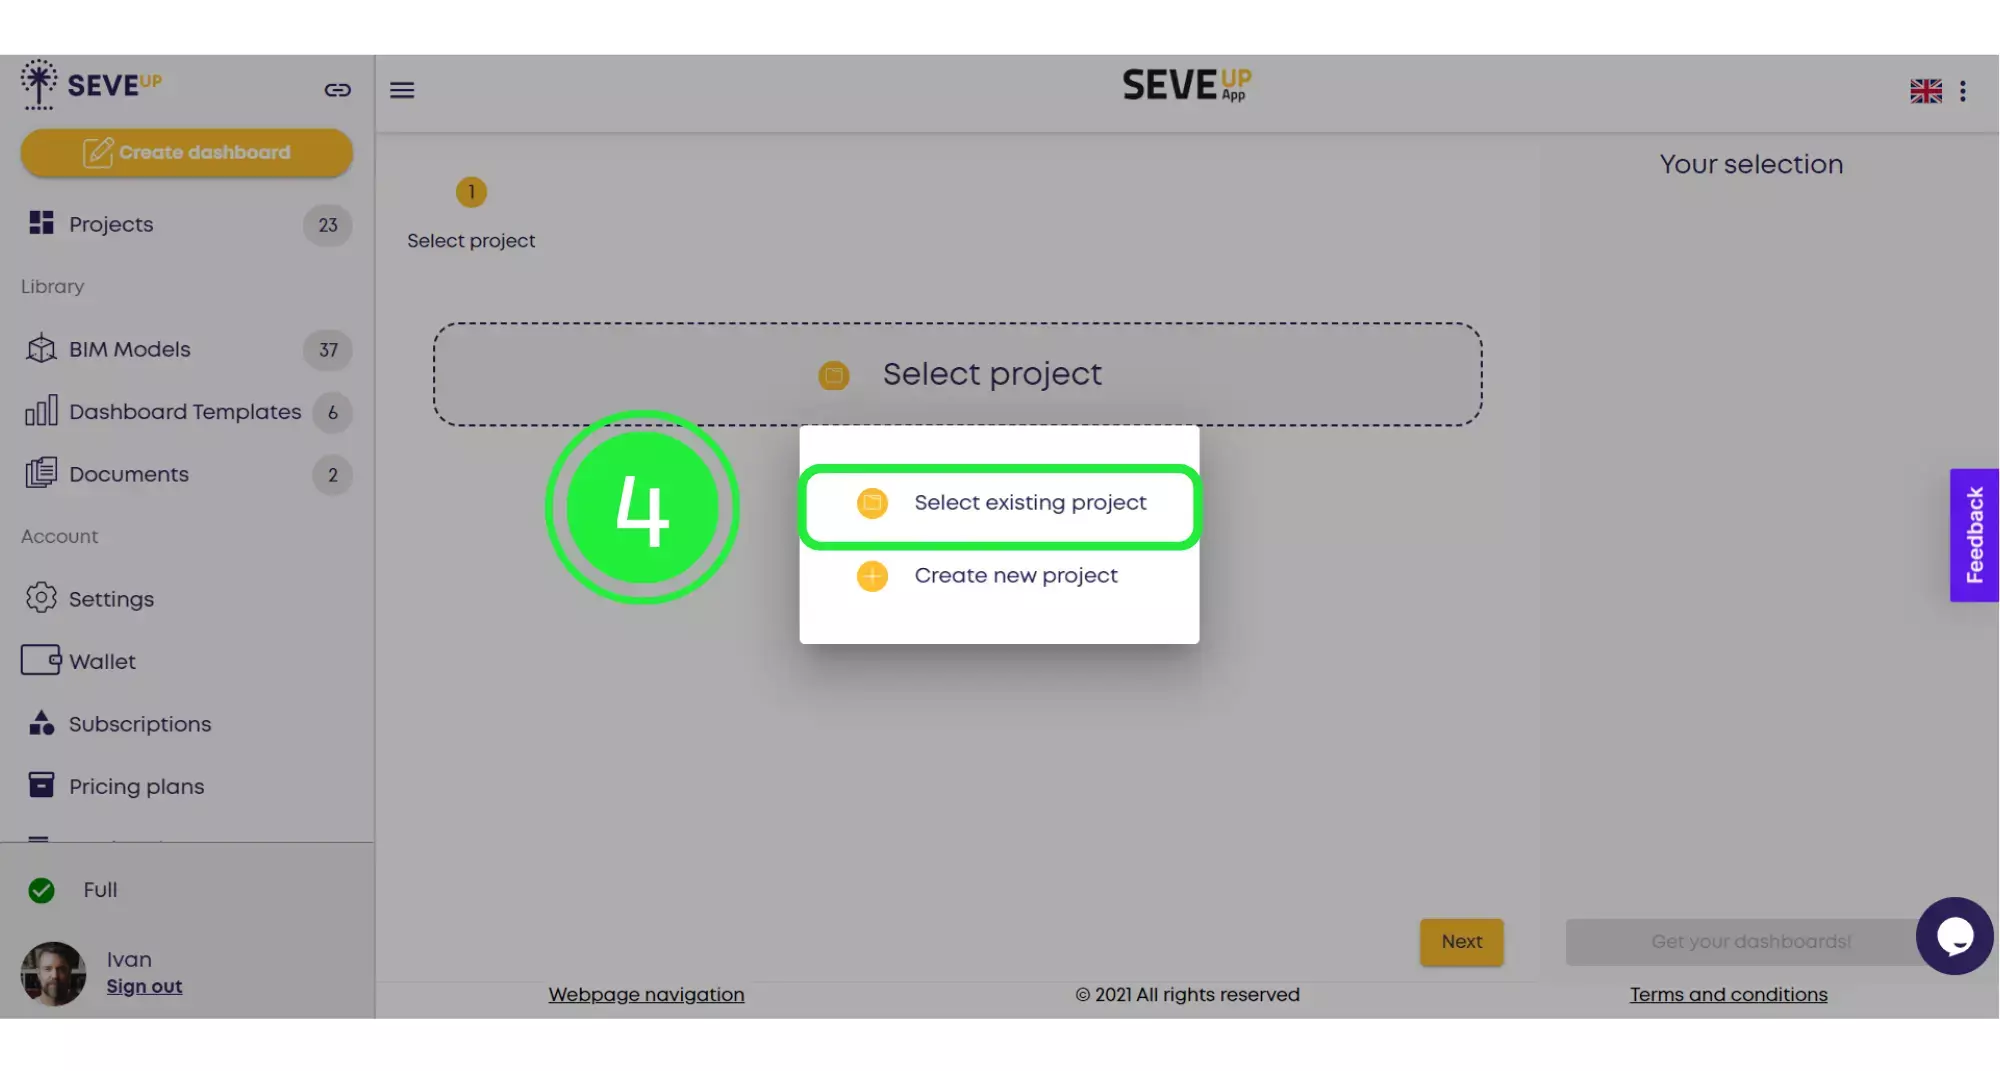
A pop-up will appear, allowing you to choose whether to select an existing project or create a new project. Click on “Select Existing Project”.
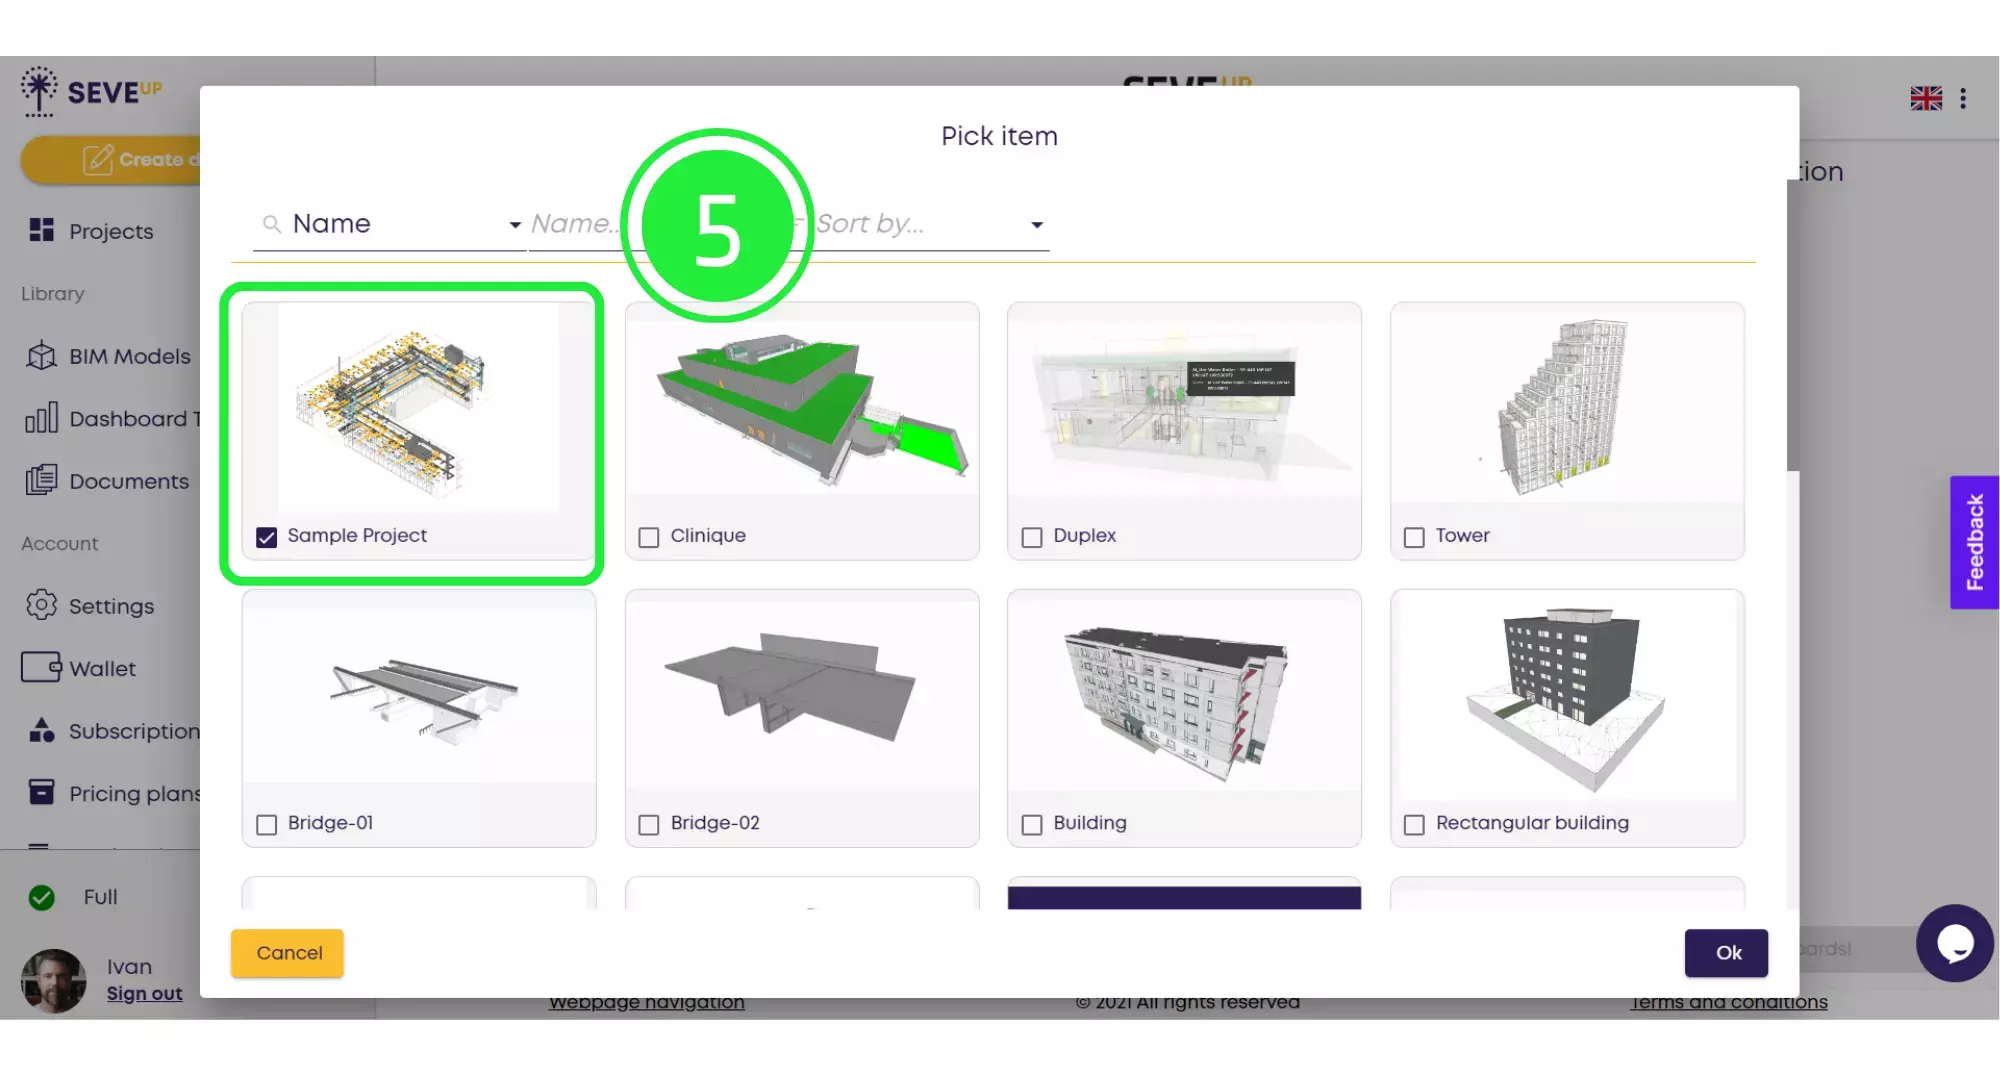
A selection of your projects will appear in a pop-up box. Choose the project you want to use by clicking on the small box to highlight it with a tick.
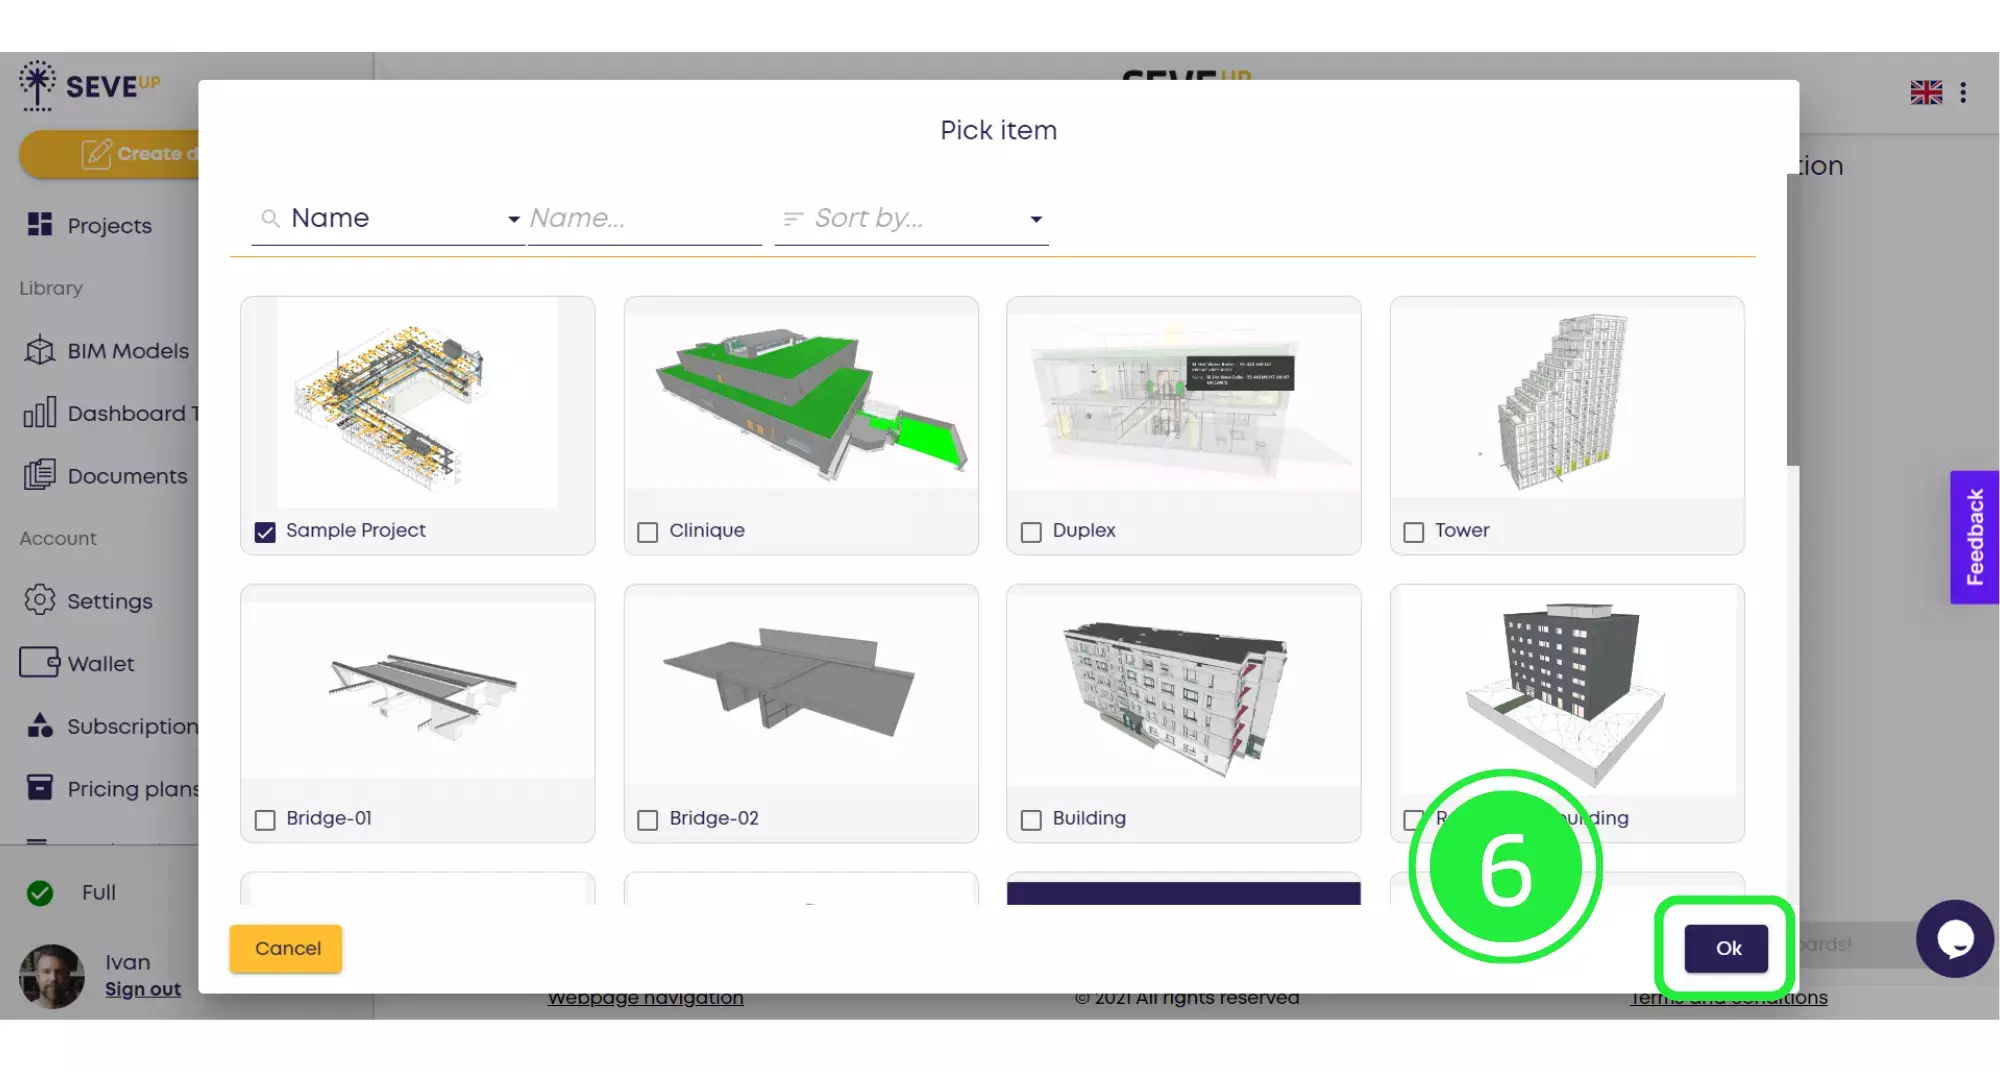
Now click on the “OK” button located in the bottom right corner.
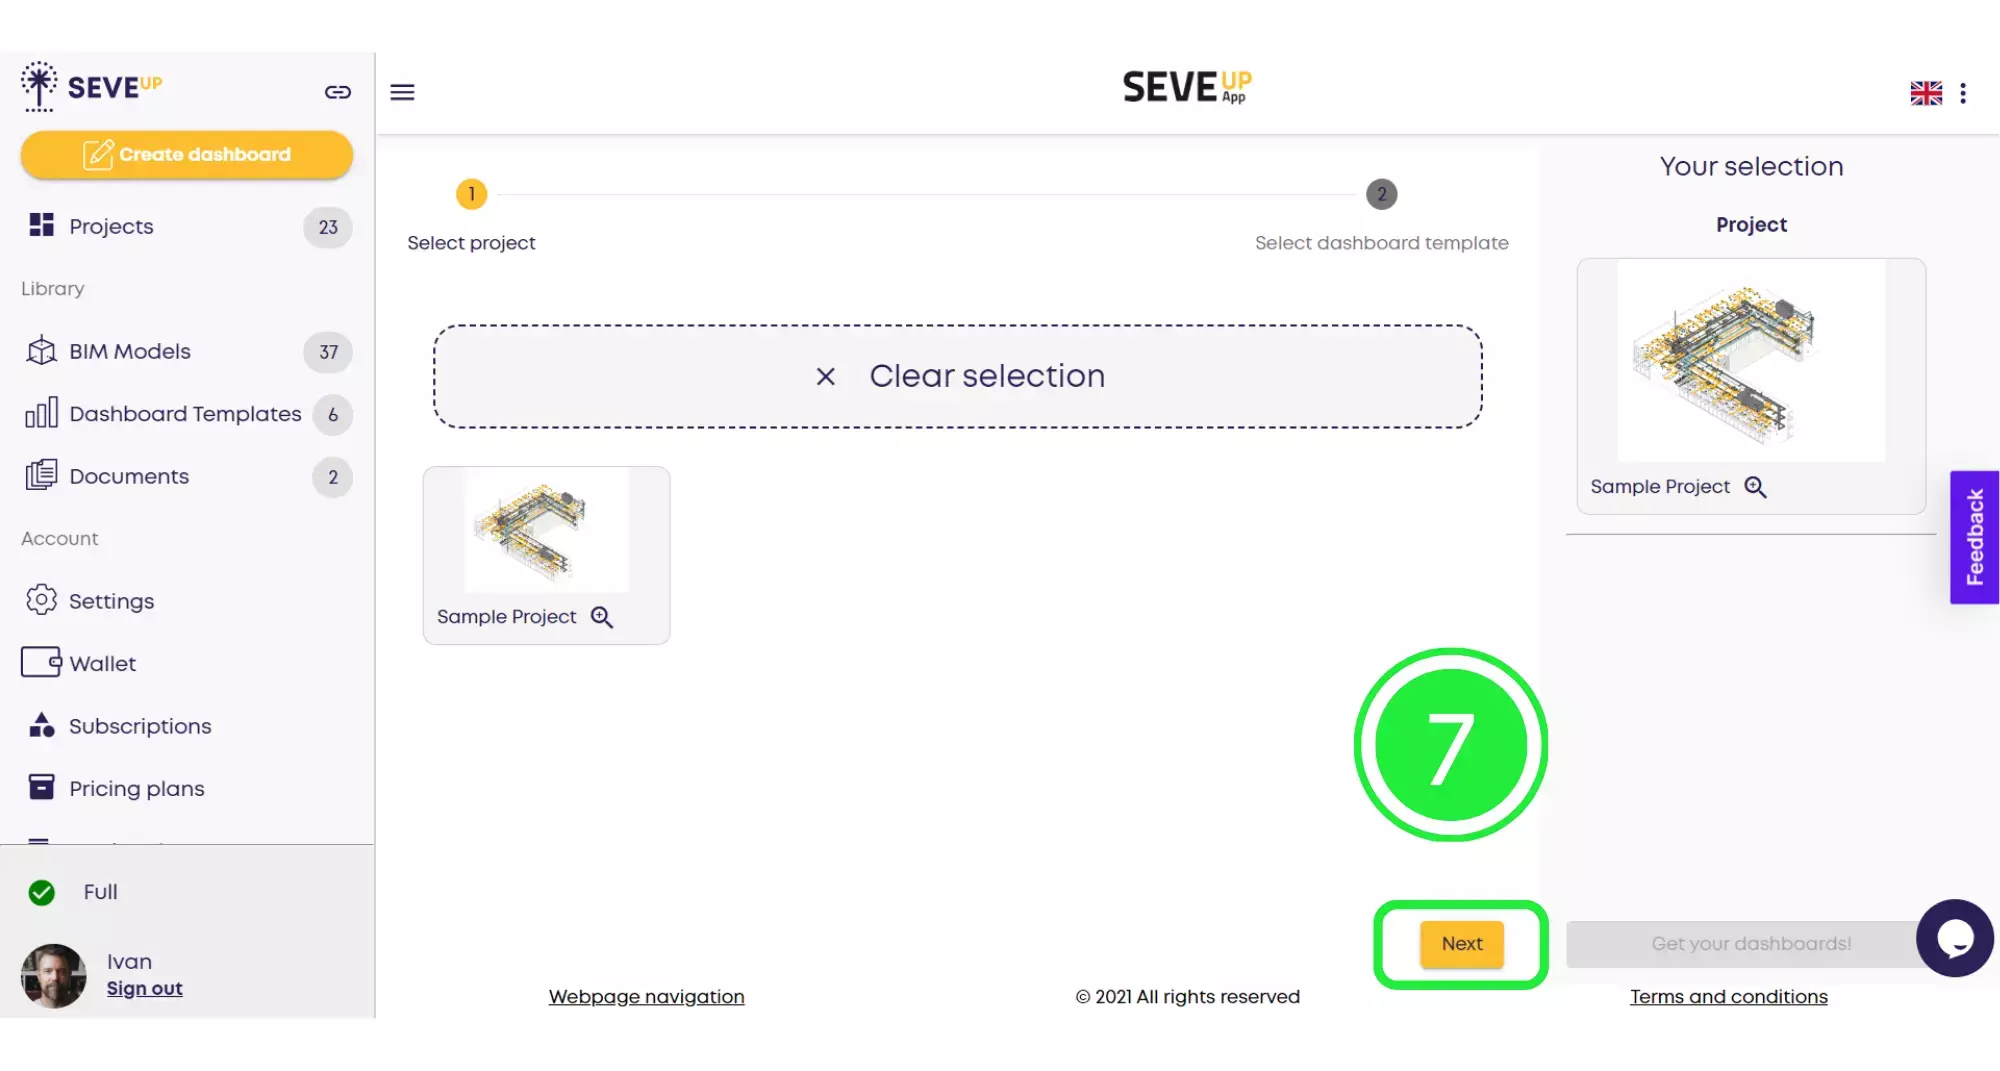
Now you’ll see the project you’ve chosen appear in the wizard. Then click on “Next” at the bottom to move to the following stage.
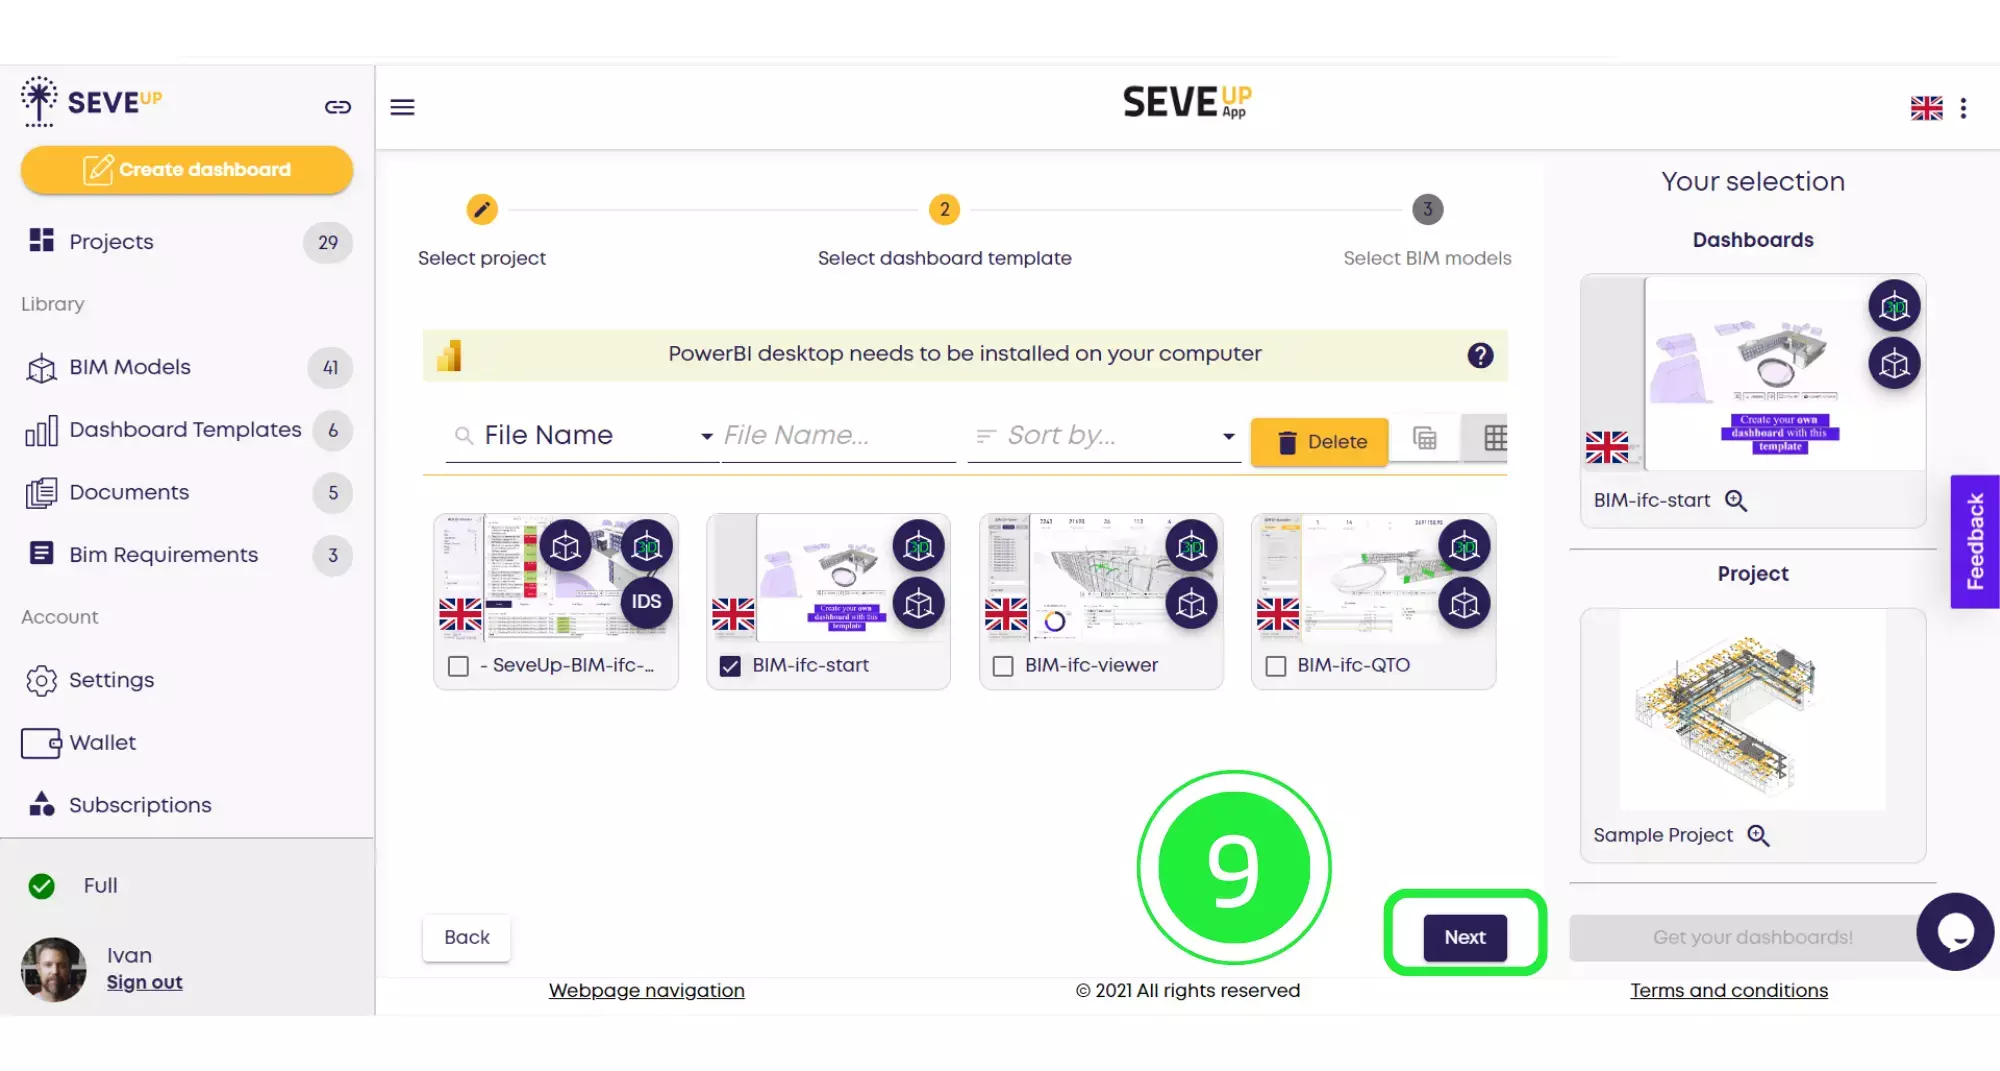
Now you’ll see that the wizard has moved you onto the “Select Dashboard Template” tab. Choose your template from the ones shown by clicking on the small box to highlight it with a tick. You’ll then see it show in the right hand pane next to the “Project” you’ve chosen.
Now click on “Next” on the bottom right of the page to move onto the next part in the wizard.
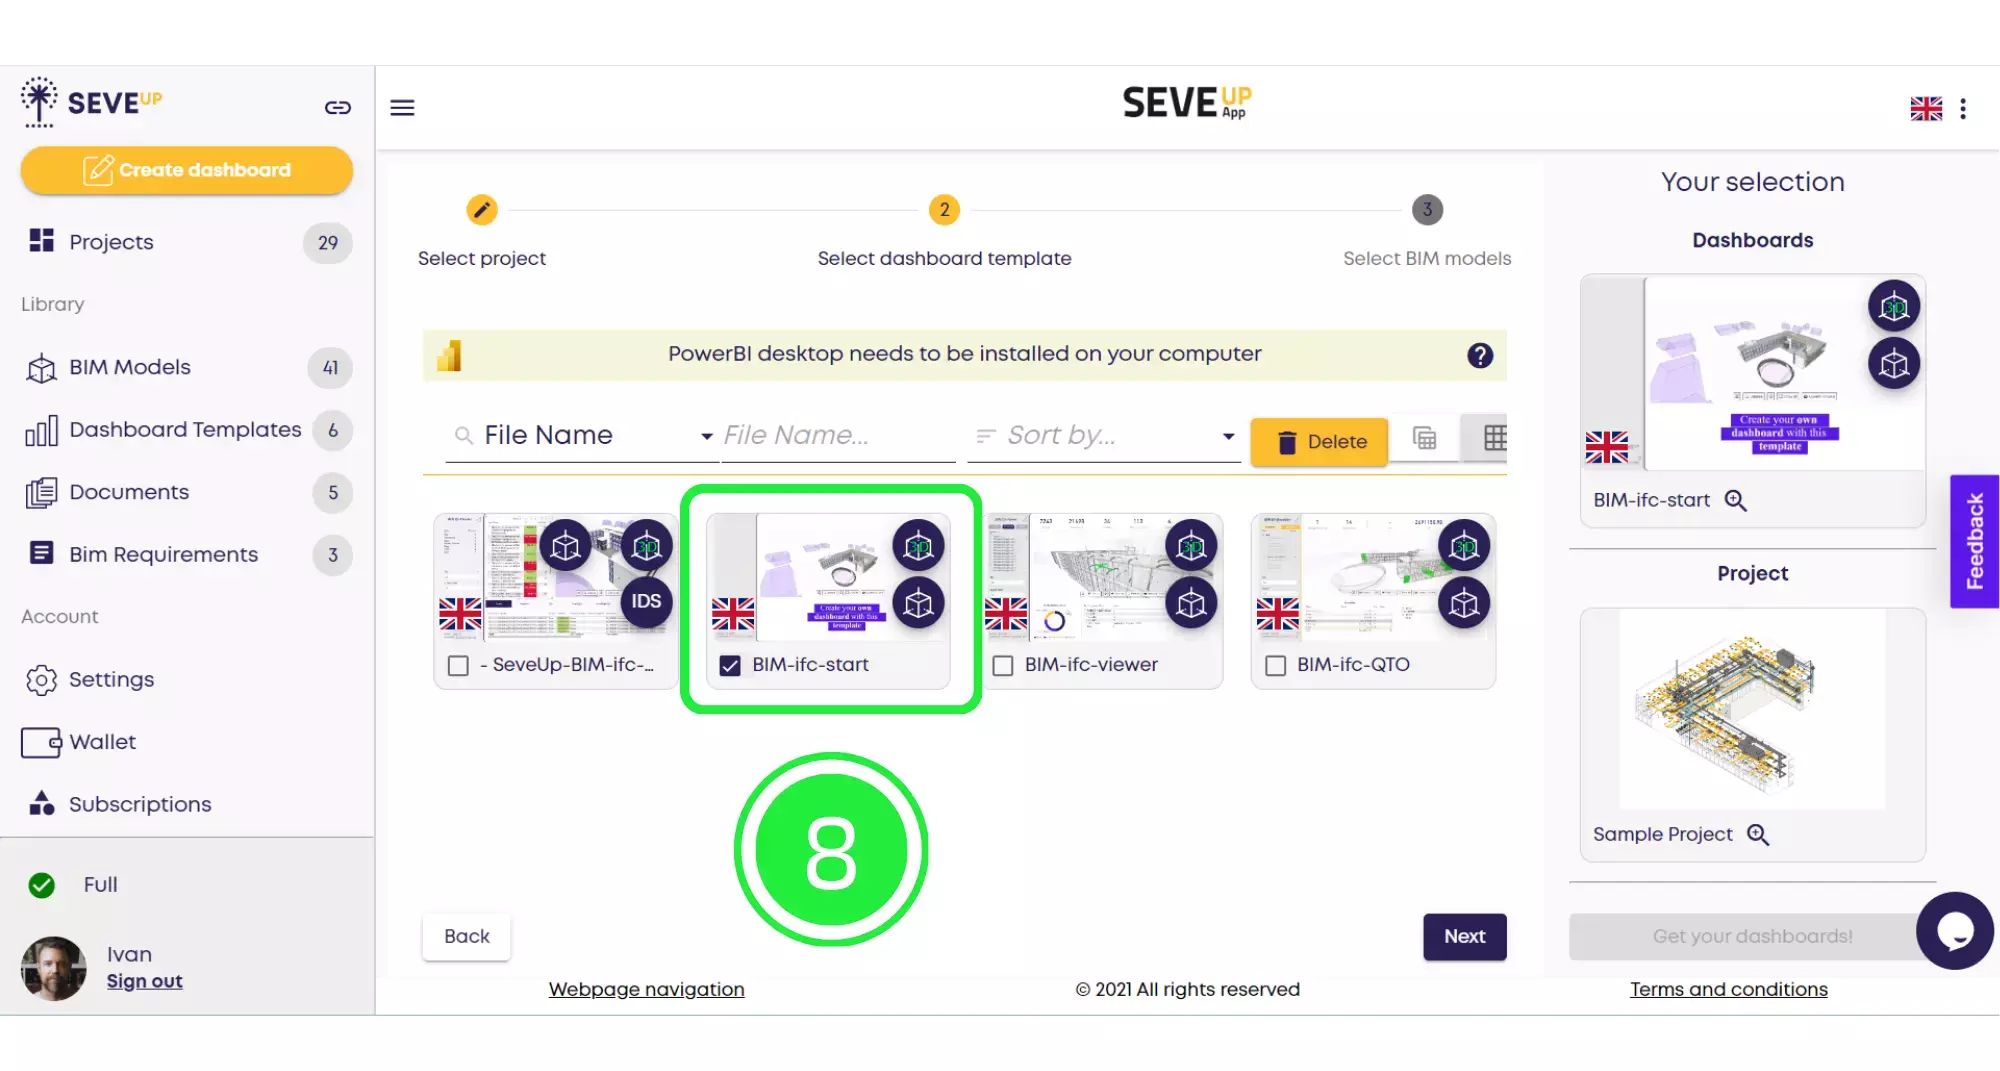
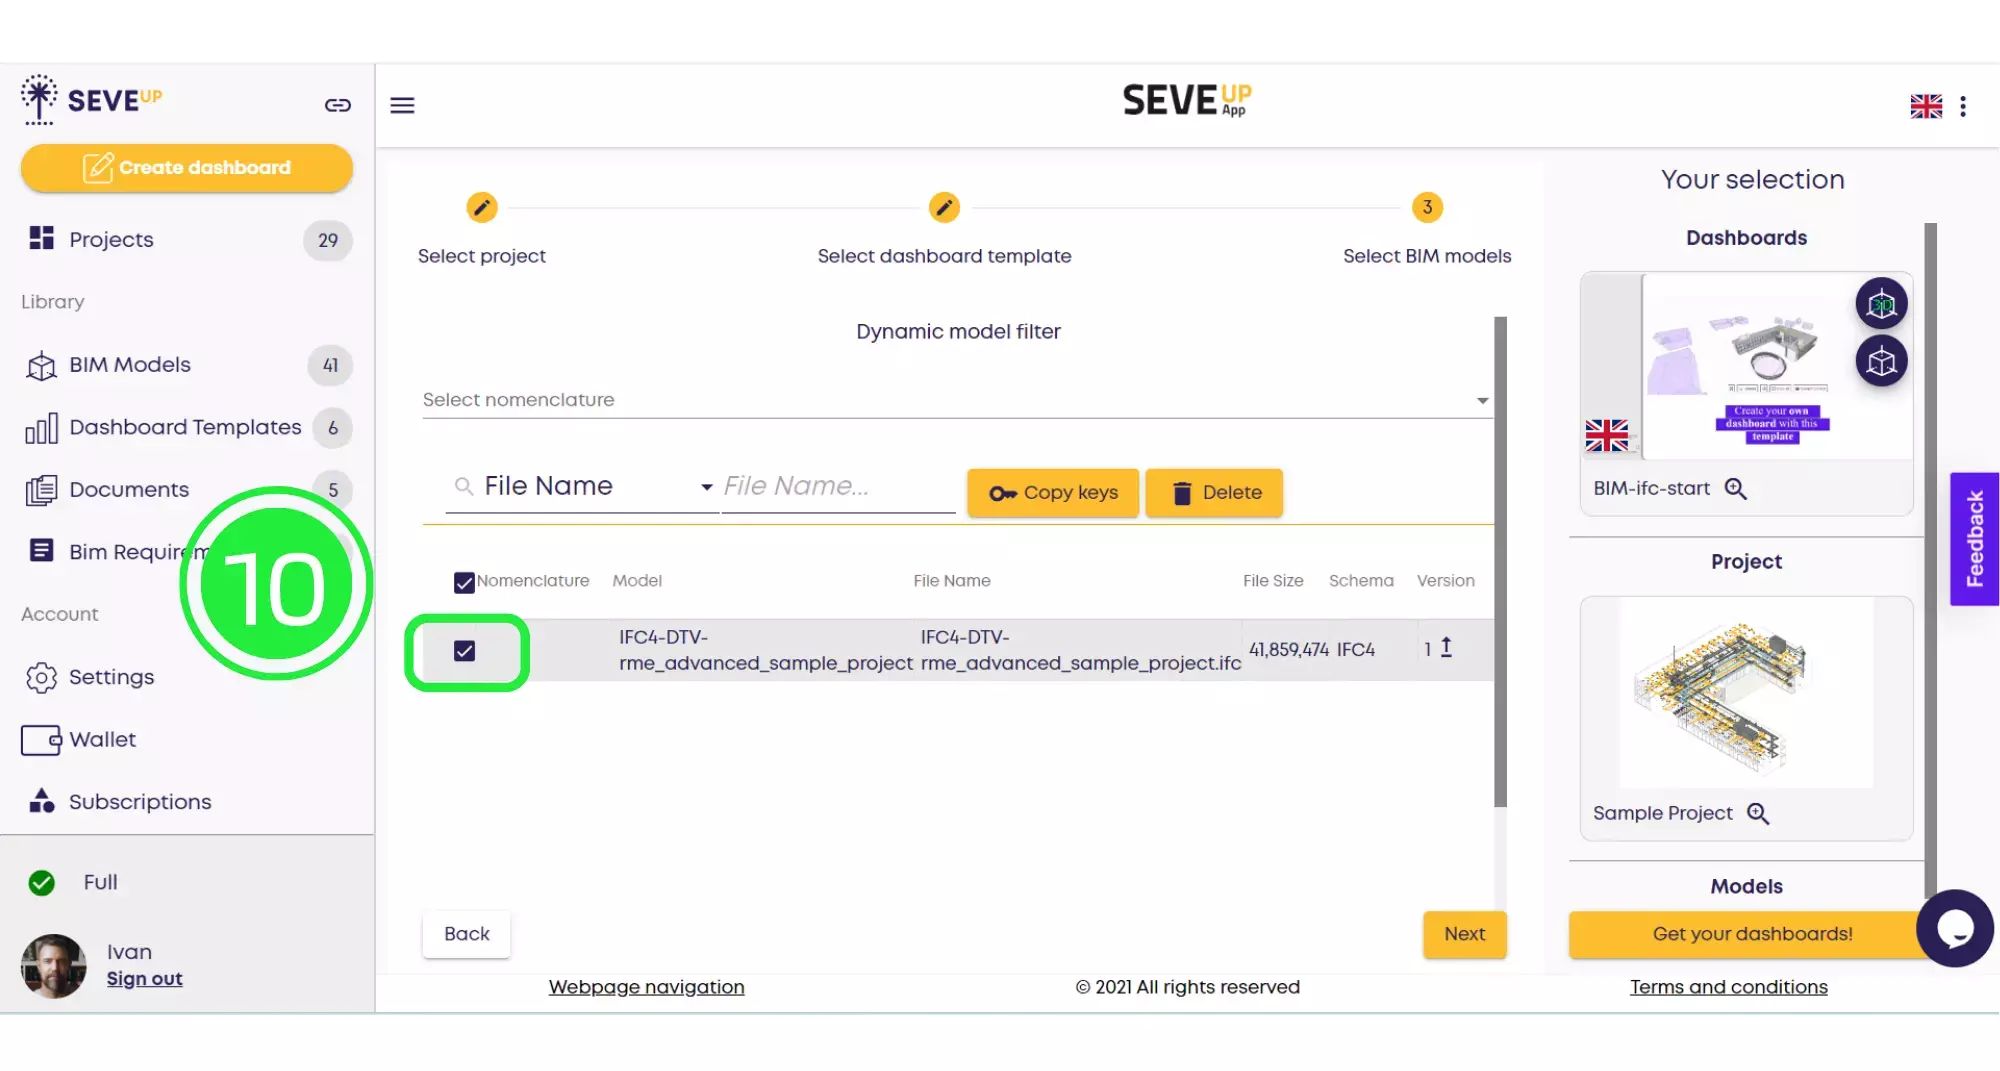
Now the wizard has moved to the “Select BIM Models” tab. Click on the BIM model you would like to use by highlighting the small box with a tick.
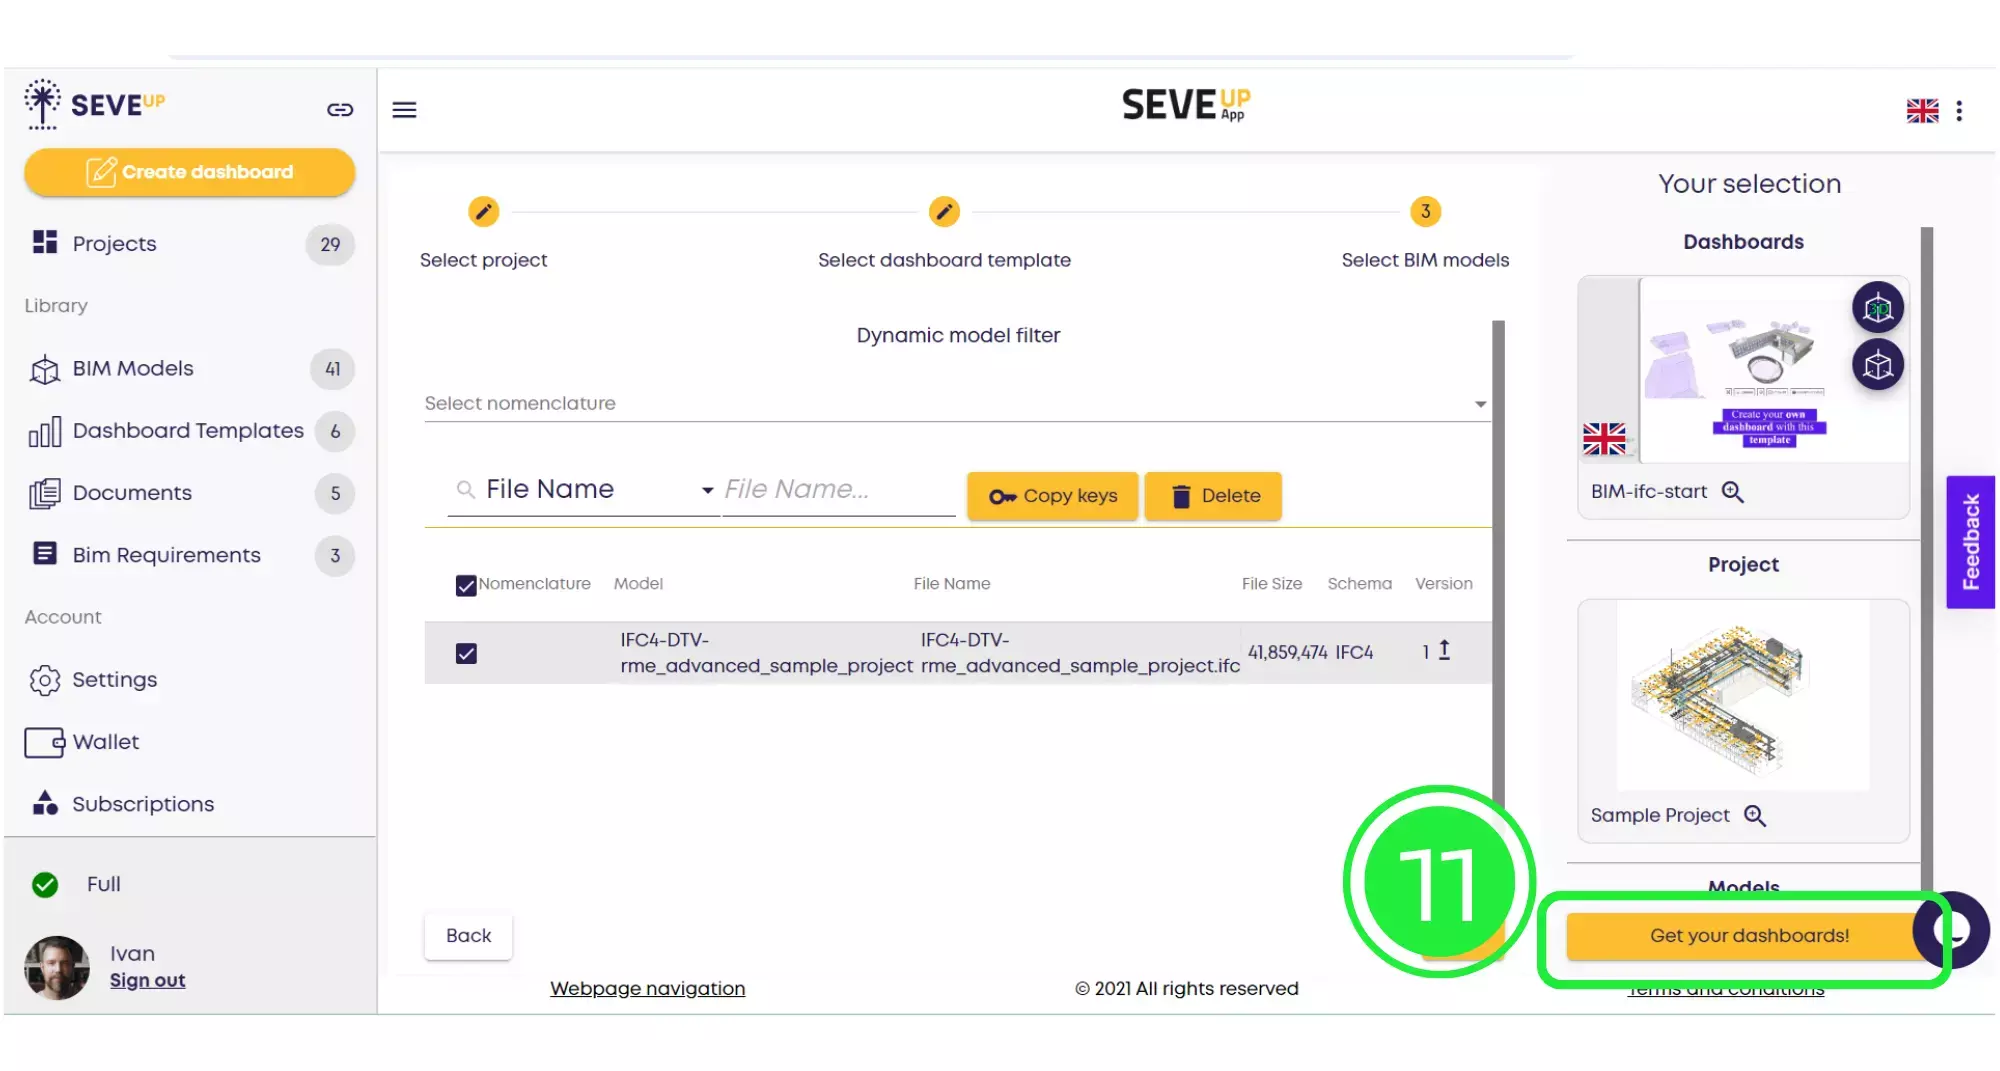
Now click on “Get Your Dashboards!” and your dashboard will automatically download onto your computer.
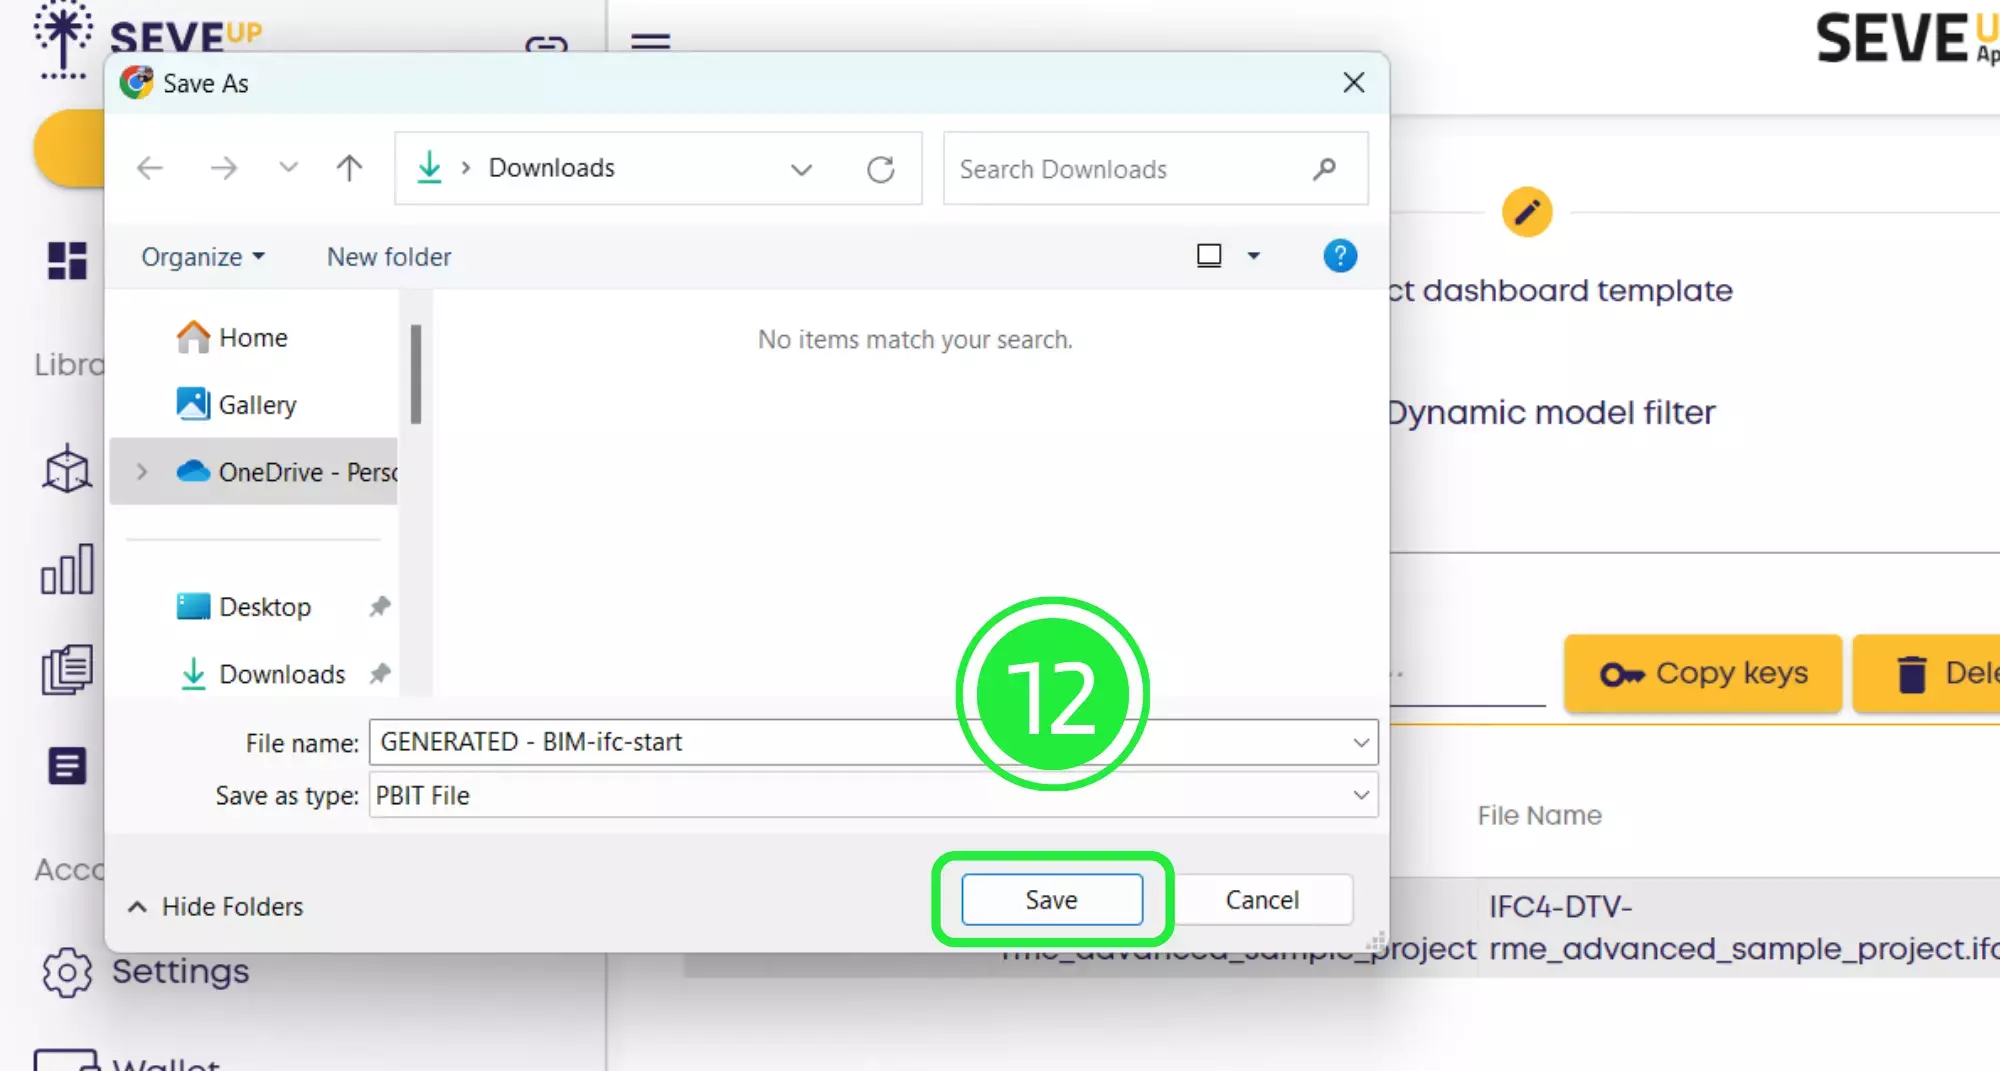
Click on the “Save” button to save your project to your computer.
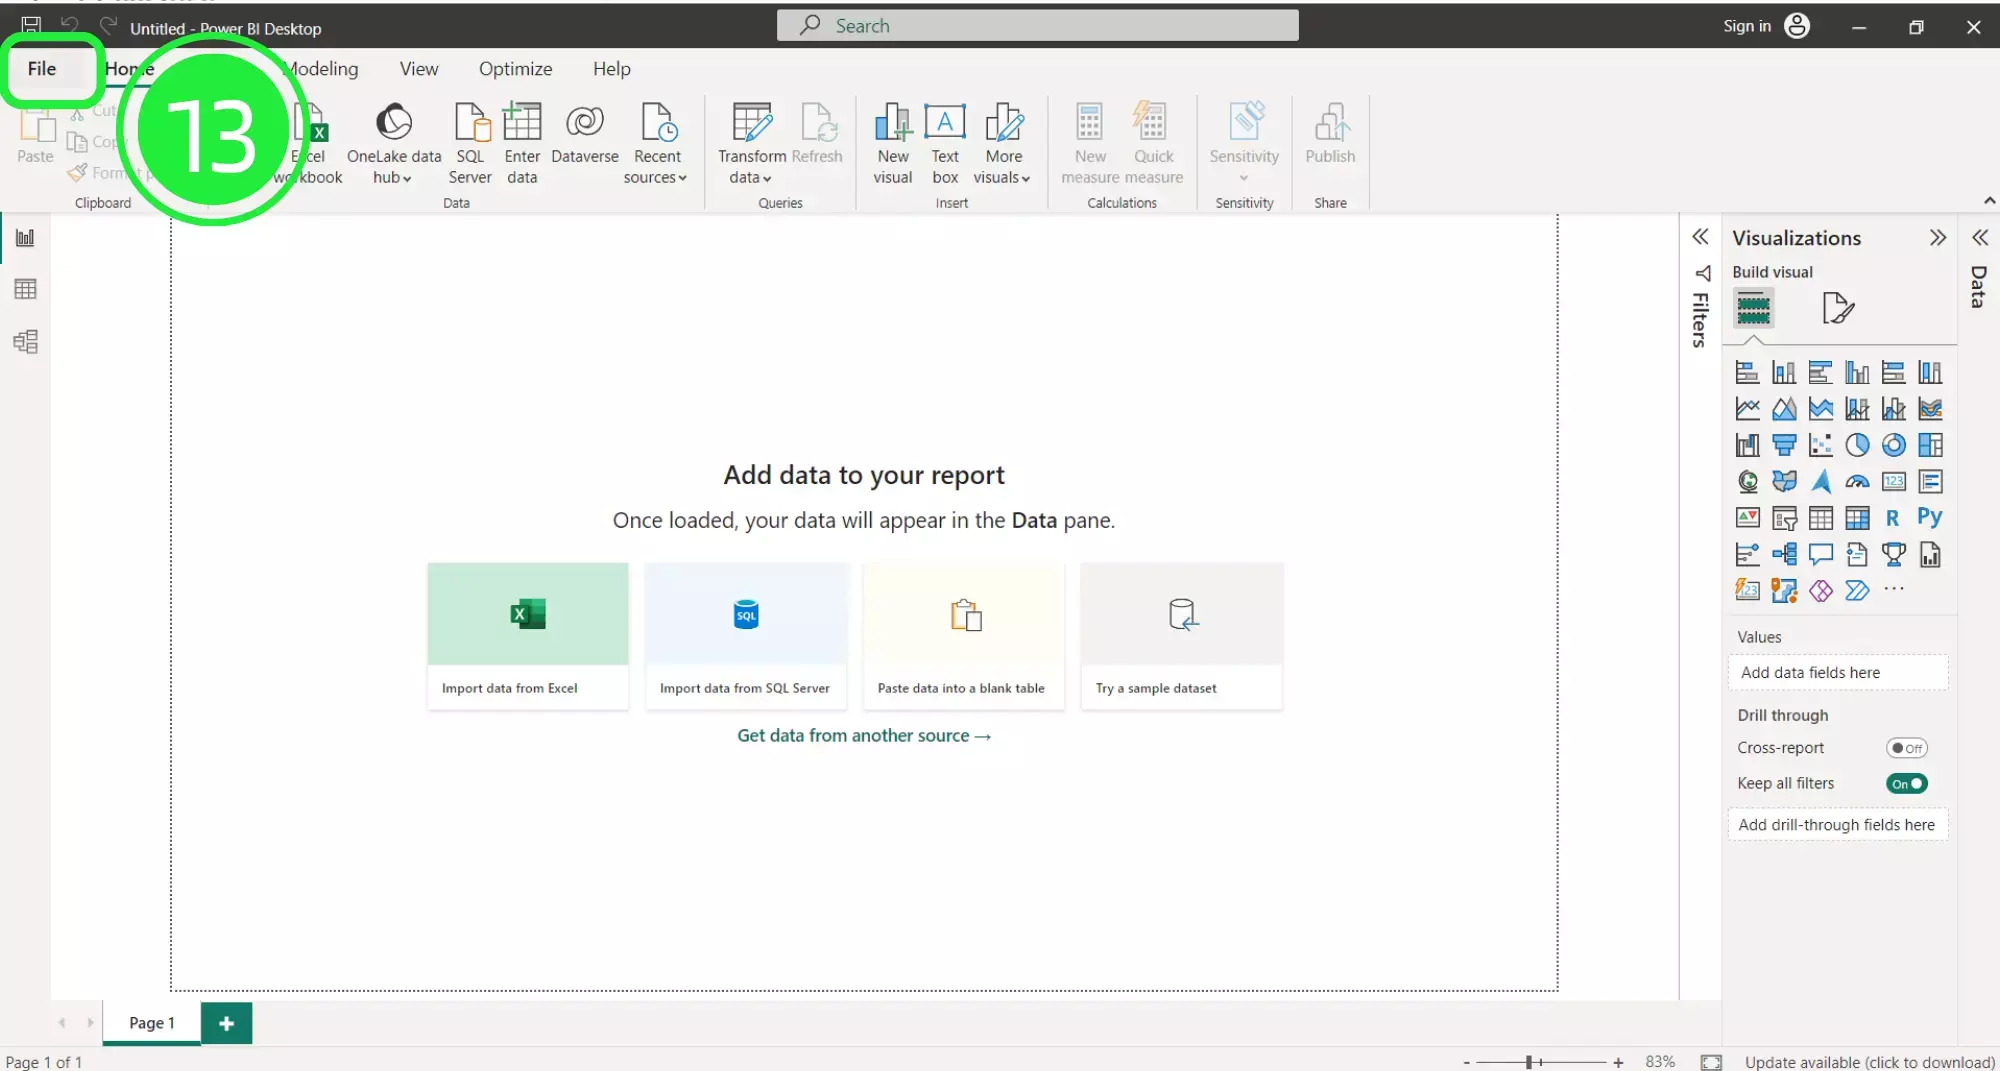
Open up Microsoft Power BI and click on “File” on the top left of the page.
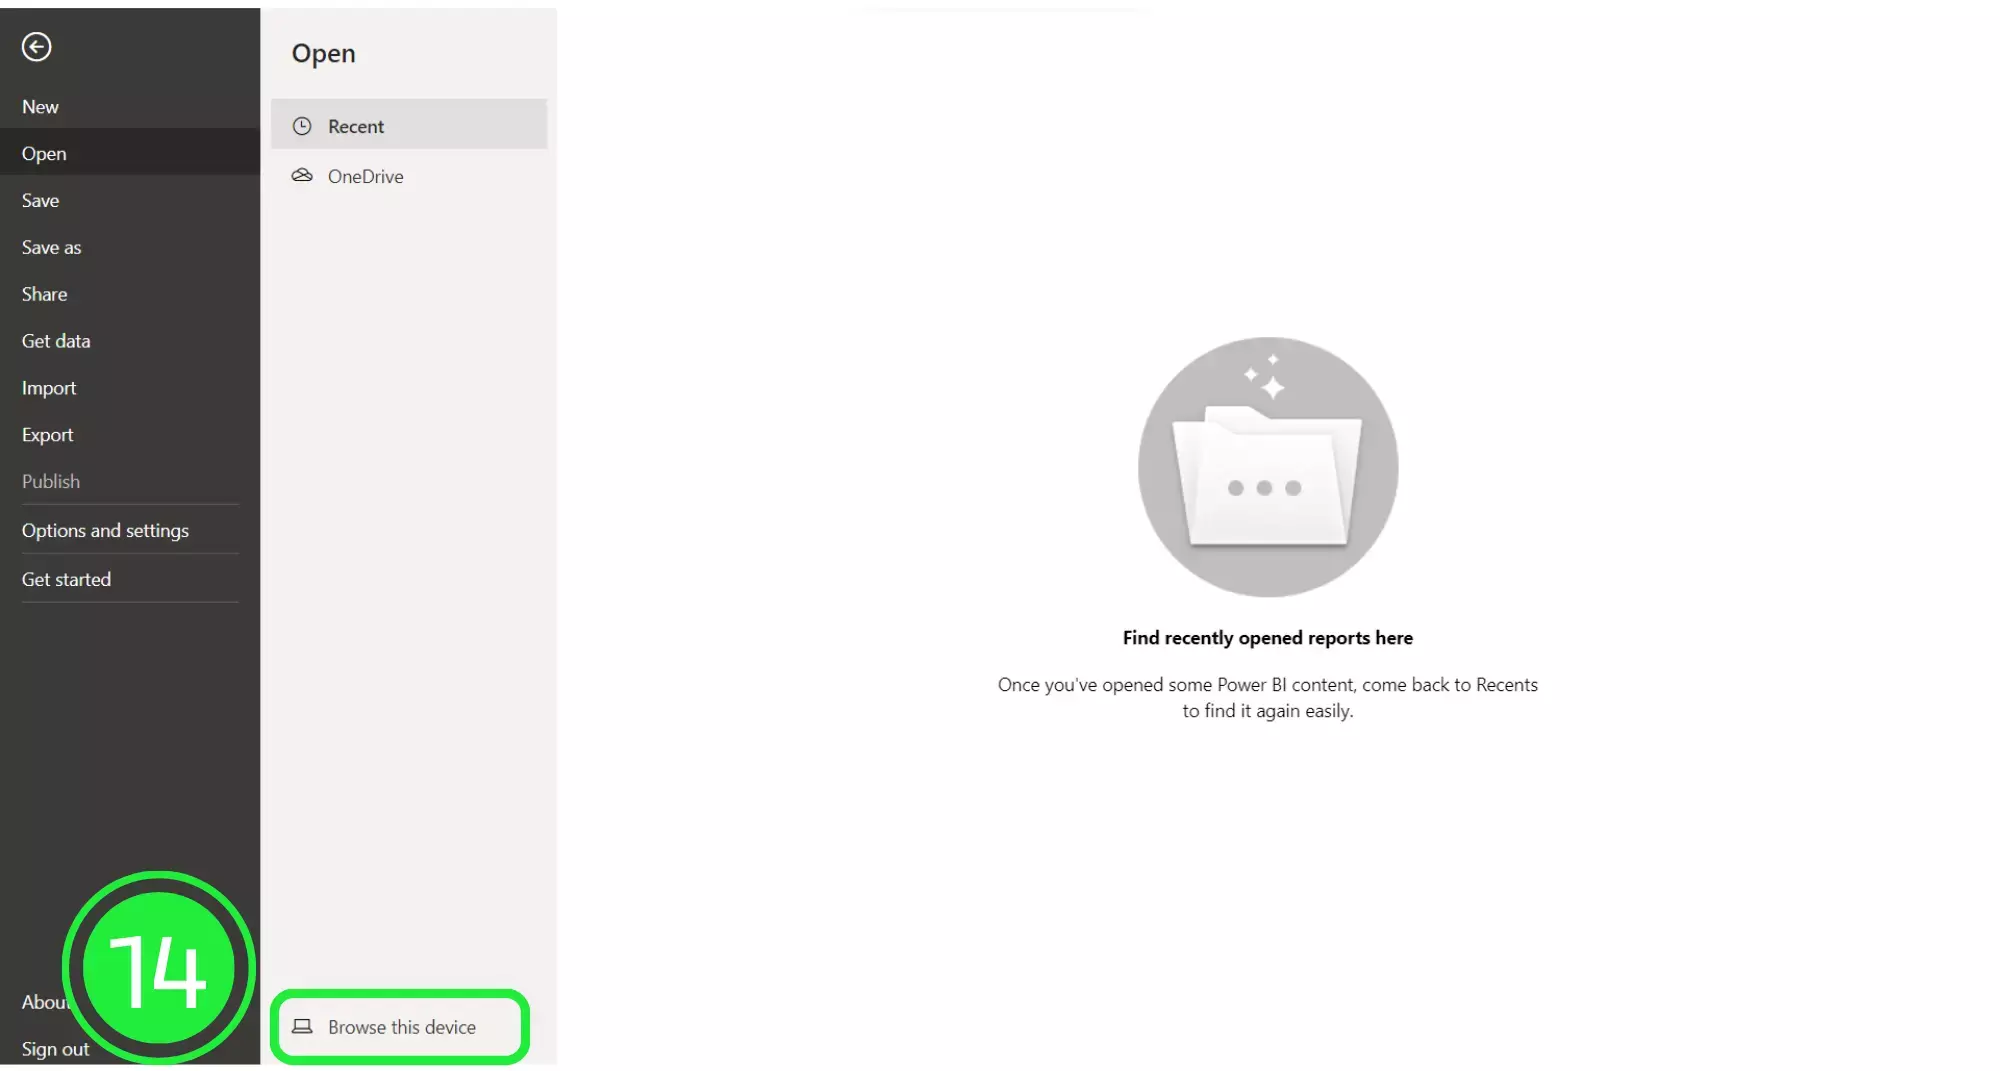
A menu will open up. Click on the “Browse this device” button at the bottom of the screen to search for your newly downloaded dashboard.
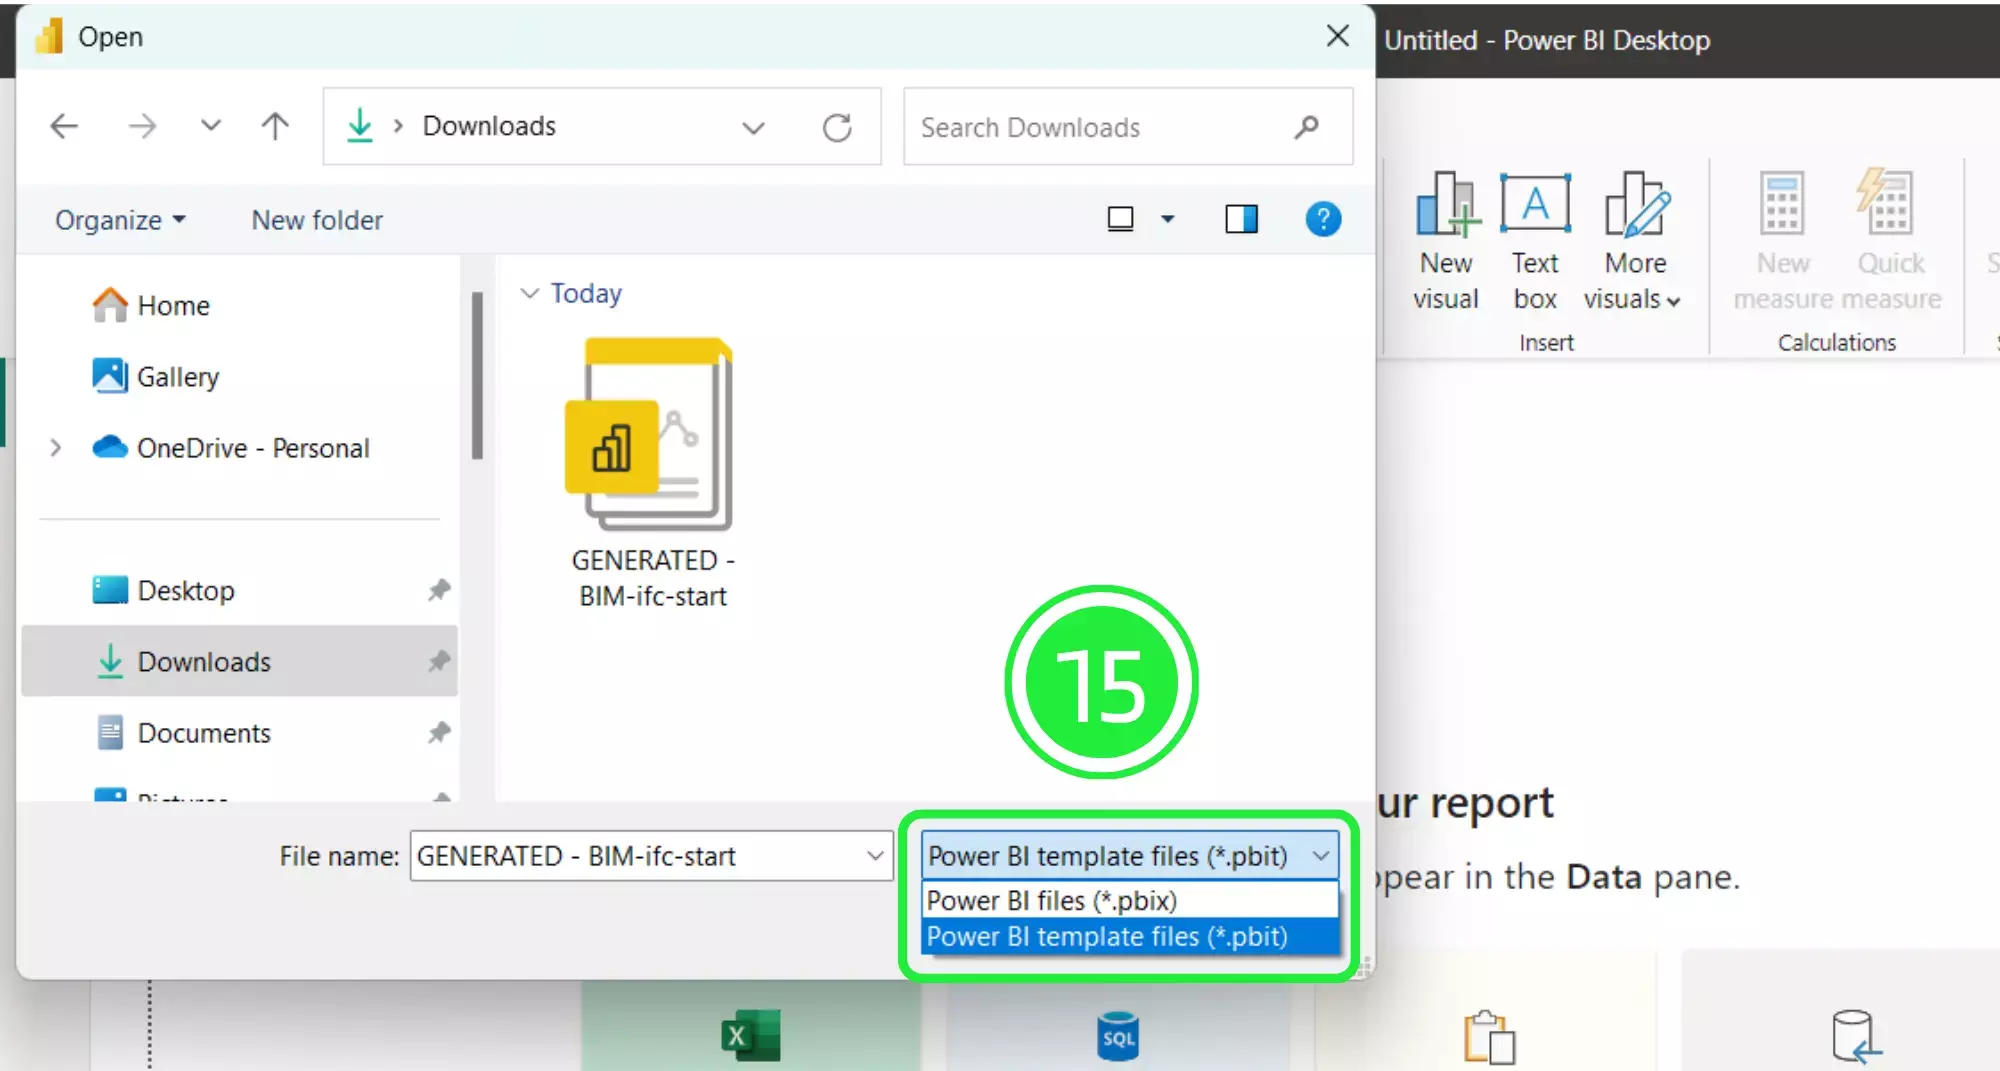
On the “Open” window, go to the bottom right and choose the correct file extension. Choose “Power BI Template Files (*pbit). Any files of this type will now show in the window.
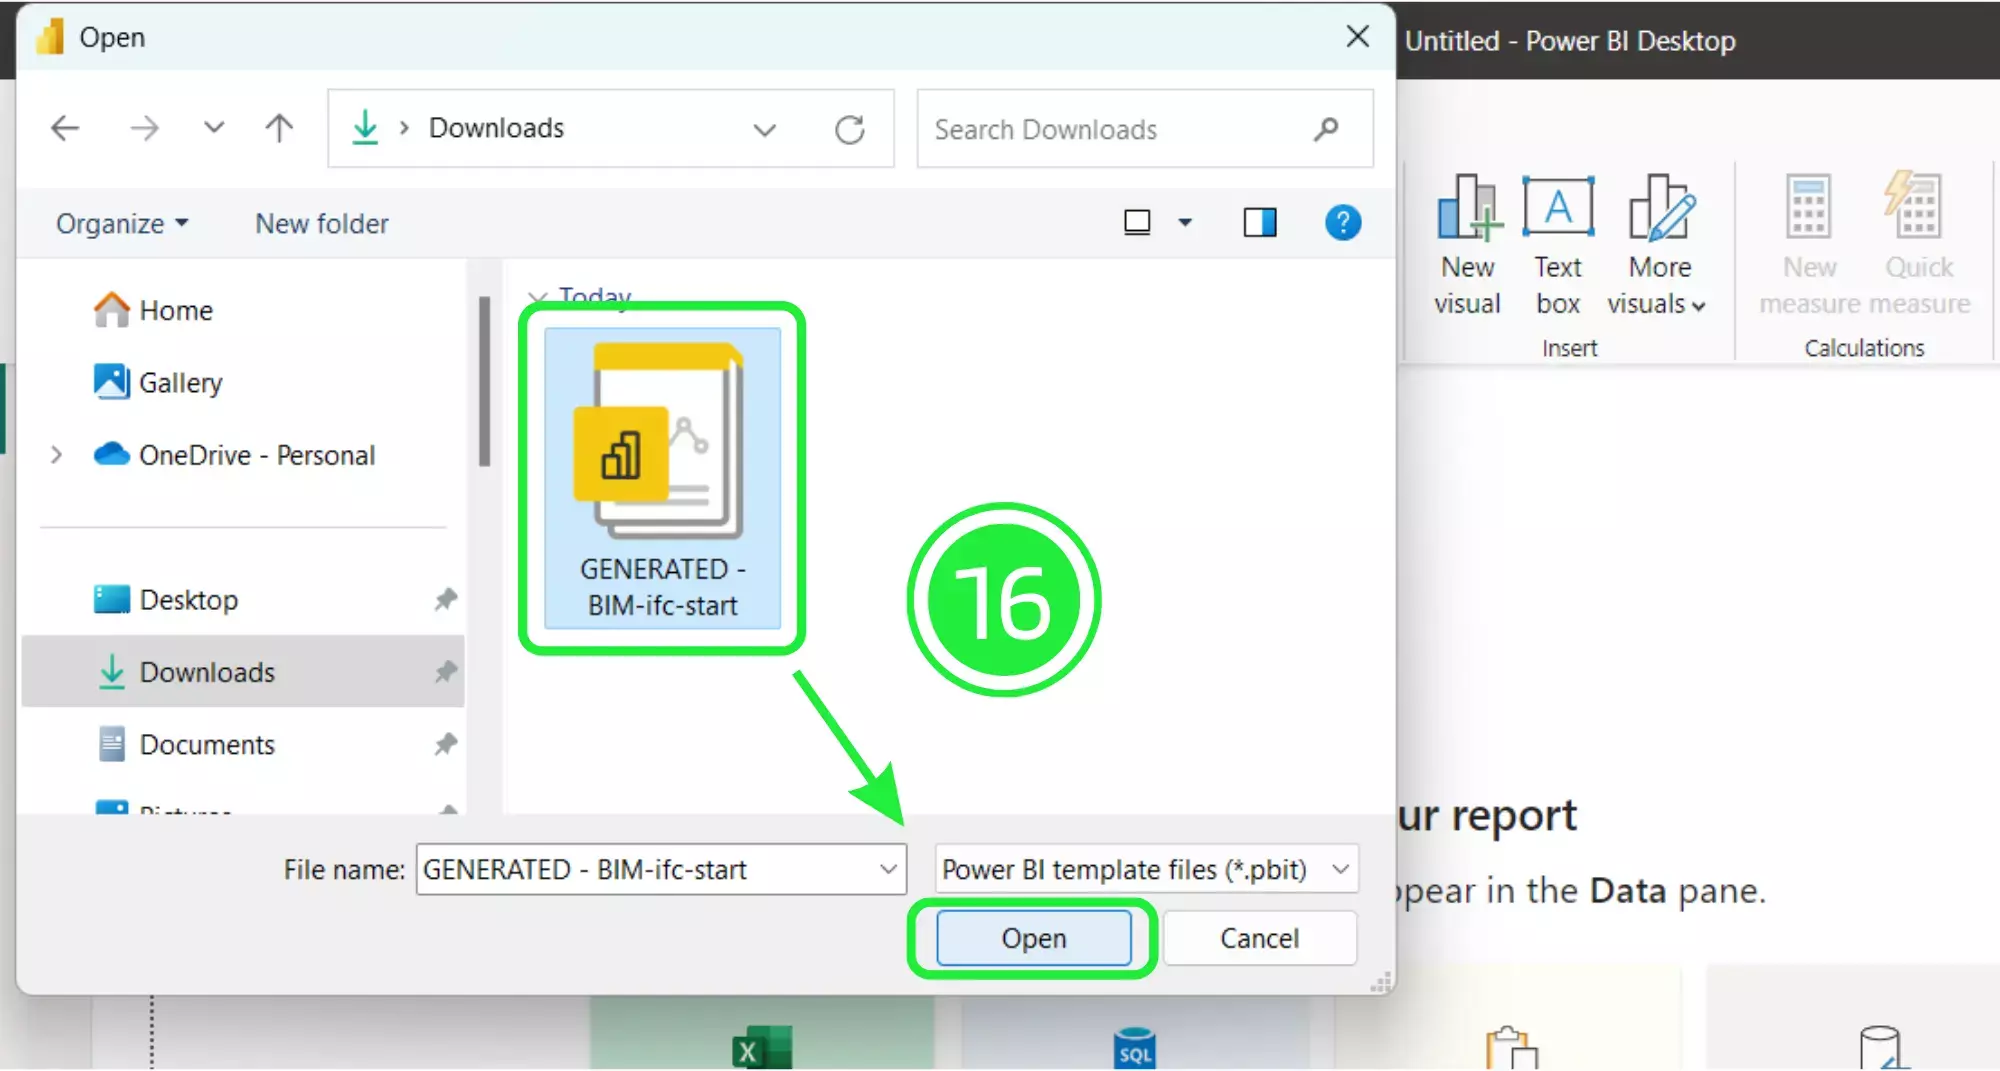
Select your newly downloaded template file and then click on “Open”.
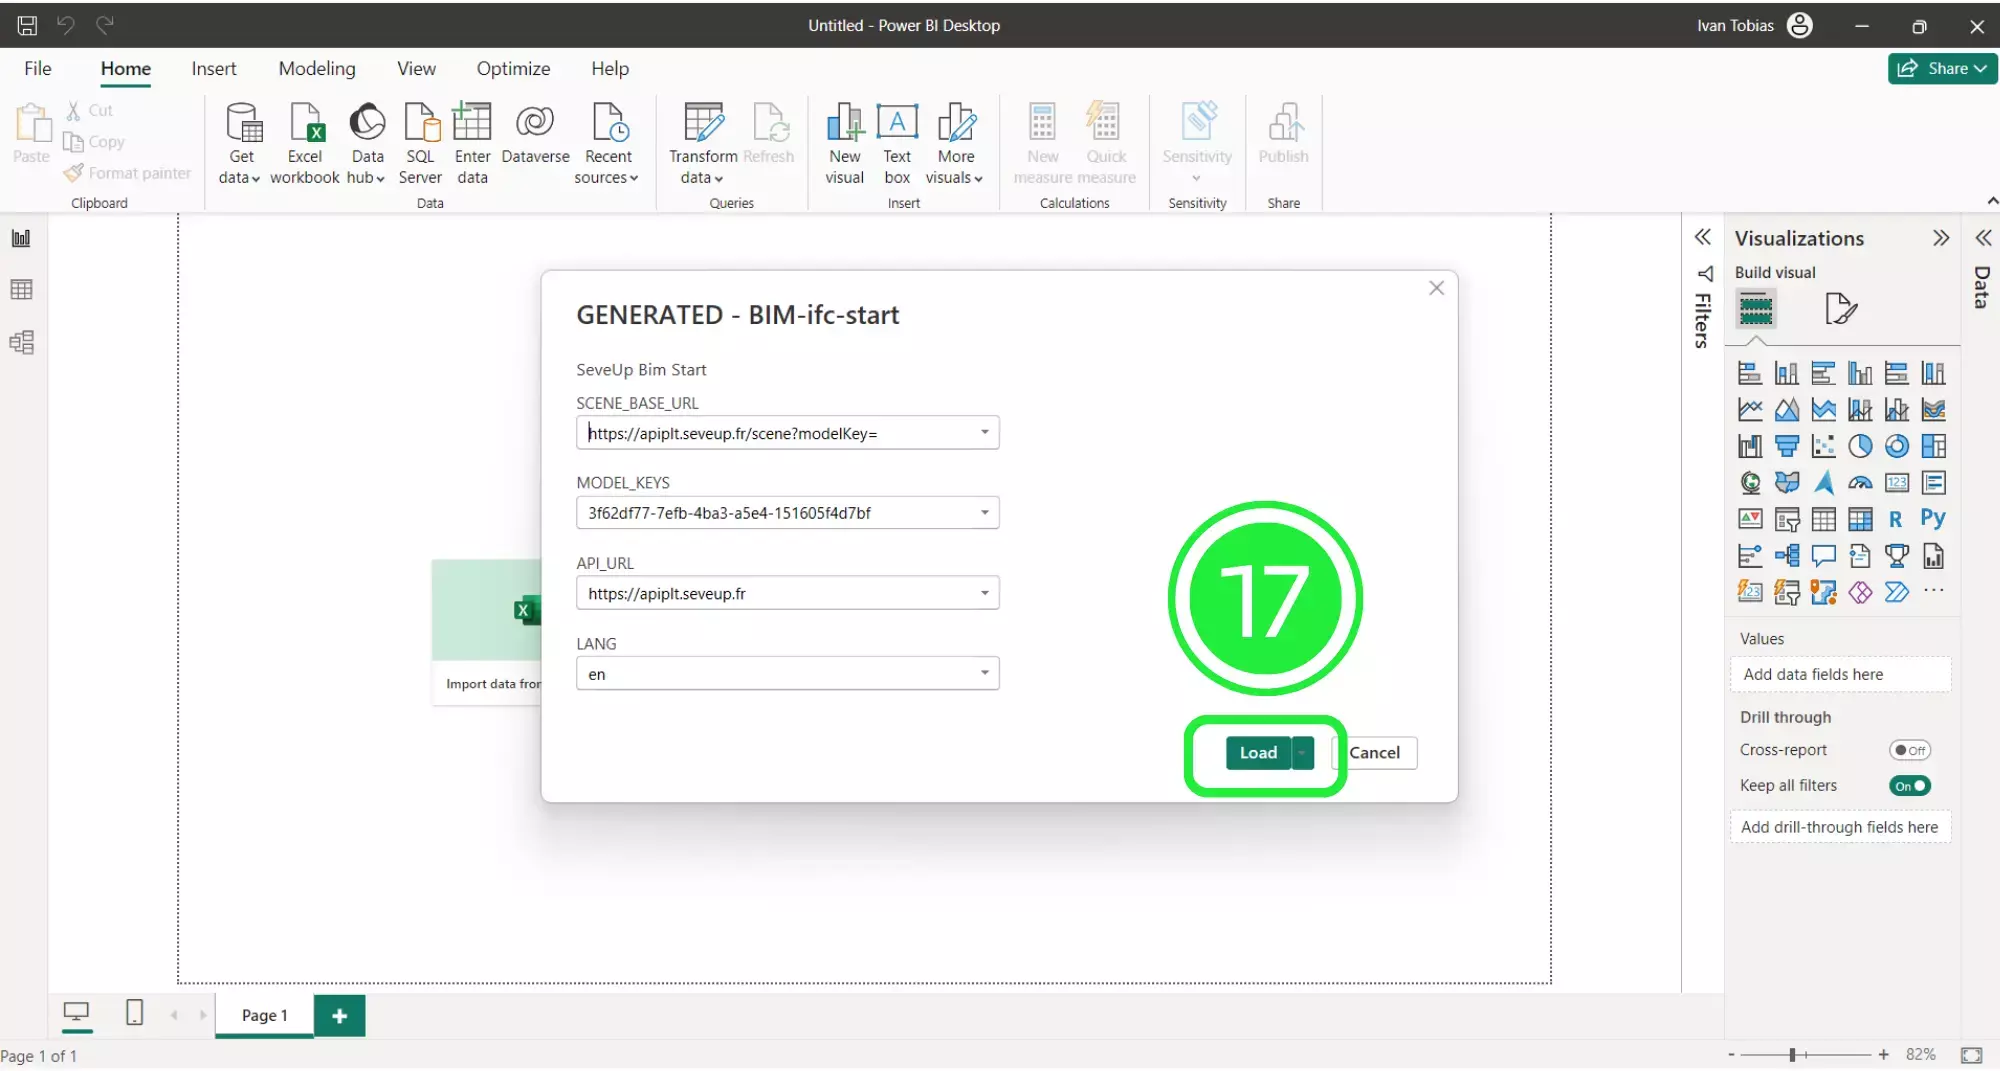
A pop-up will appear showing the file details. Click on “Load” and your Dashboard Template file will start to load in Microsoft Power BI.
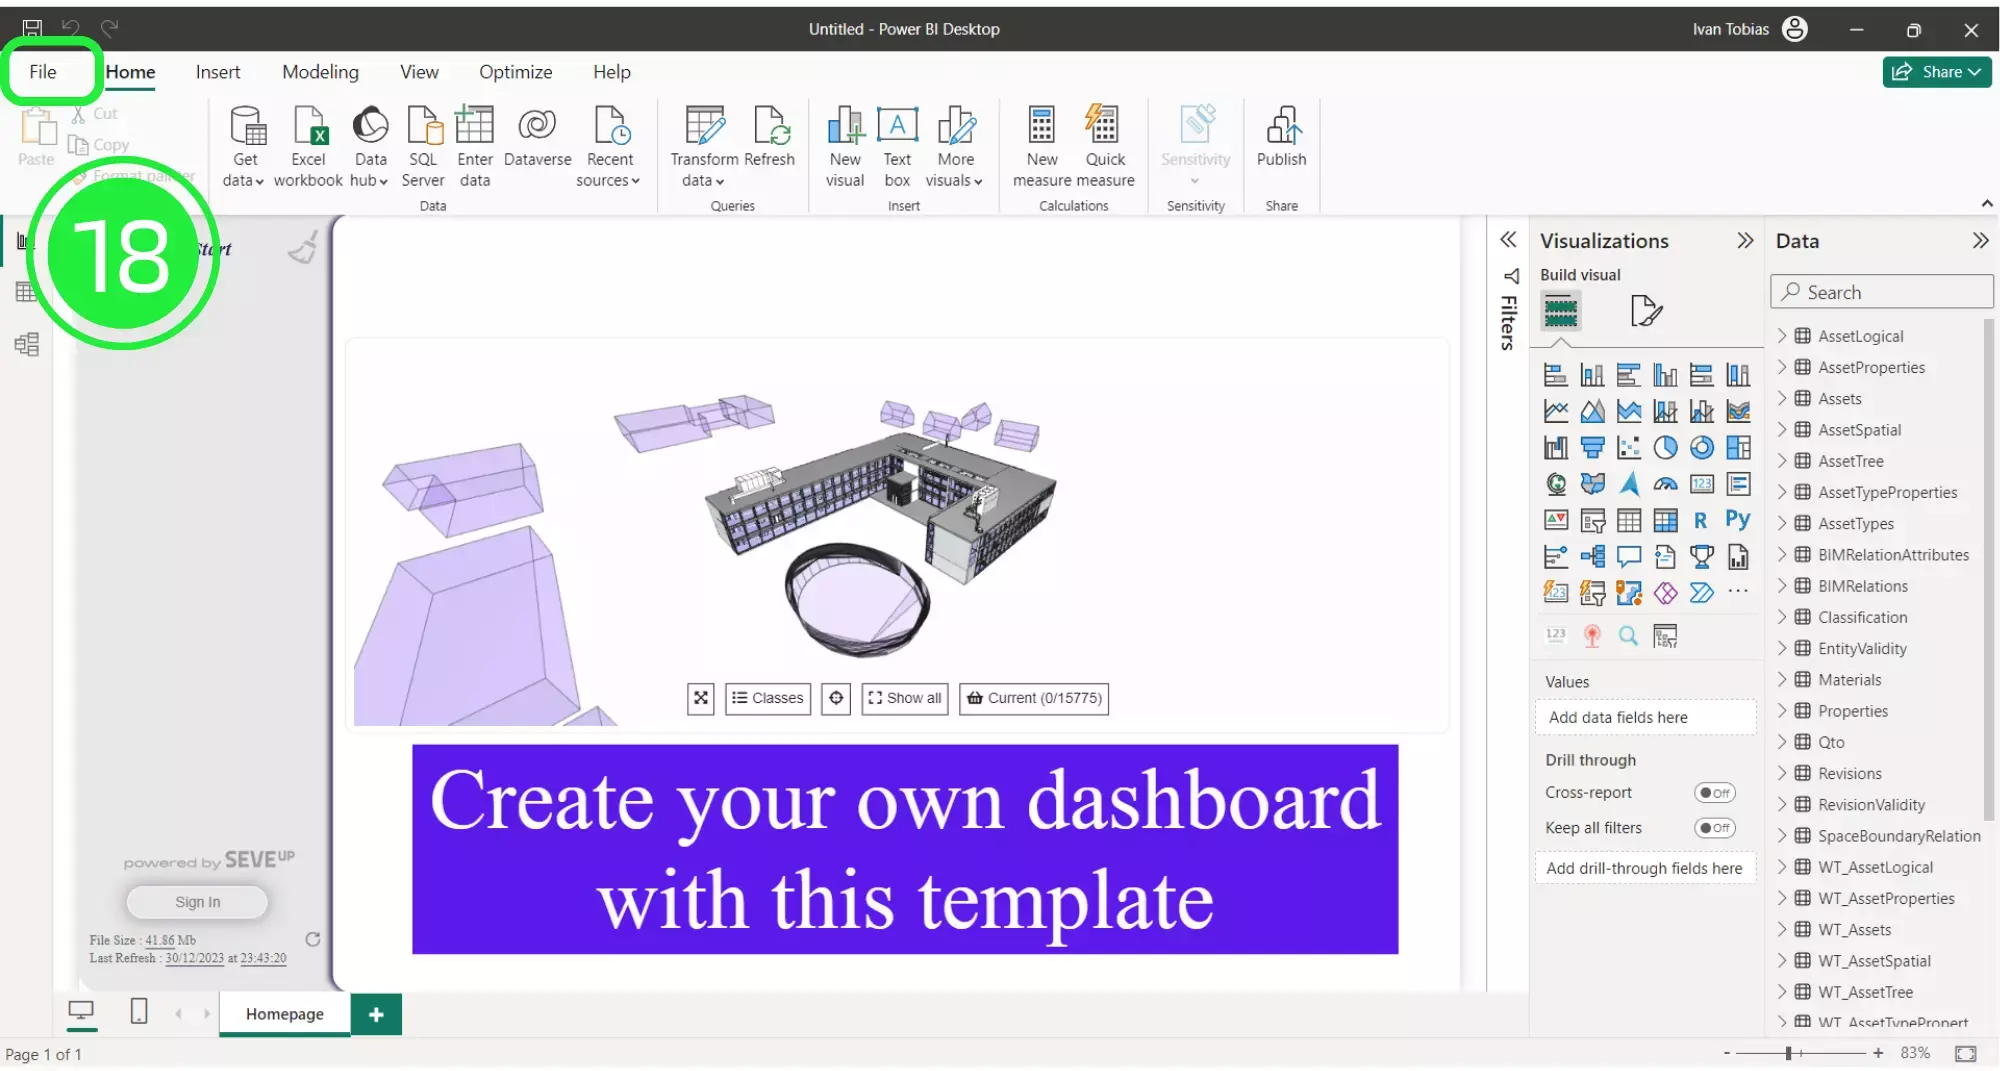
Once your new dashboard template has loaded, it will populate the Power BI interface with all of the BIM data that was in the files you added.
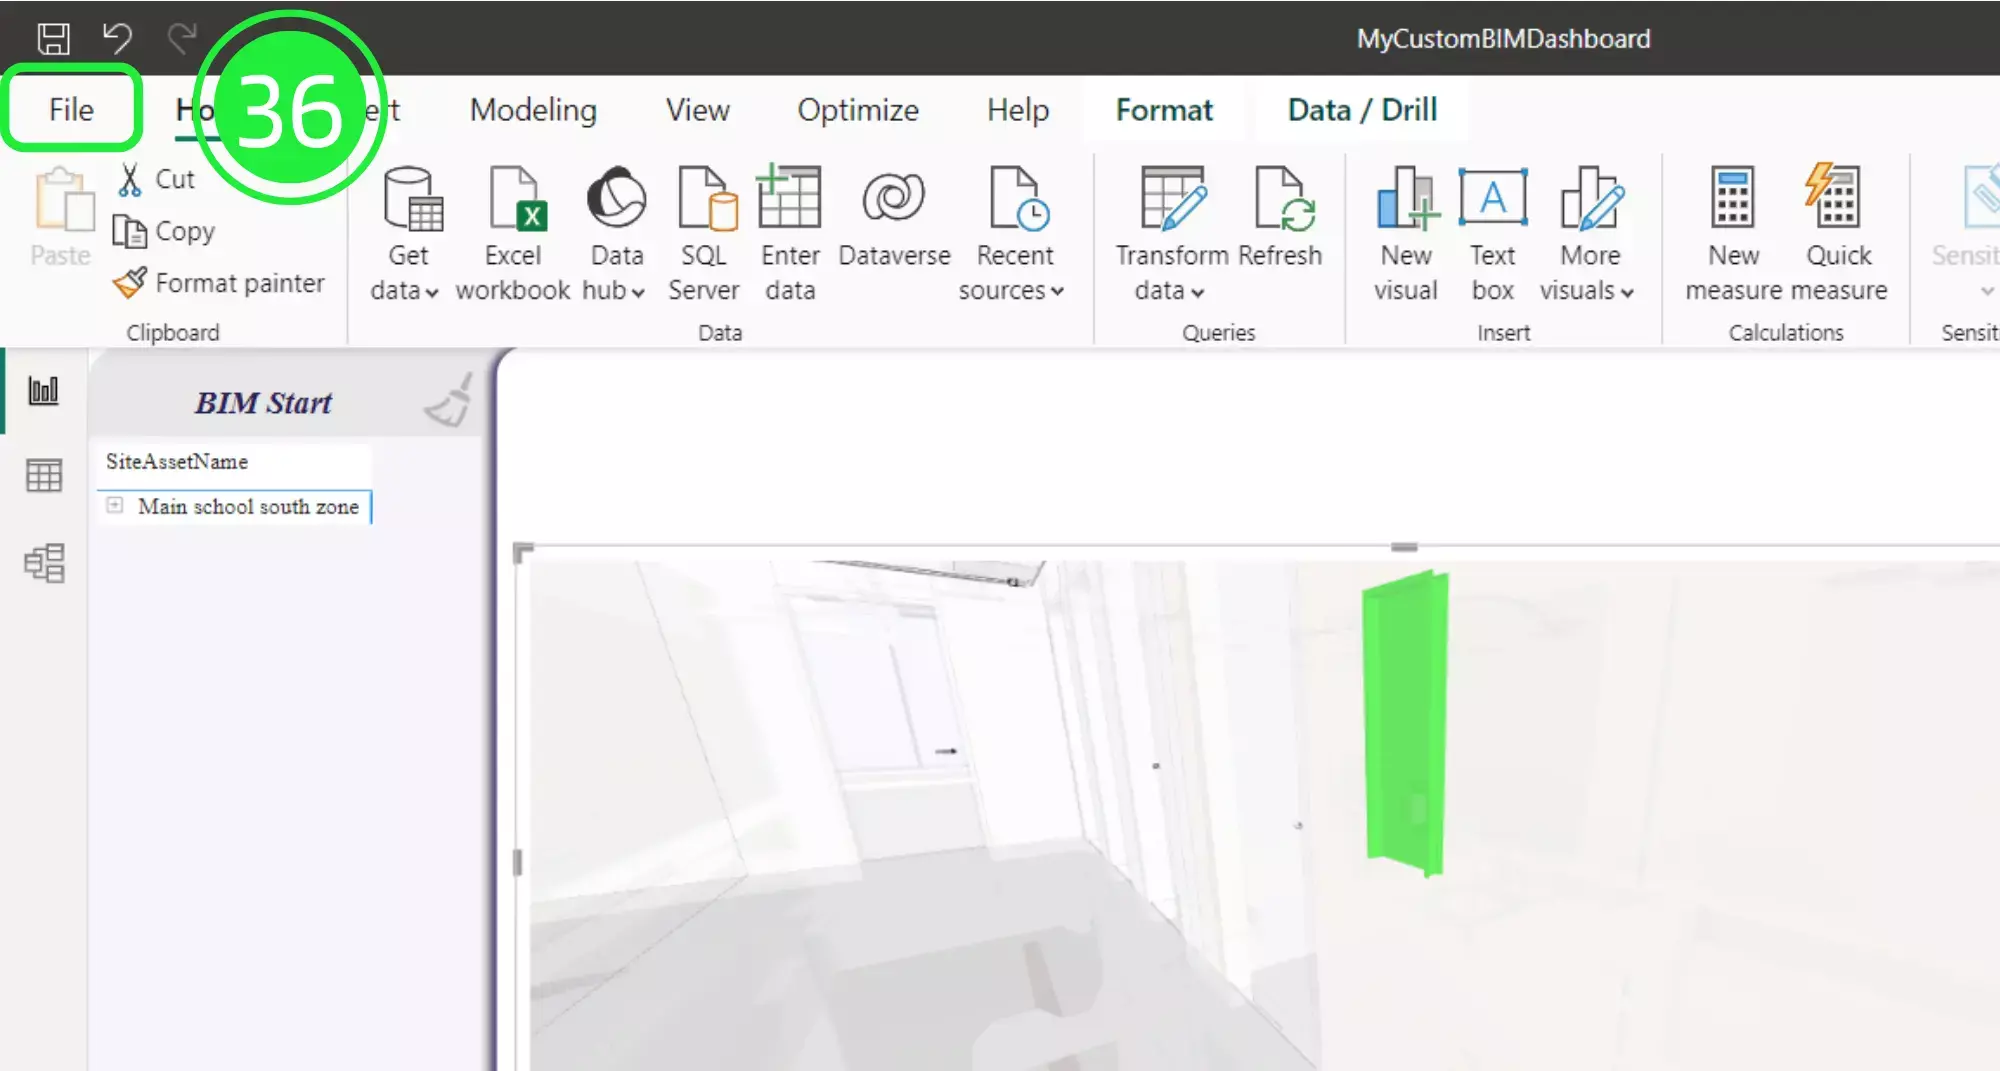
In order to build the template in Power BI you first need to save it as a Power BI file (.pbix). To do this click on “File” in the top left corner of the page. You are about to arrange and exhibit your BIM properties.
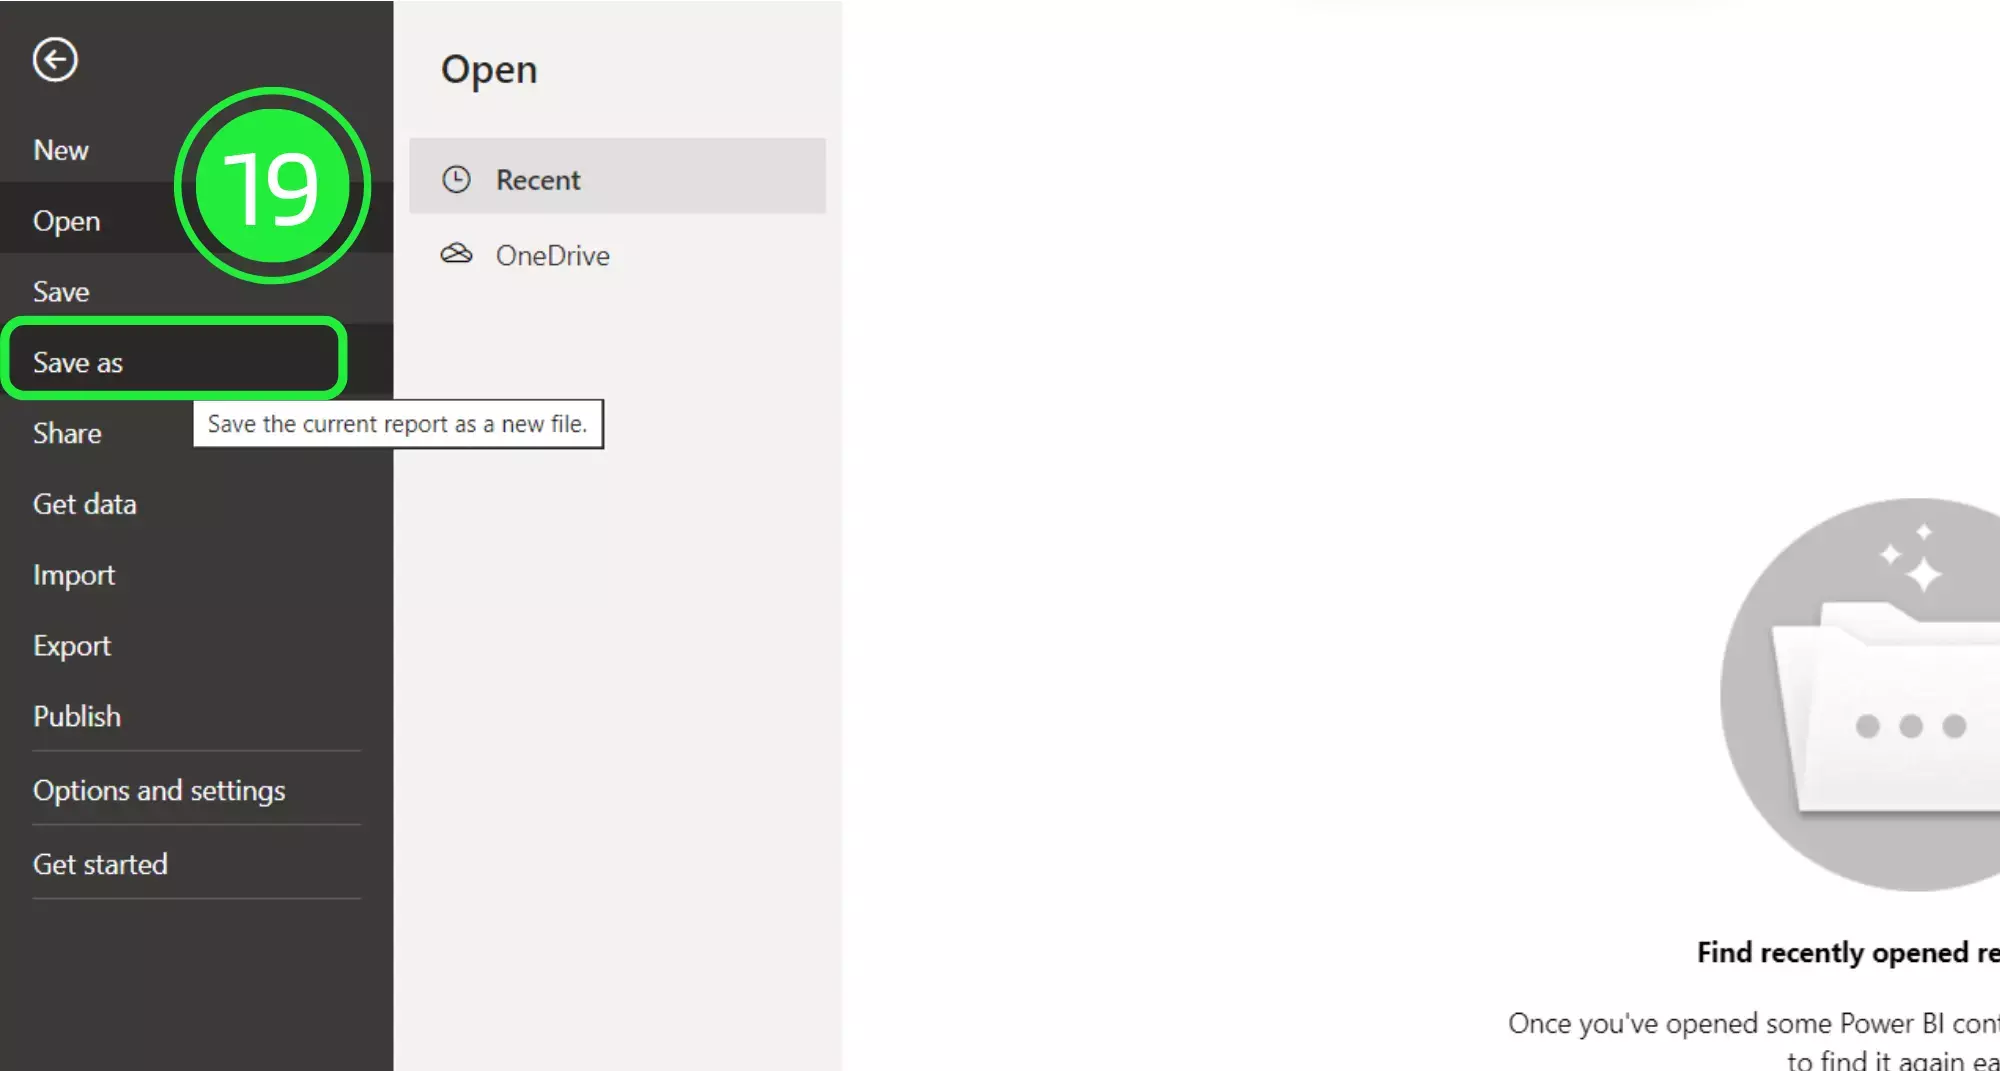
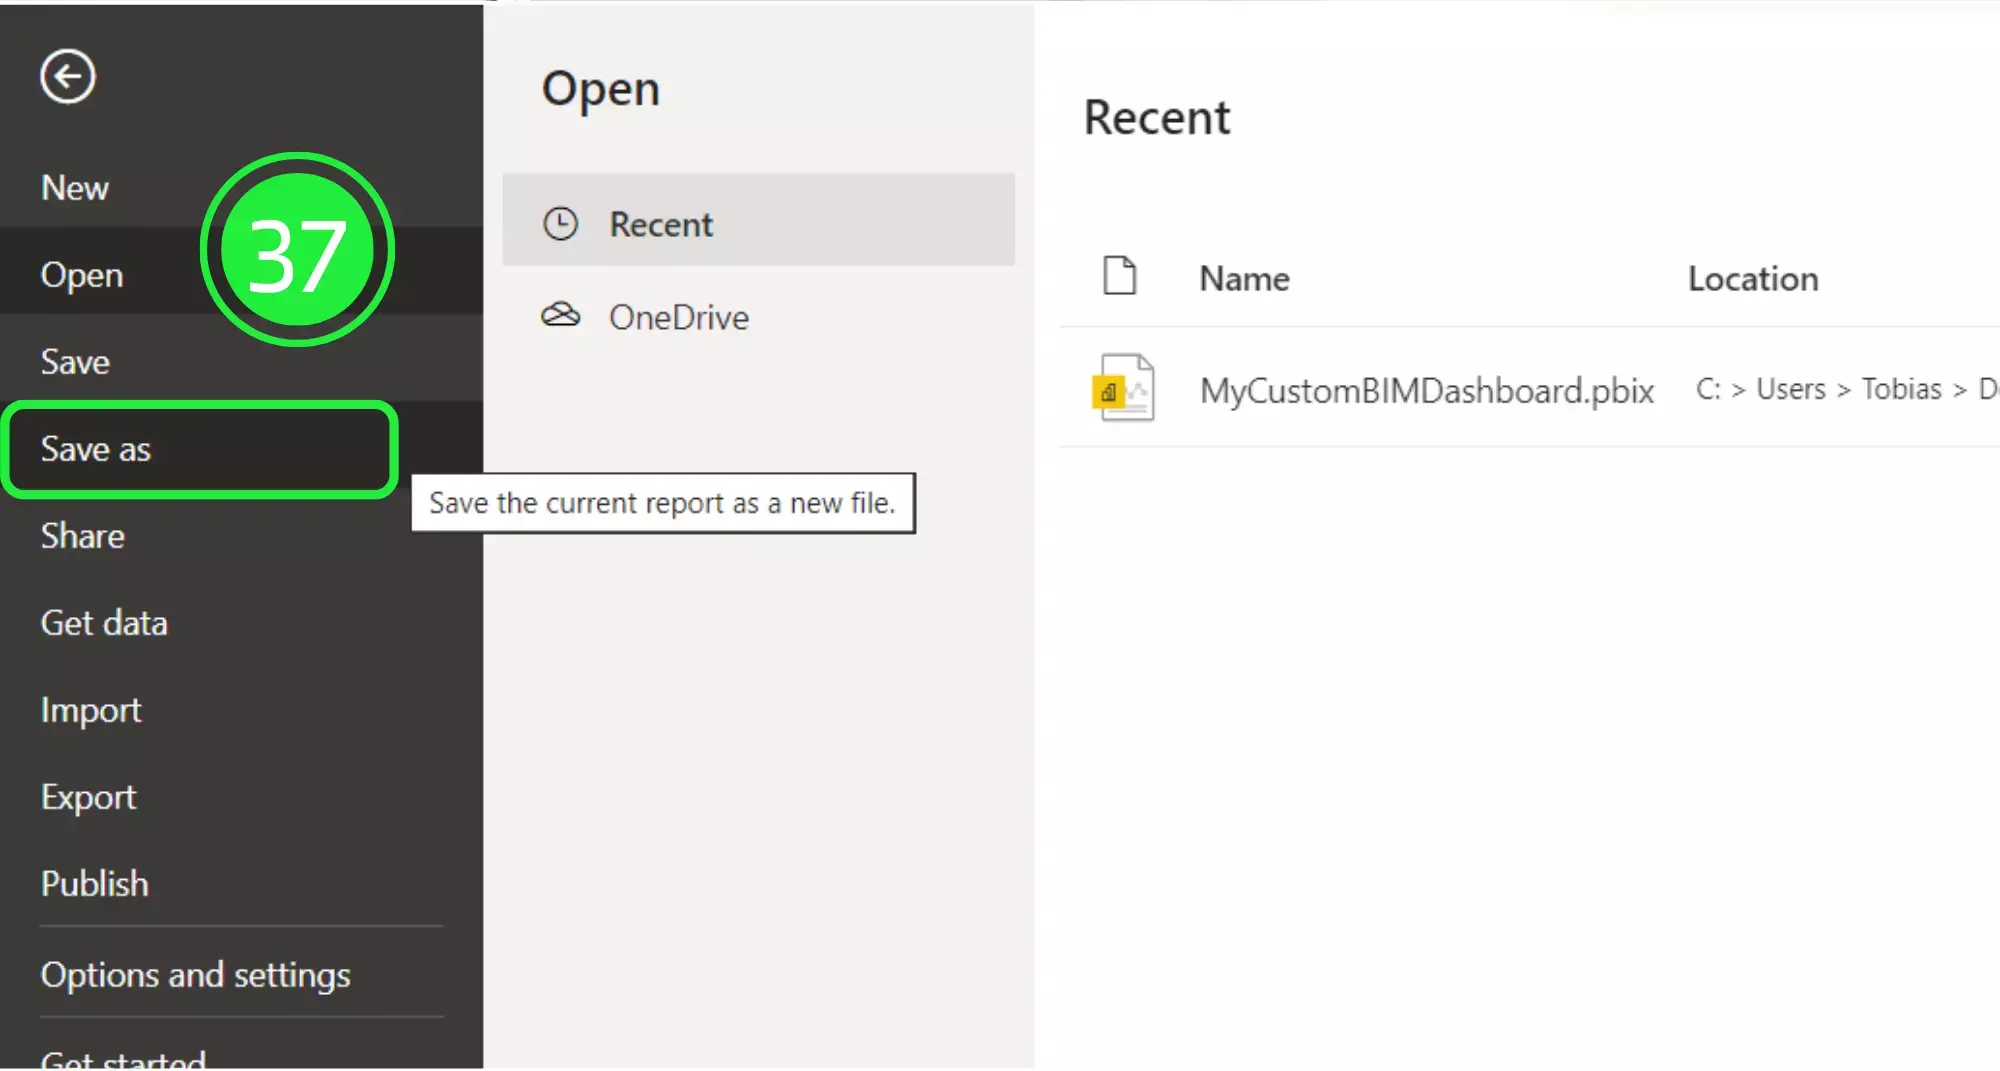
Select “Save As” in order to save your file.
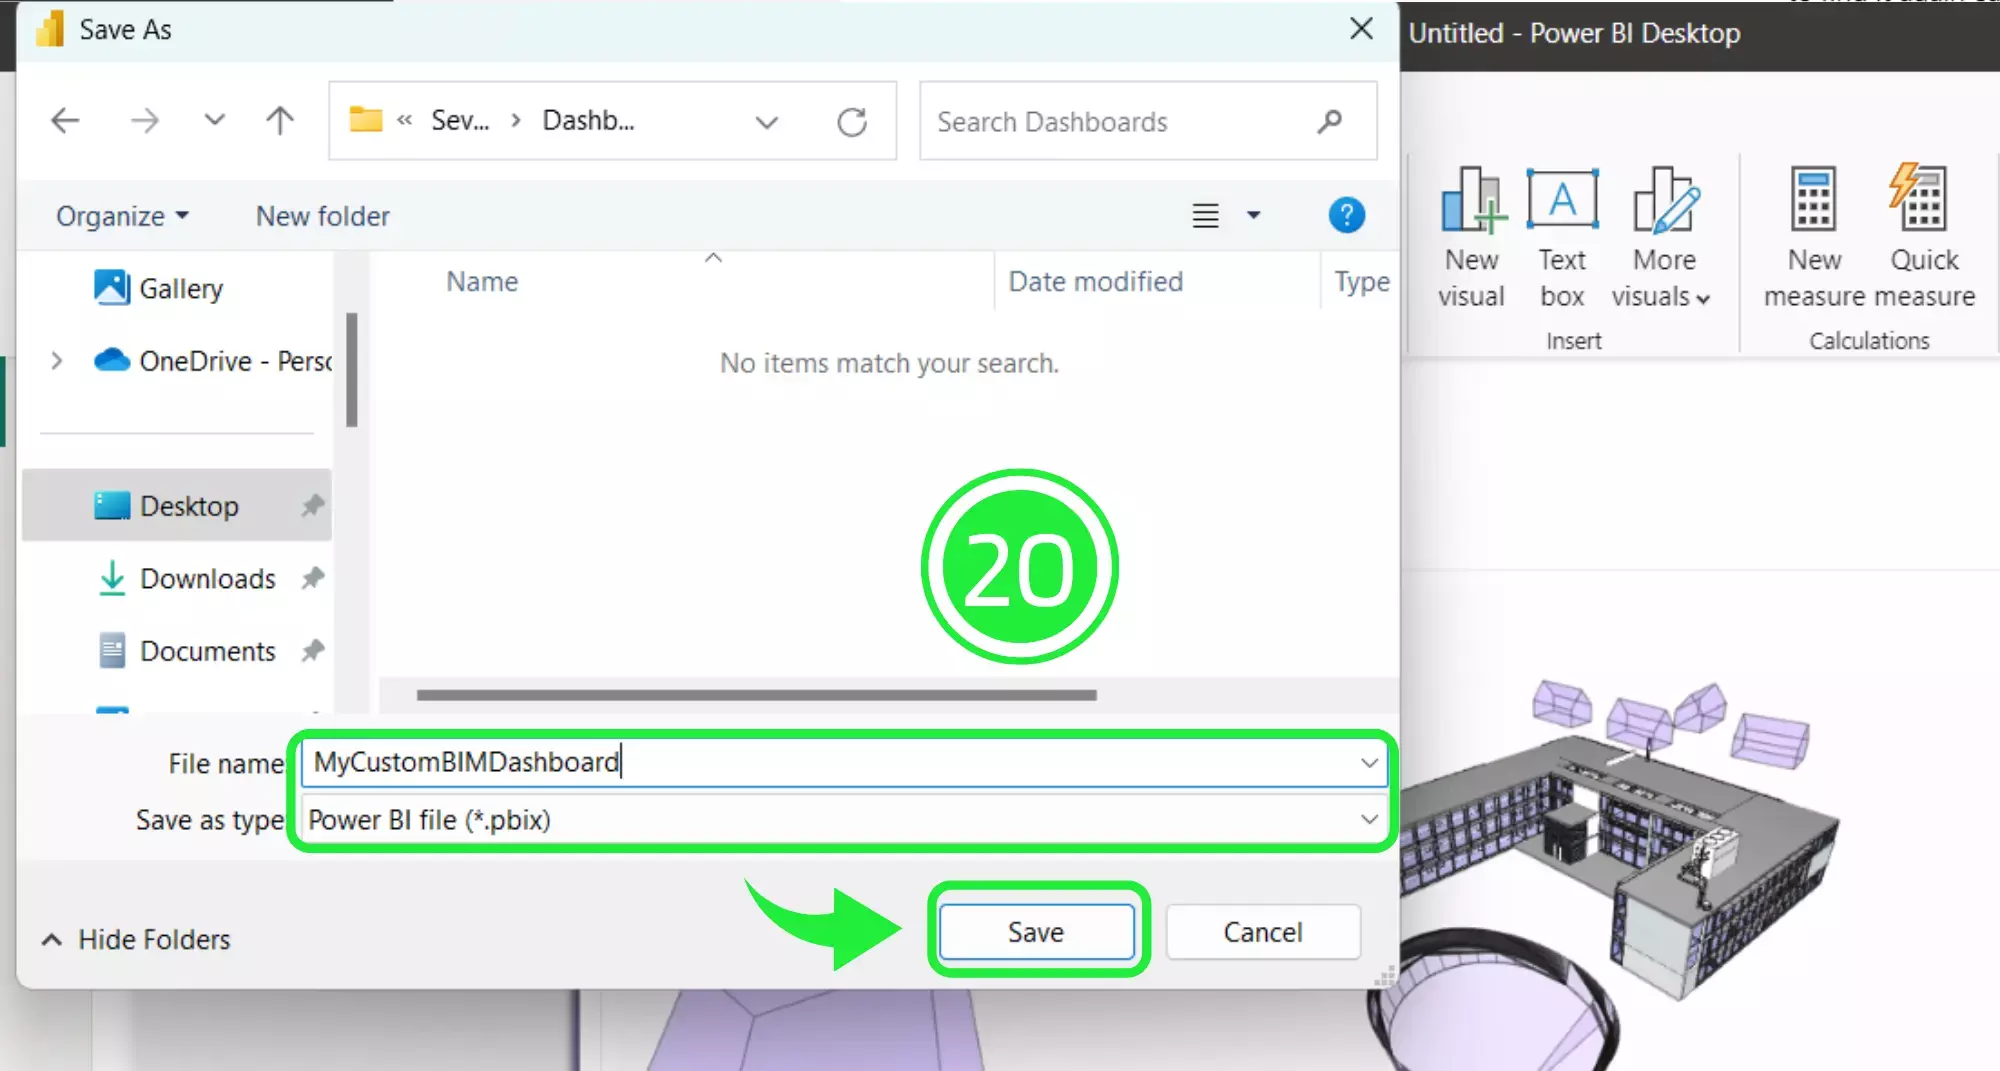
Choose an appropriate name for your file and then click on the “Save” button.
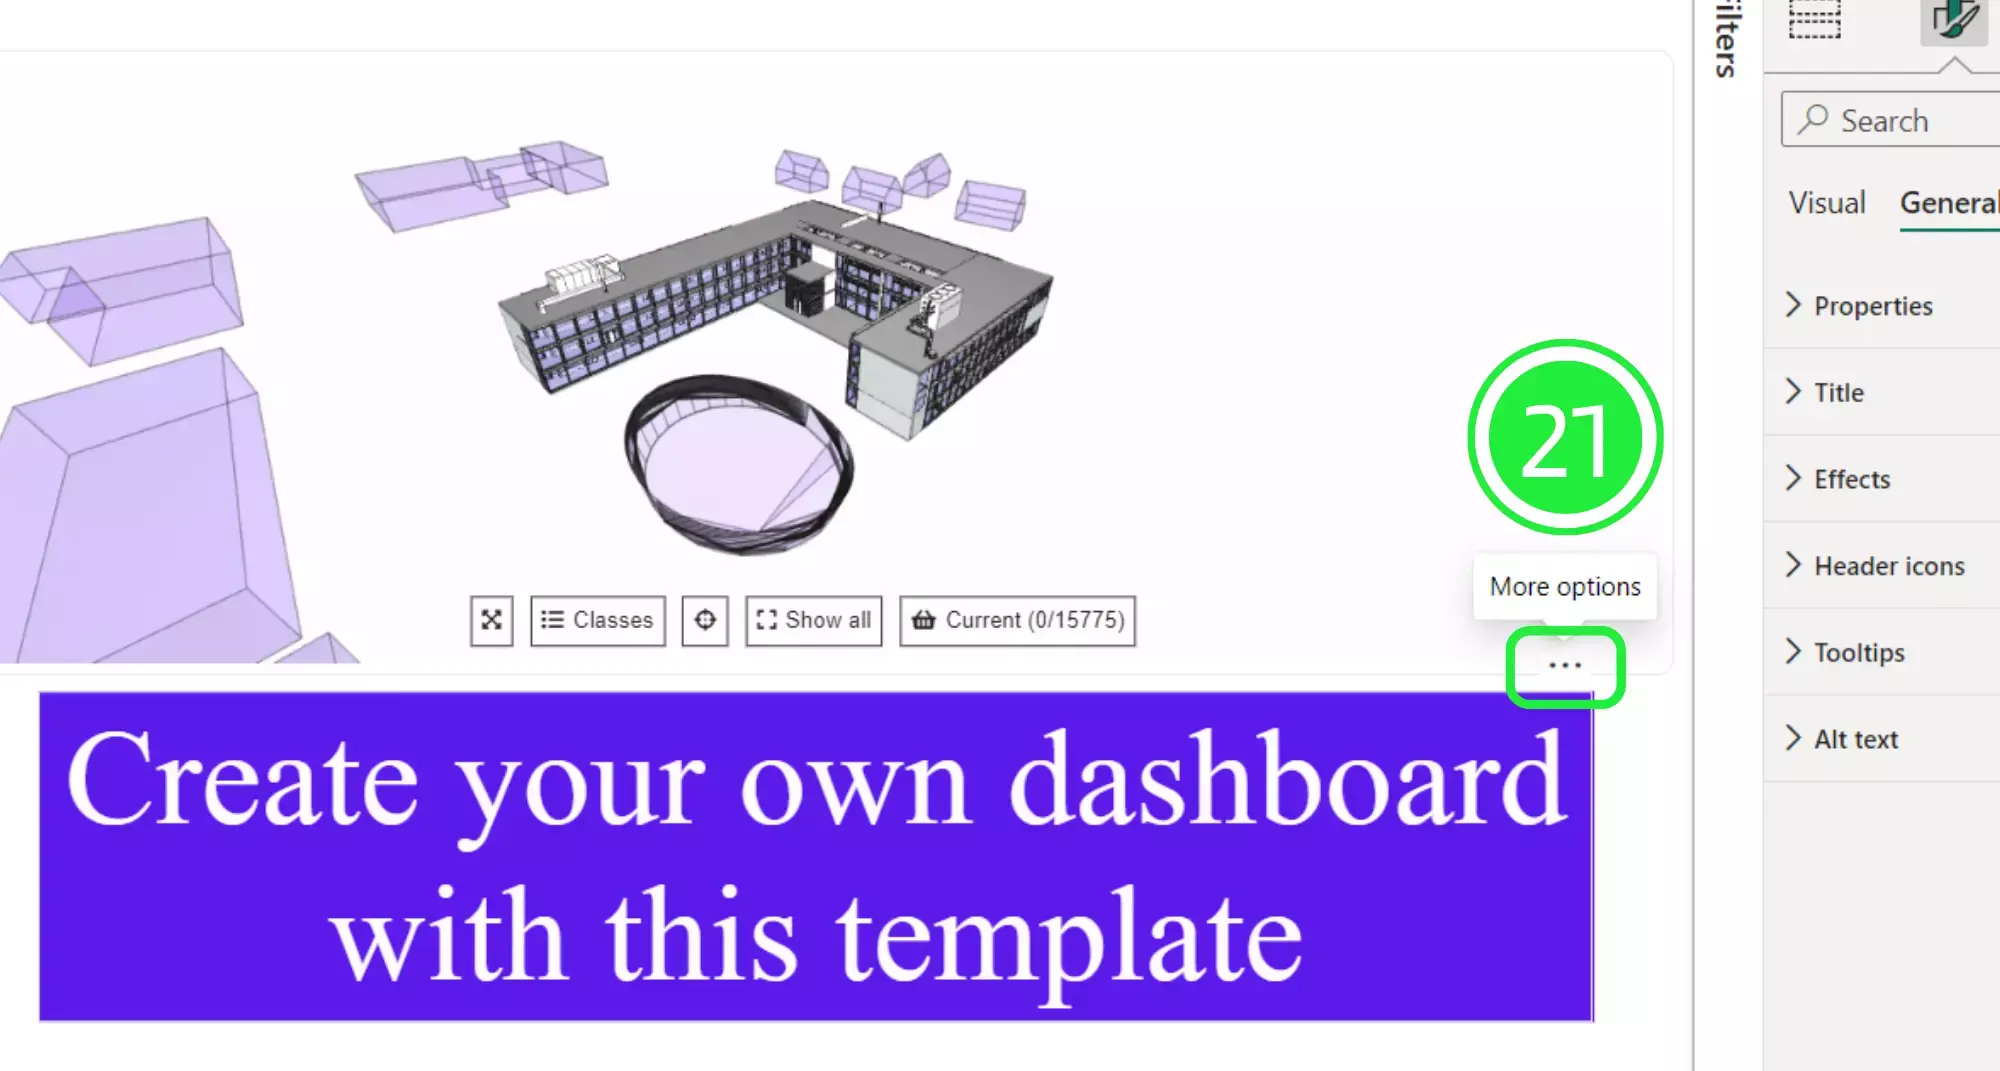
Before you start to add visuals to the bottom of your dashboard you can remove the purple banner by clicking on the 3 dots in the right corner.
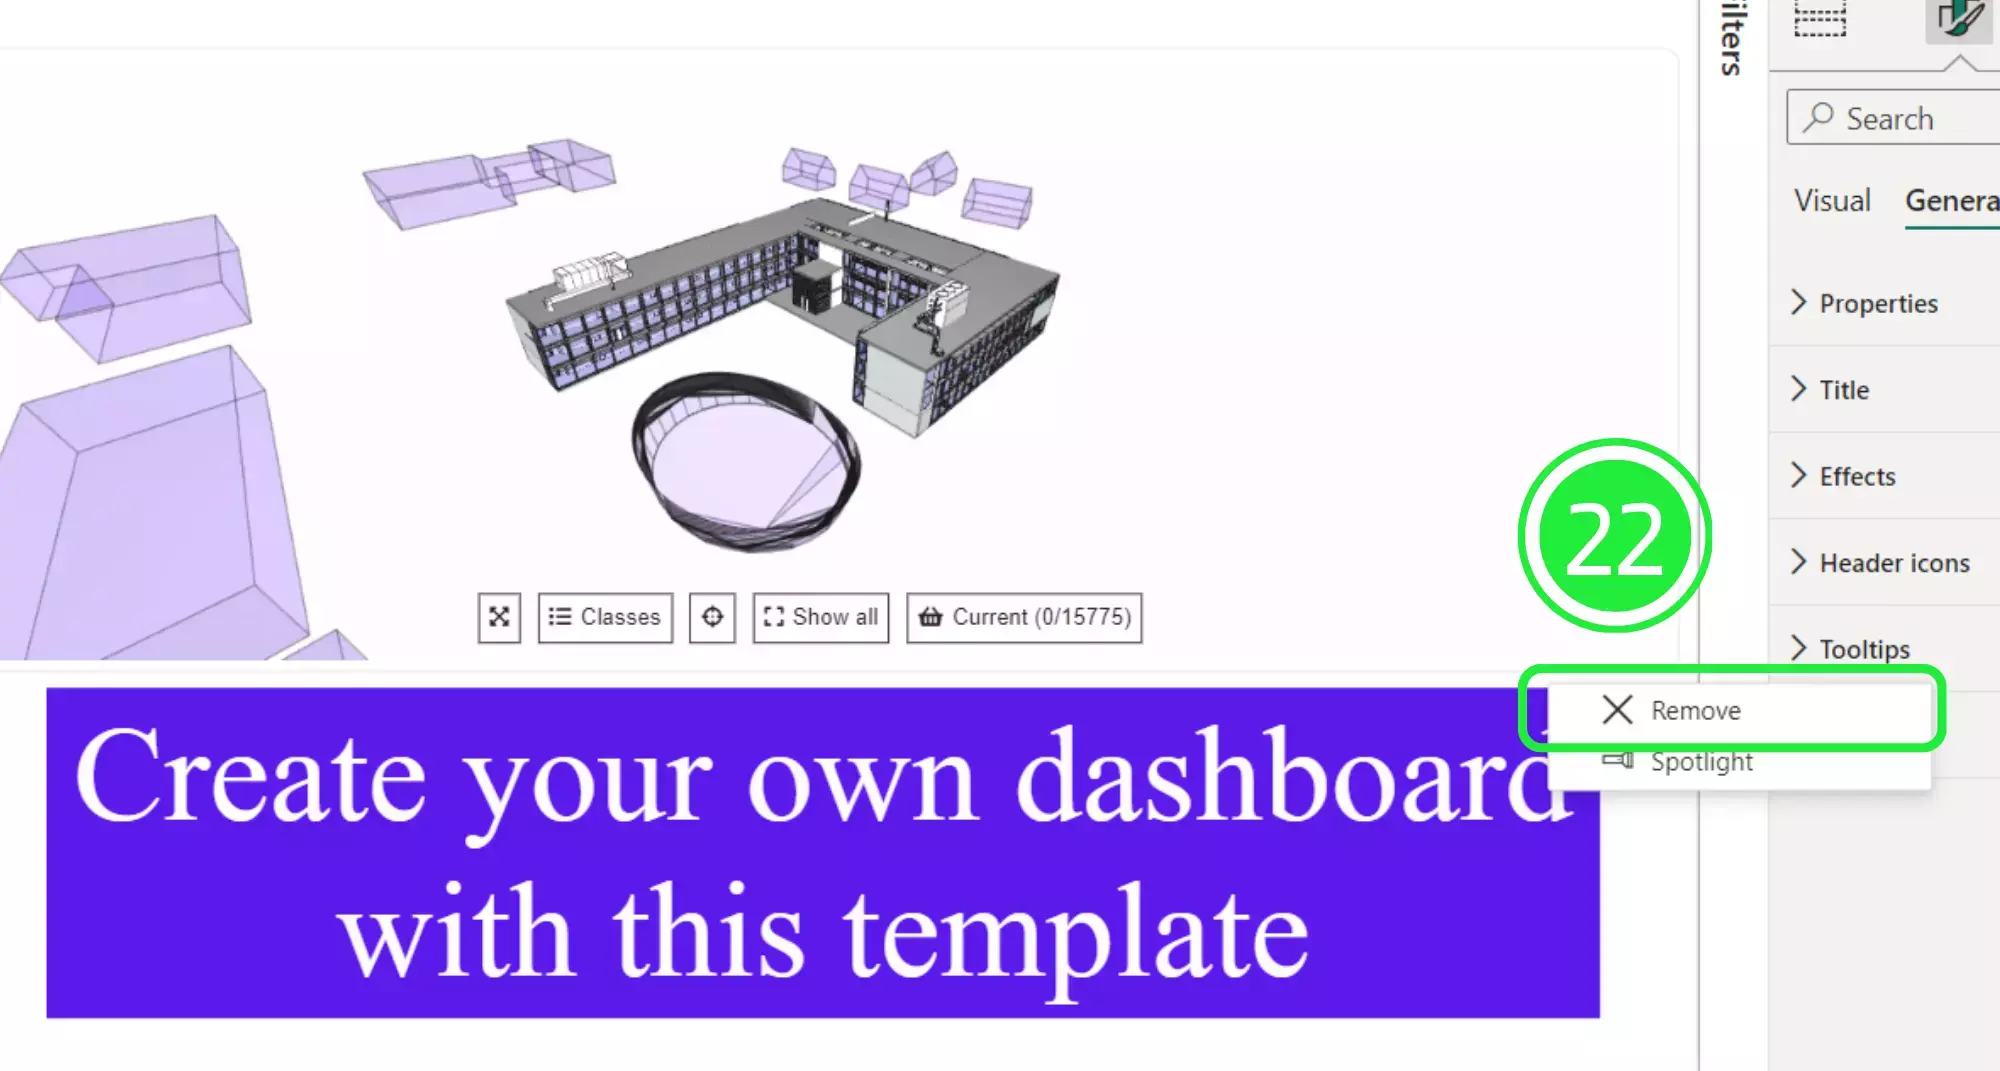
Click on “Remove” to delete the banner from the dashboard. You can overlay visuals on top of this banner but deleting it will keep the dashboard looking more streamlined.
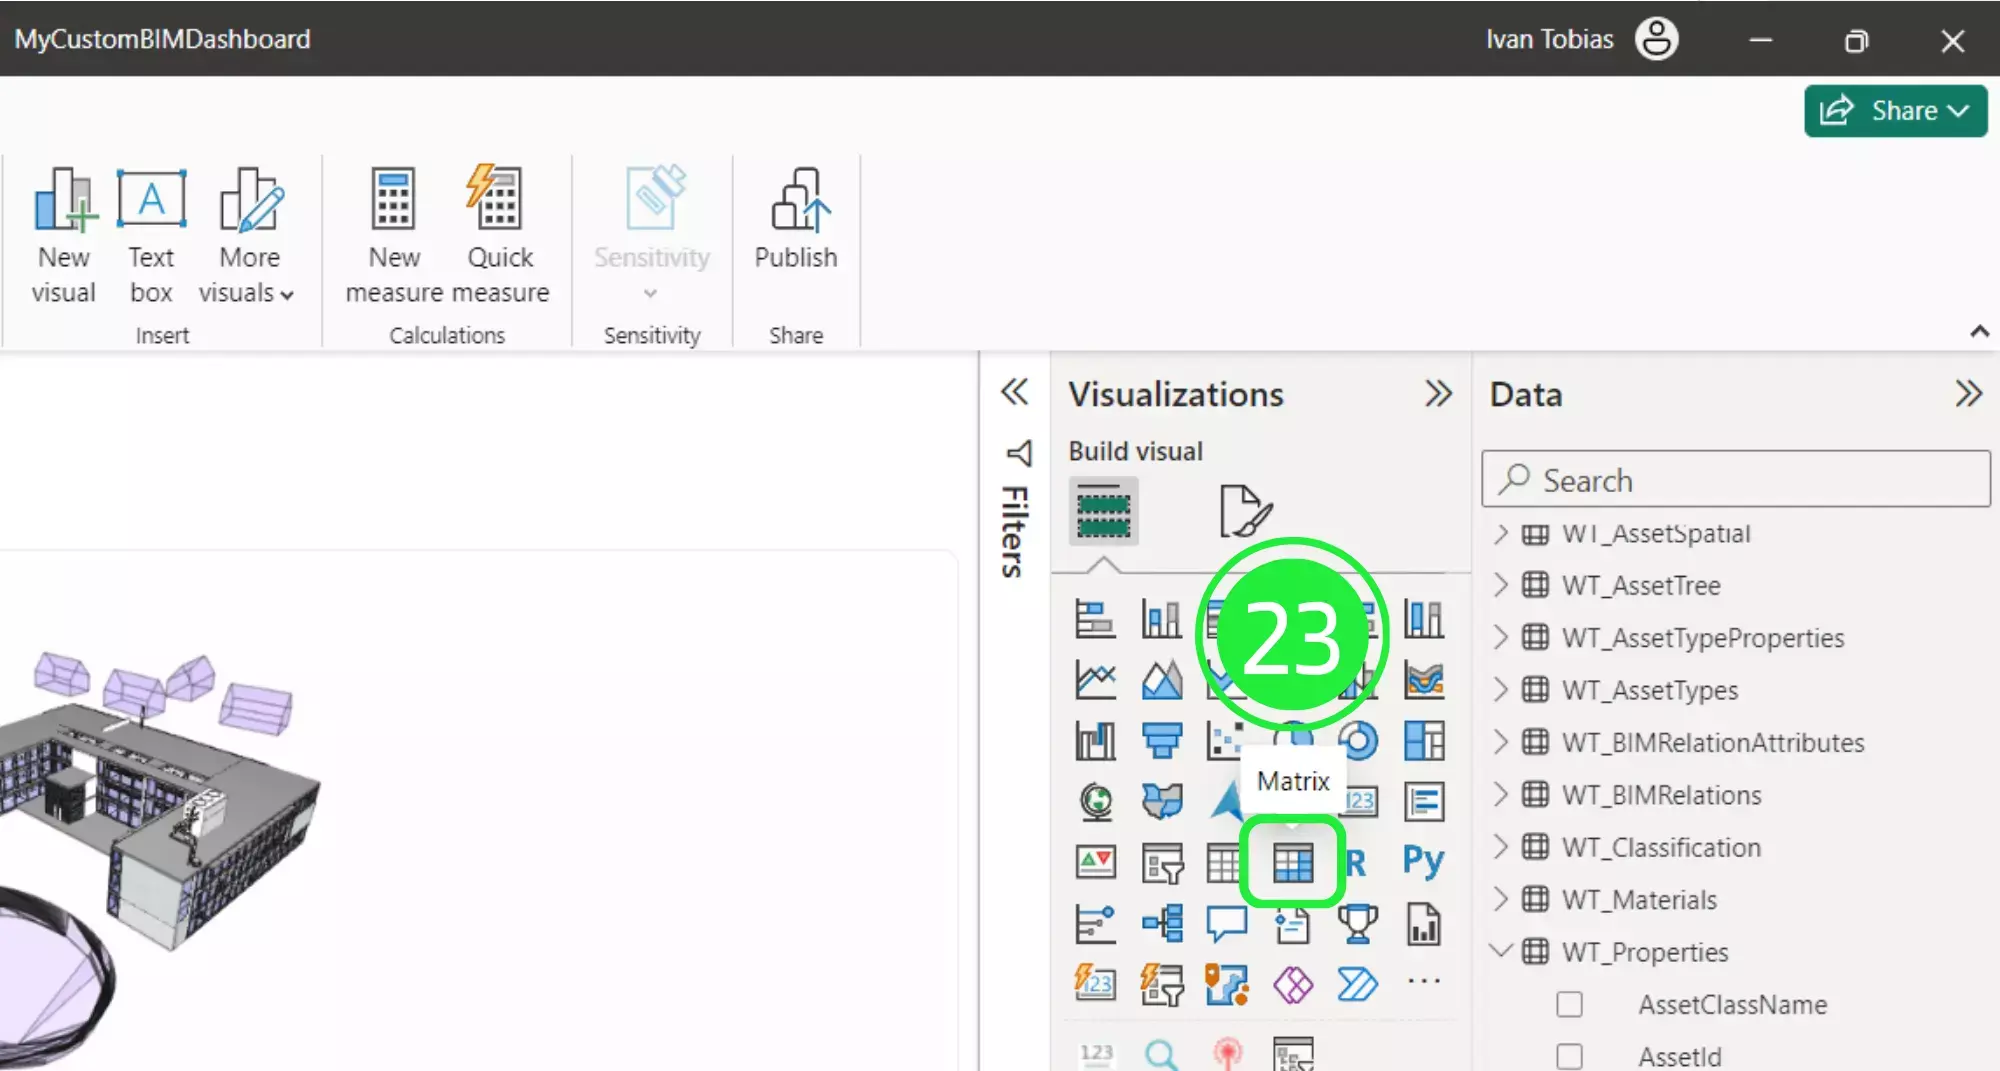
On the right hand side of the Power BI Interface is the “Visualisations” pane. Click on the “Matrix” button to add the visual to your dashboard. Reposition it so that it sits where the banner originally was located.
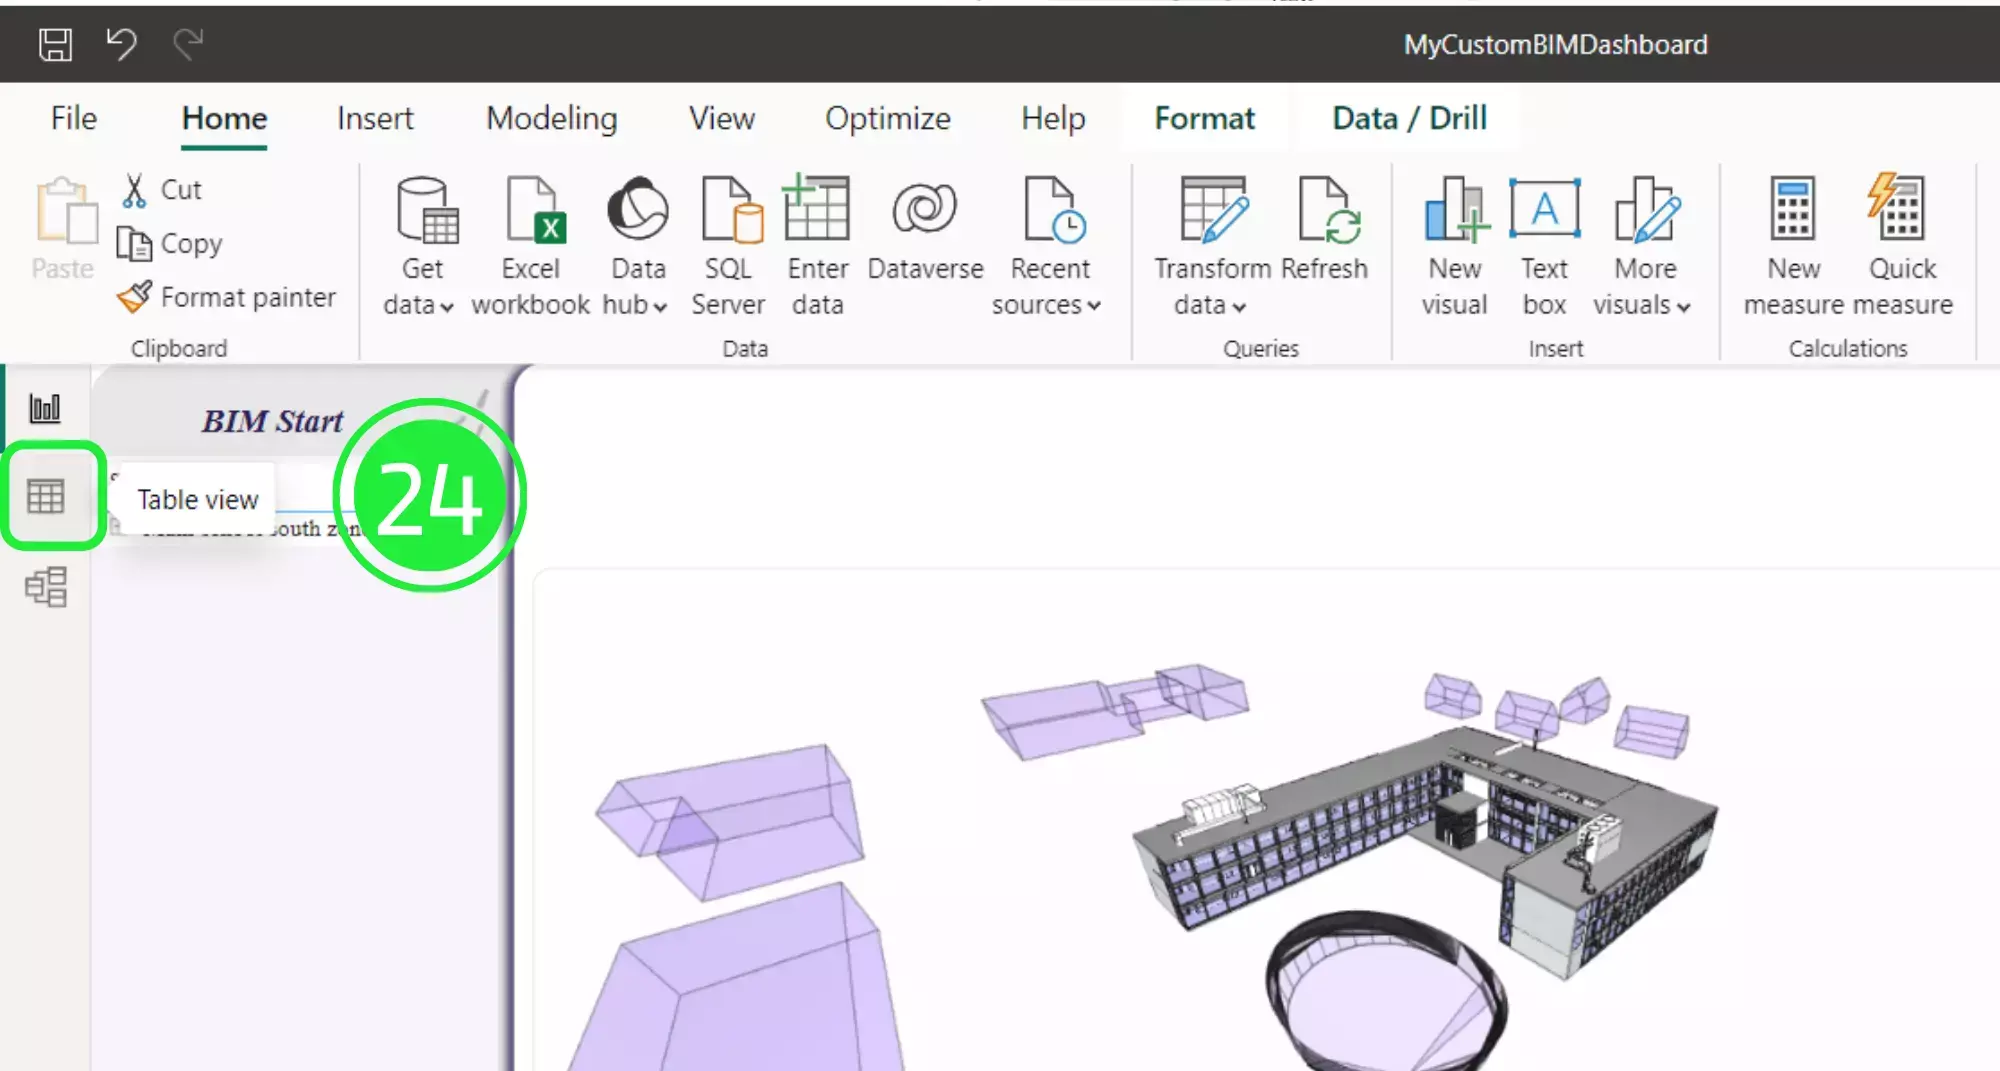
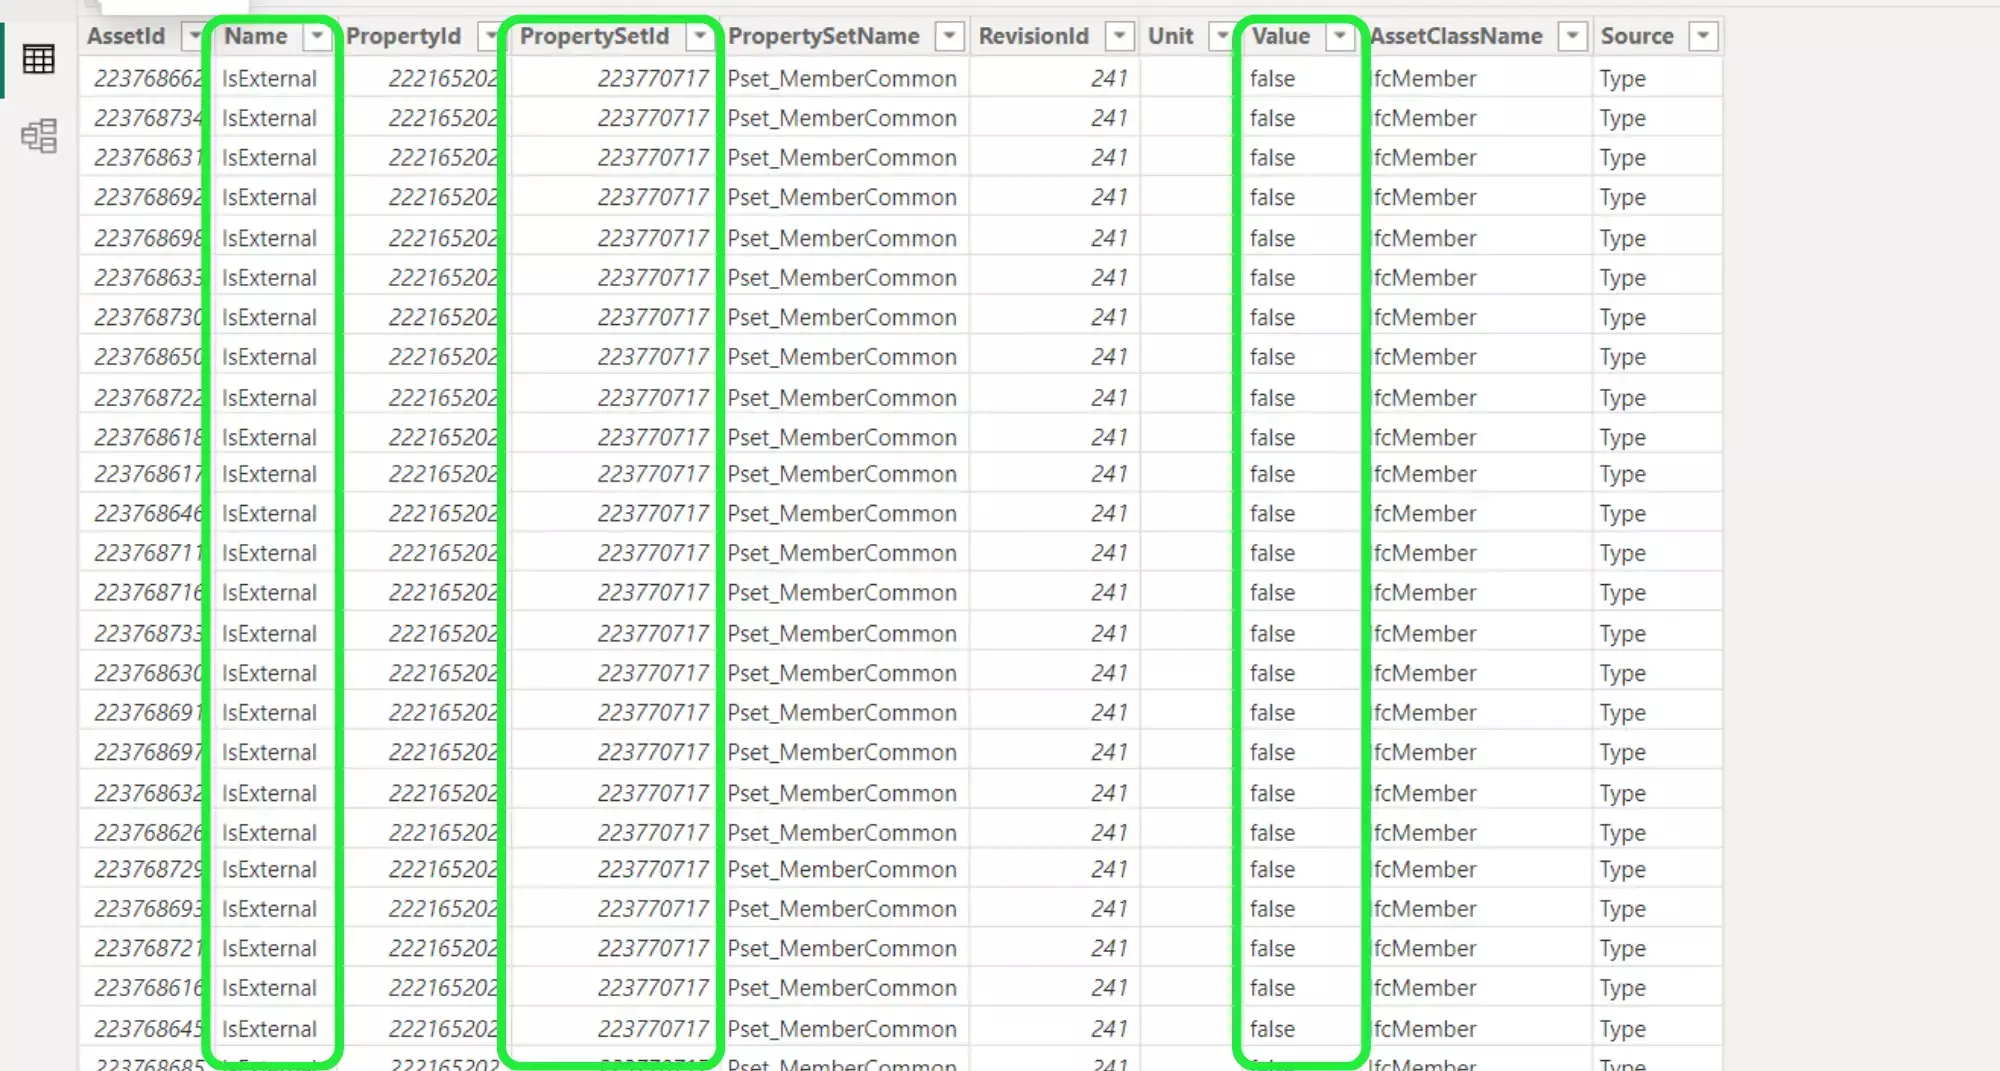
On the left hand side of the report there are several options for viewing the data that you will use in your dashboard. Click on the second option, “Table View” in order to display the data as a table.
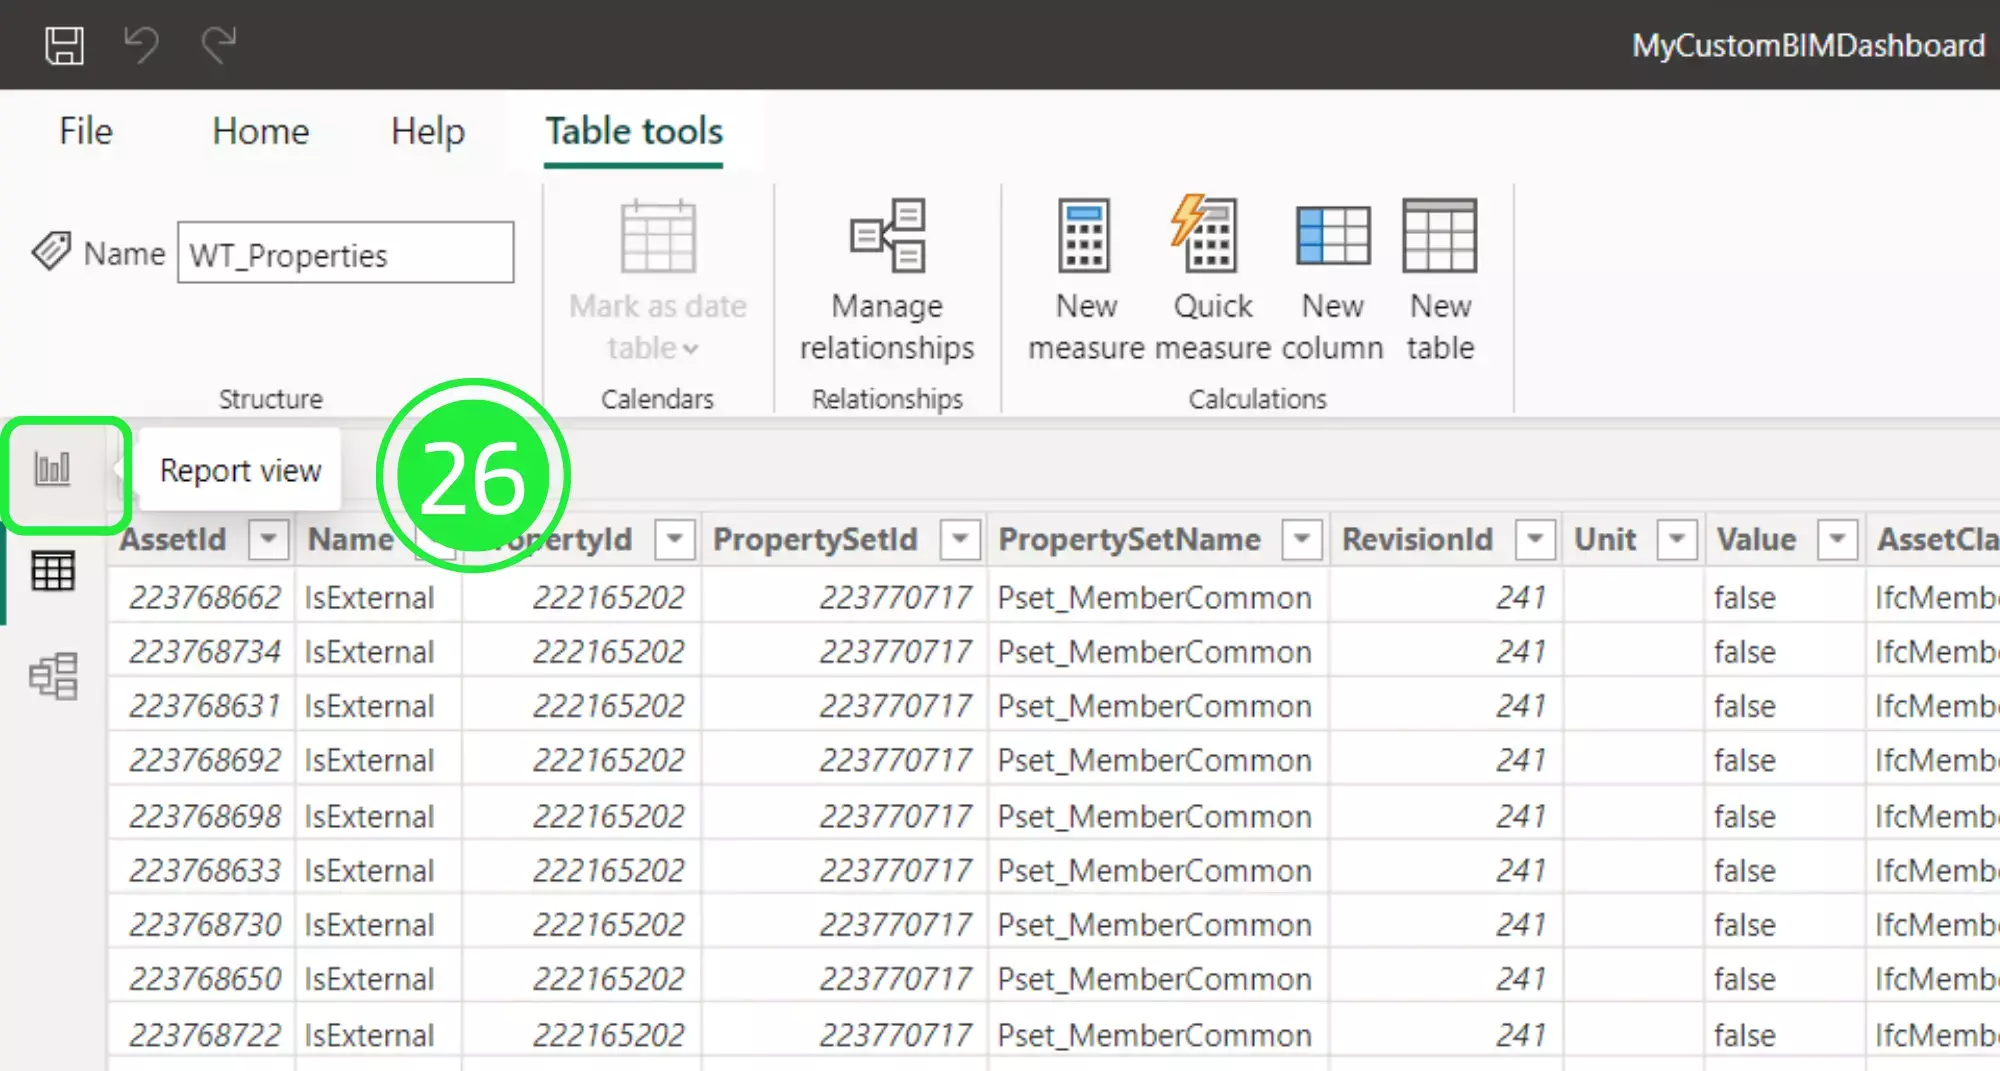
Now, choose “WT_Properties” from the list on the right hand side under the Data pane. Now you can view all of the major information about your assets within your BIM Model.
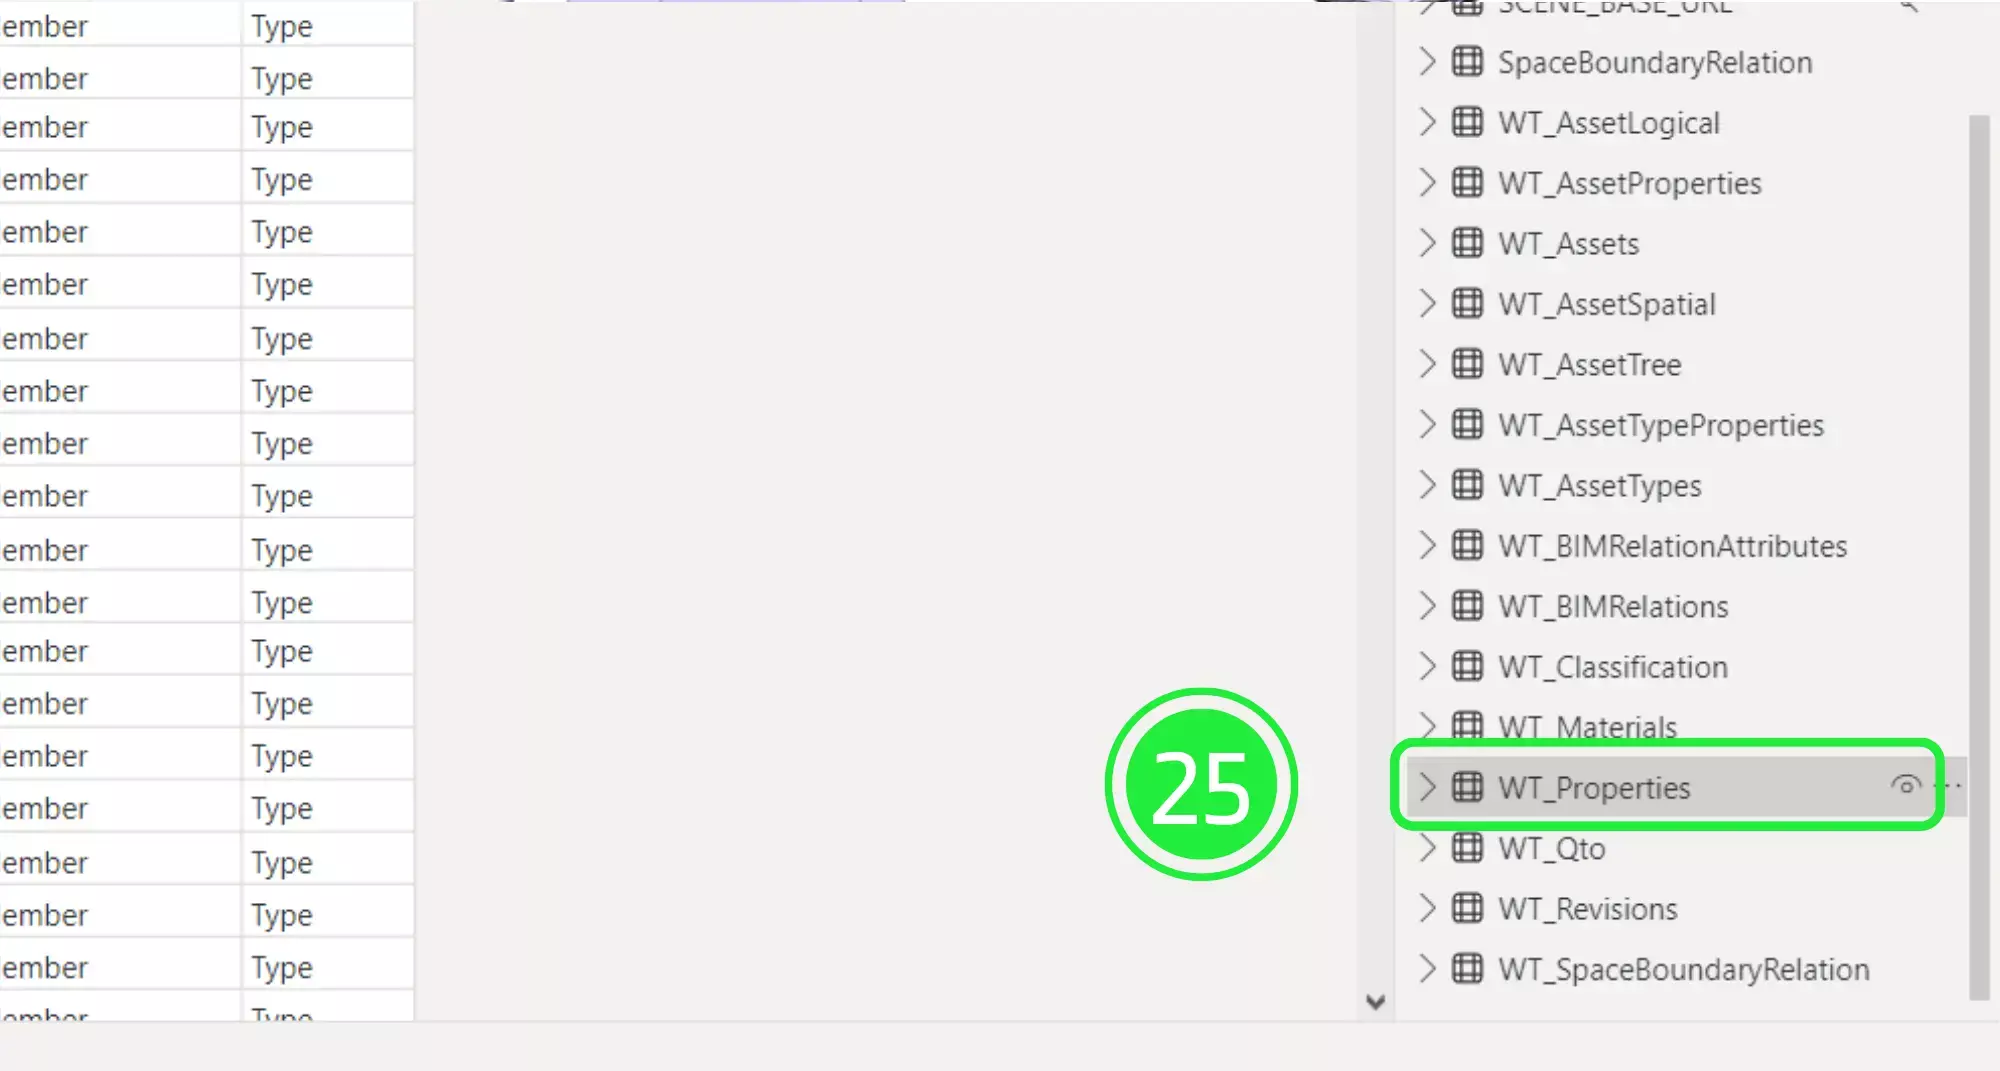
You can now see the ifc property sets within WT_Properties. There is “Name”, which typically refers to the unique identifier or title given to a property set. There is also “PropertySet” which is a collection or group of properties within IFC. This serves as a container that groups together related properties that describe aspects or characteristics of an object in a building model. Lastly there is ‘Value’. This is the specific data or information assigned to a particular property within a property set. All these columns will be used to animate your Power BI visual in your dashboard.
In order to create the BIM Properties table you need to return to the 3D BIM Viewer and the dashboard. To go back to it, click on “Report View”.
Make sure that the “Matrix” you added is selected and then drop down the menu on “WT_Properties” in the “Data” pane on the right-hand side.
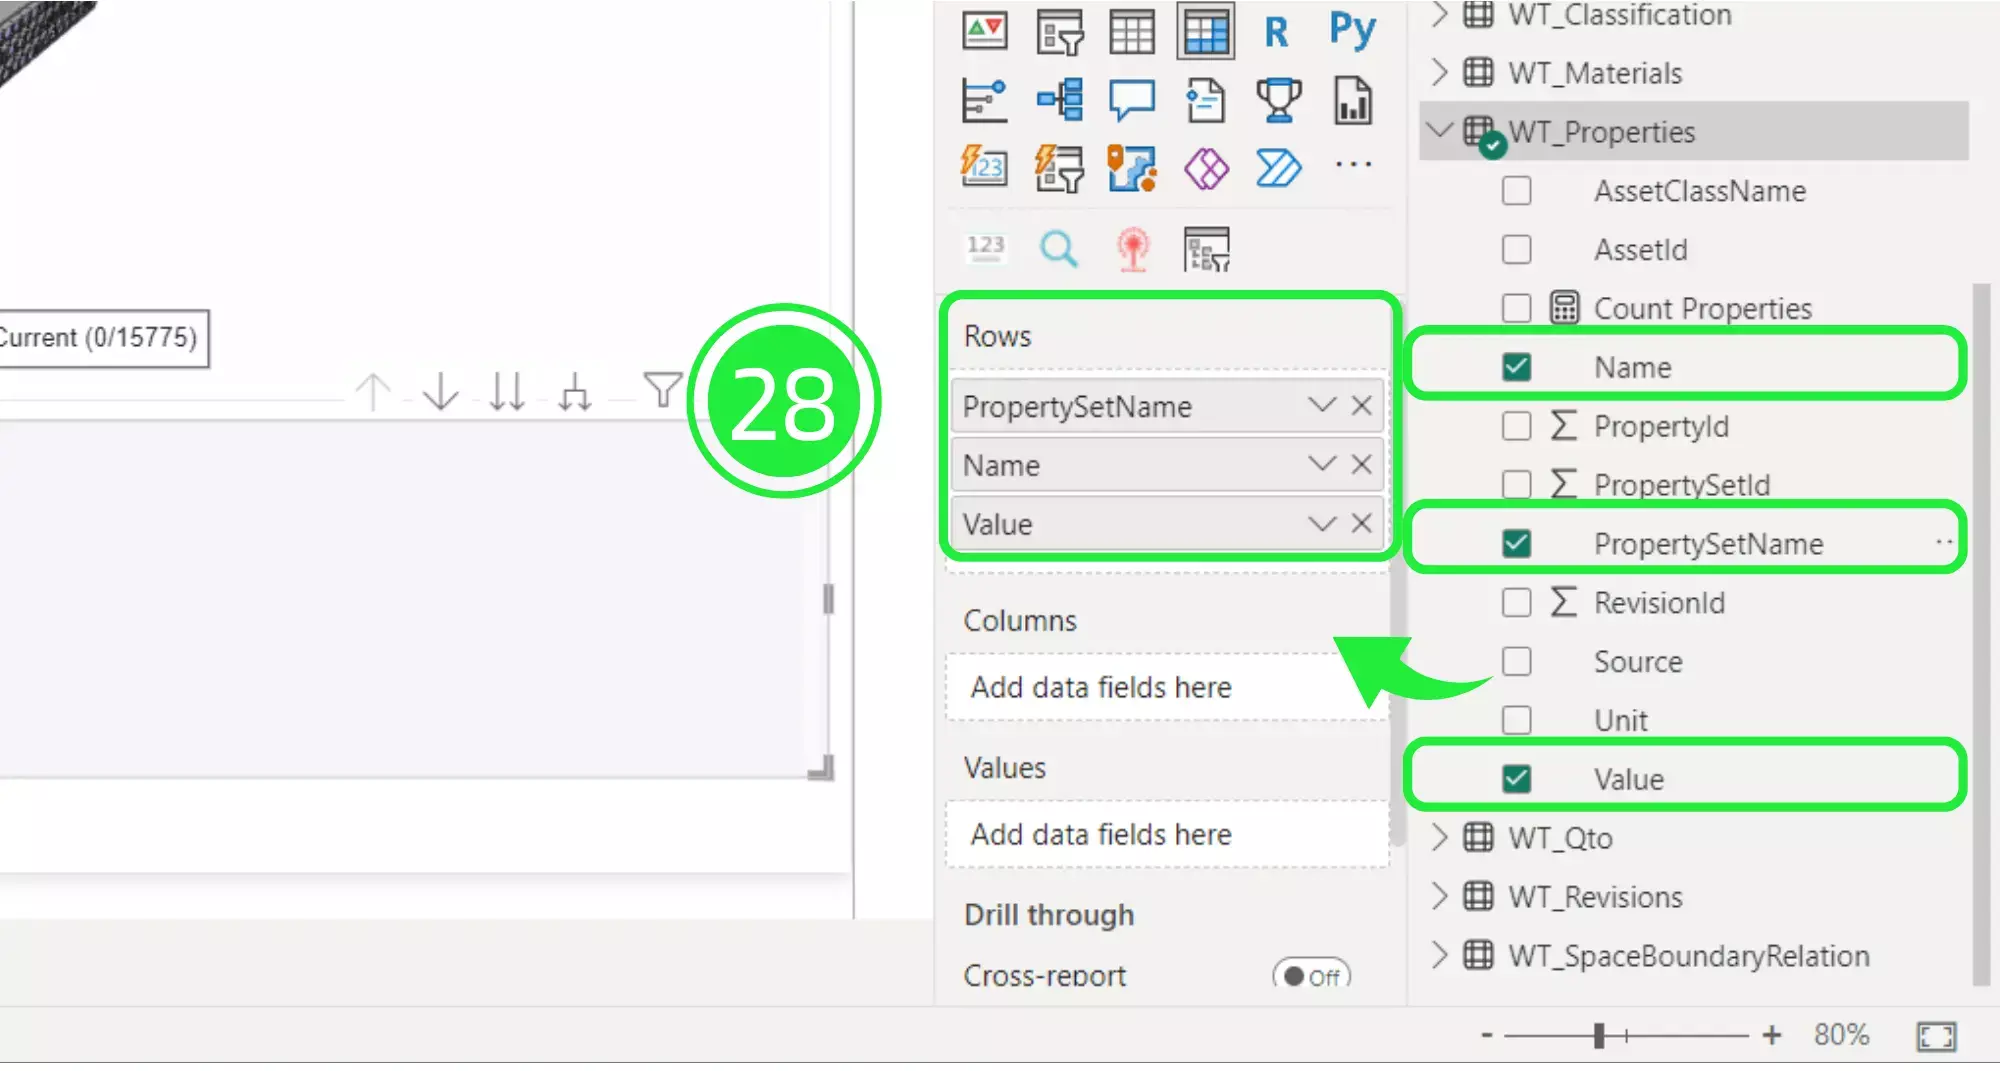
Drag and drop first “Value”, then “Name”, followed by “PropertySetName” into “Rows on the “Visualisations” pane.
It’s important to note that when you layer data within a visual, the order that you do it in is important as it will affect how the data is presented in the visual.
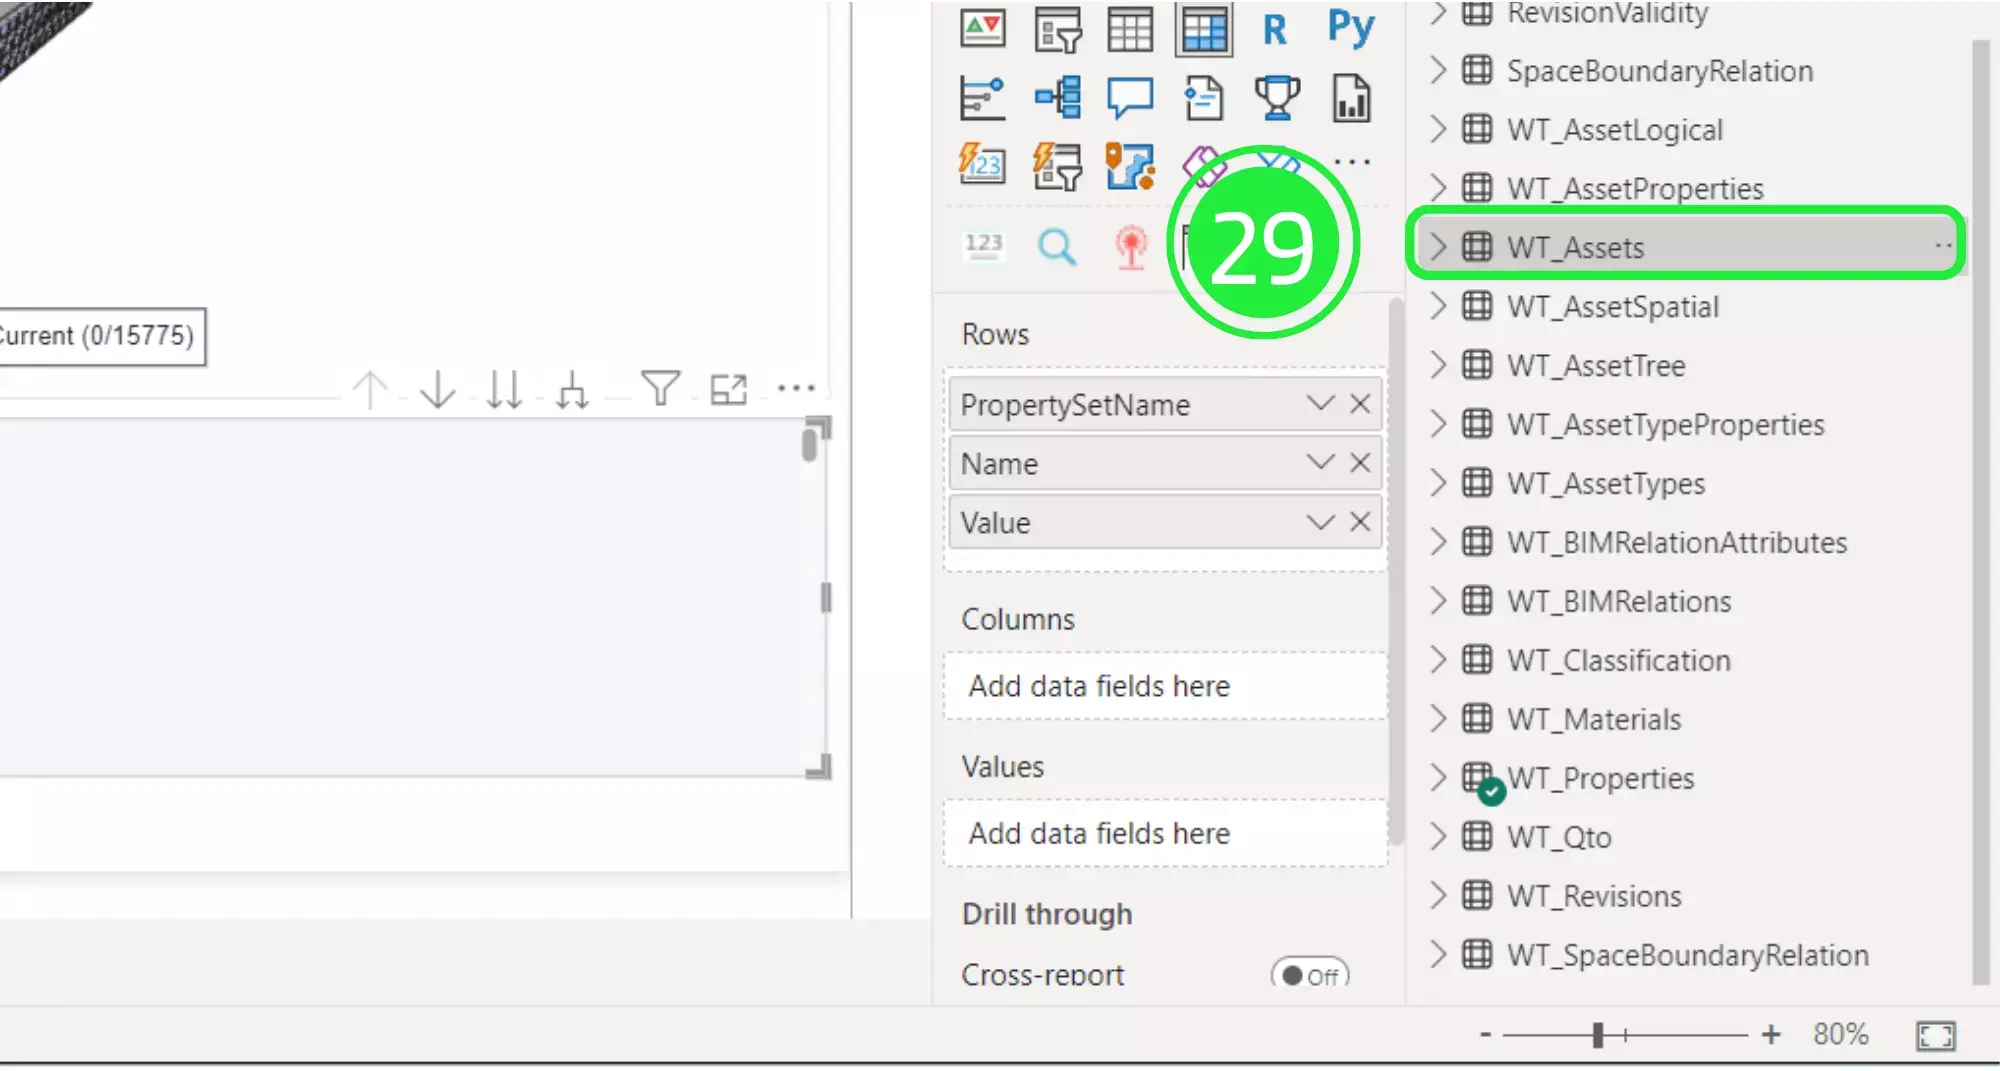
Go to “WT_Assets” and drop down the menu.
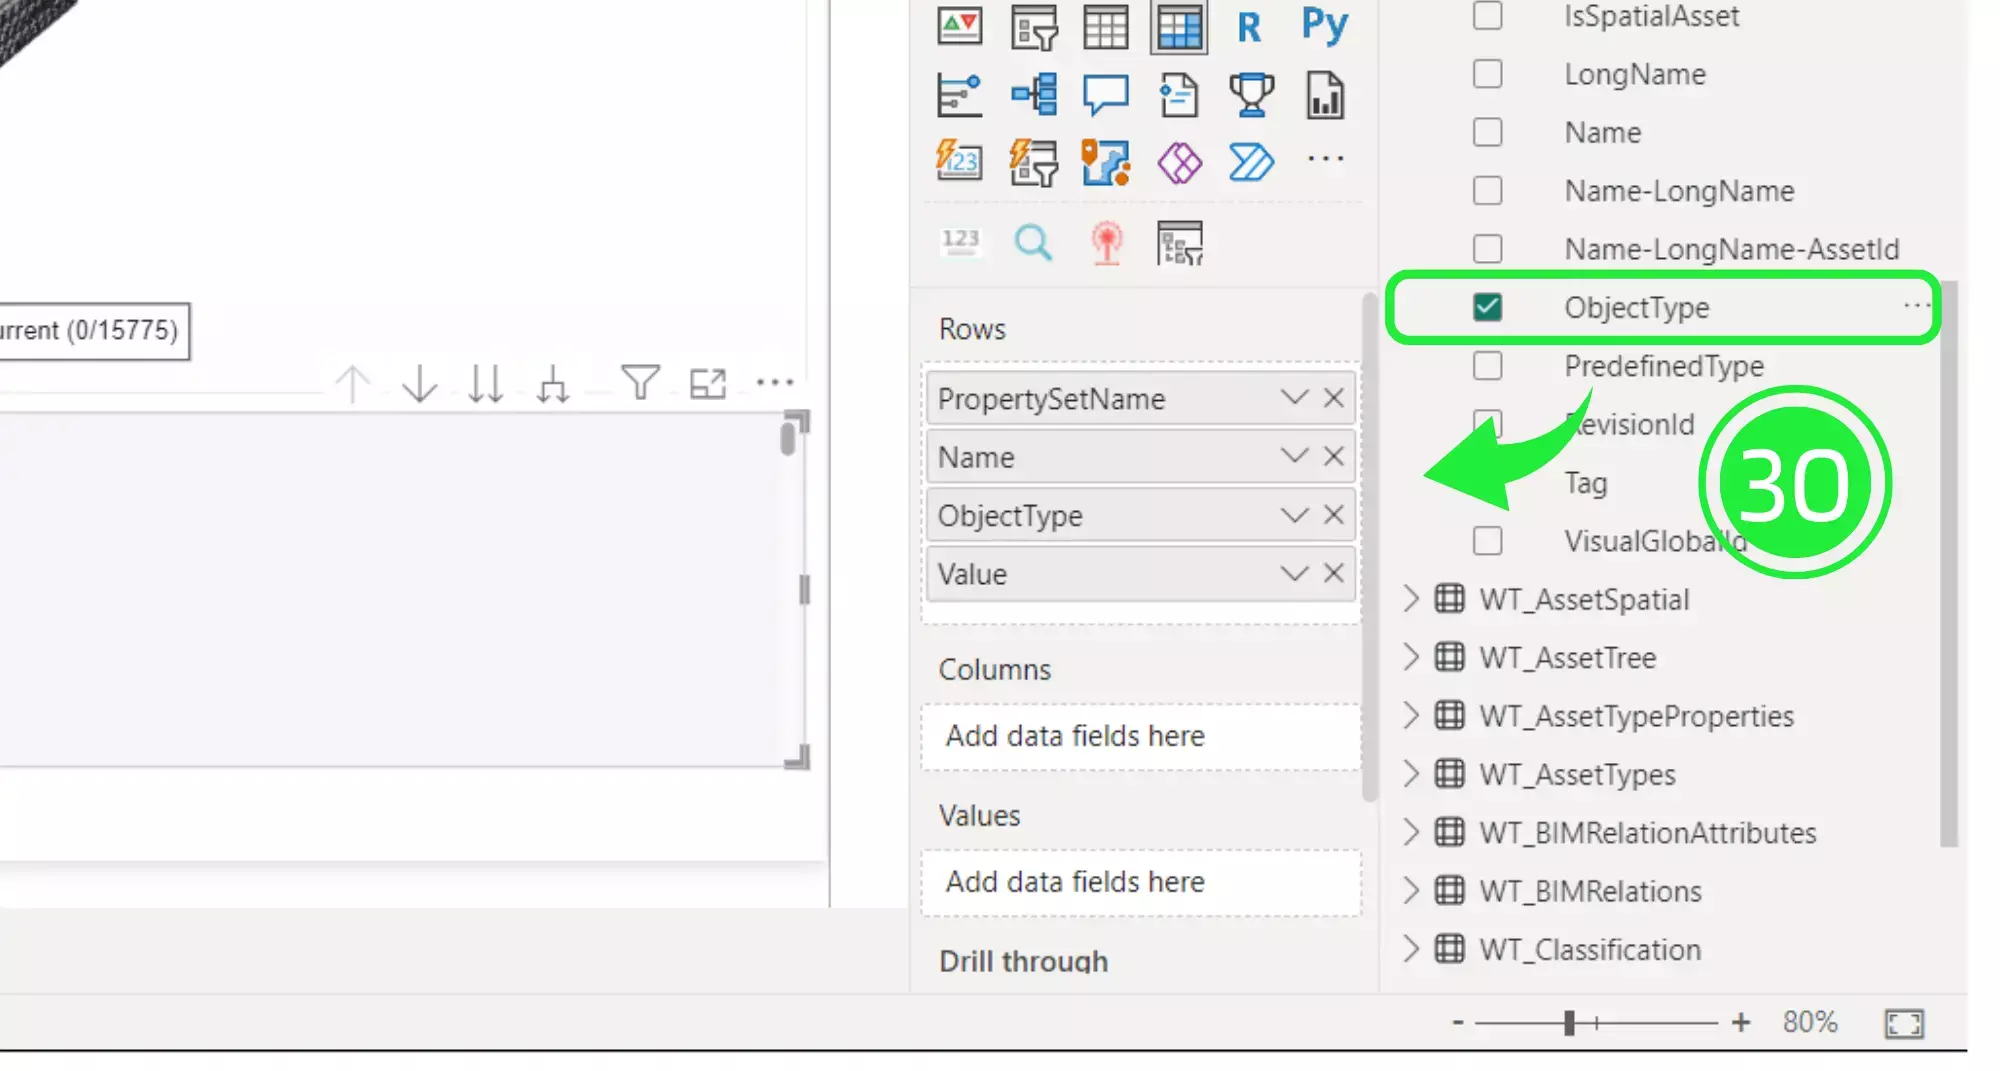
Scroll down to “ObjectType” and drag that over the “Rows” and place it just above “Value”.
To be able to count the number of properties as well you must add a column into the Matrix. Go to “WT_Properties” again and drag and drop “Name” over to “Values” under “Columns”.
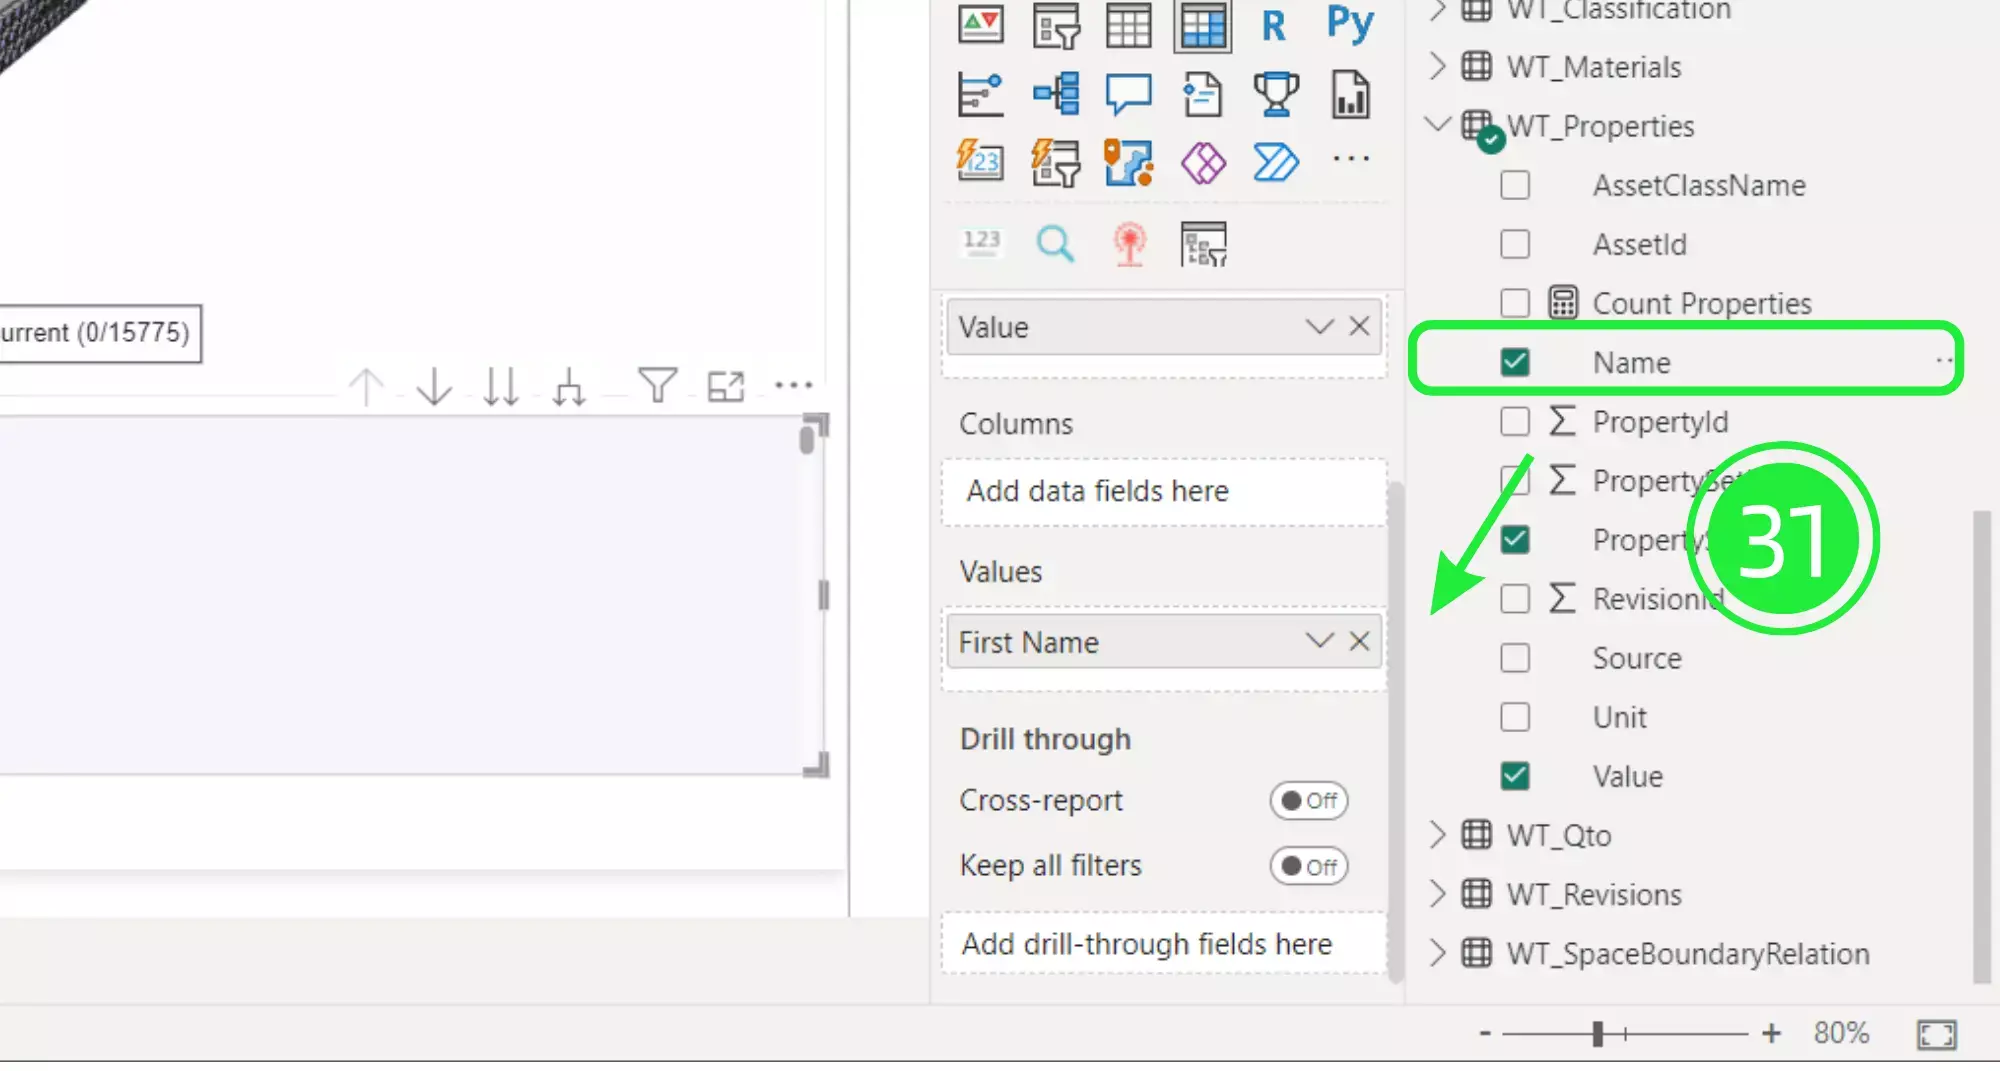
Drop down the menu at the side of “Name” for options and choose “Count”.

Resize the table to tidy up the dashboard and leave space for other visualisations.
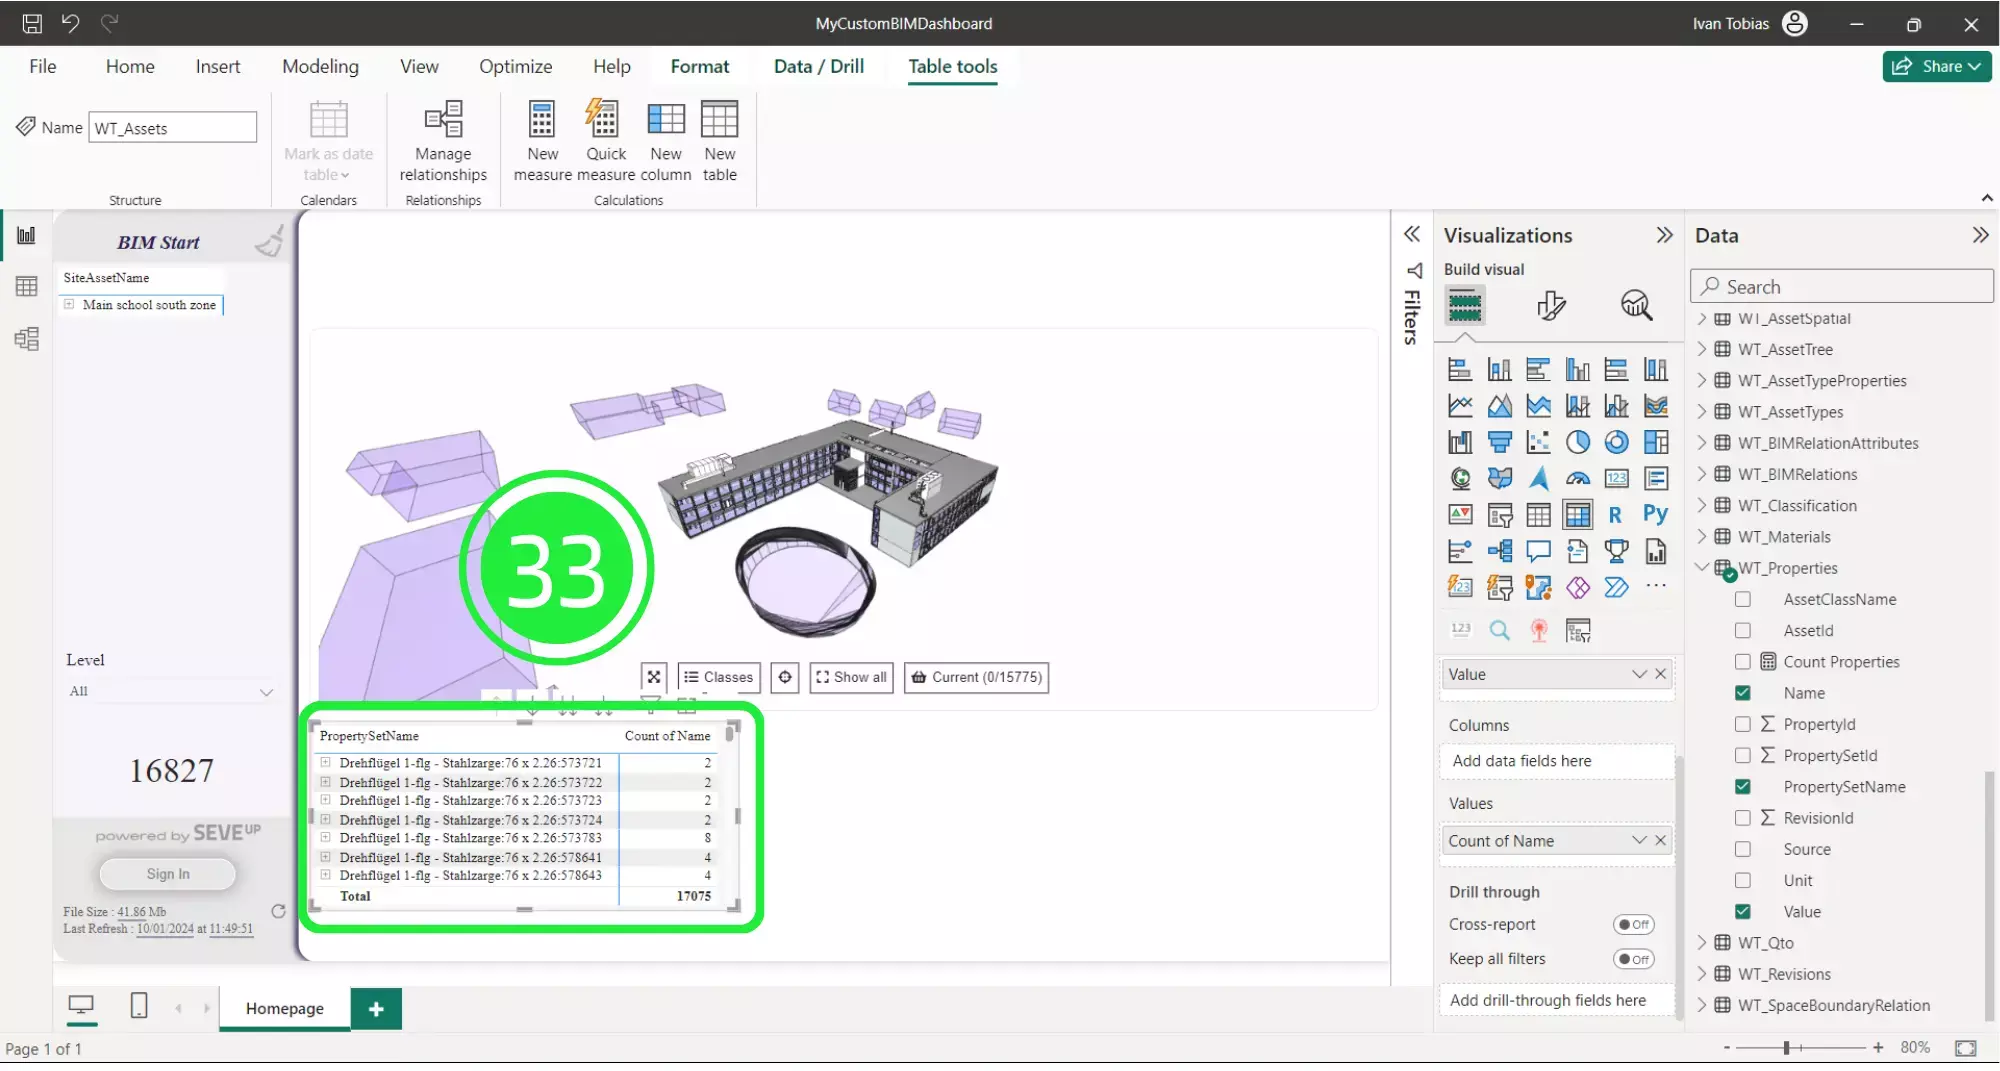
The matrix visual is now ready to be used to delve into the data within the BIM model.
It’s easy to use it to make smart selections and auto display it inside the SeveUp 3D BIM Viewer.
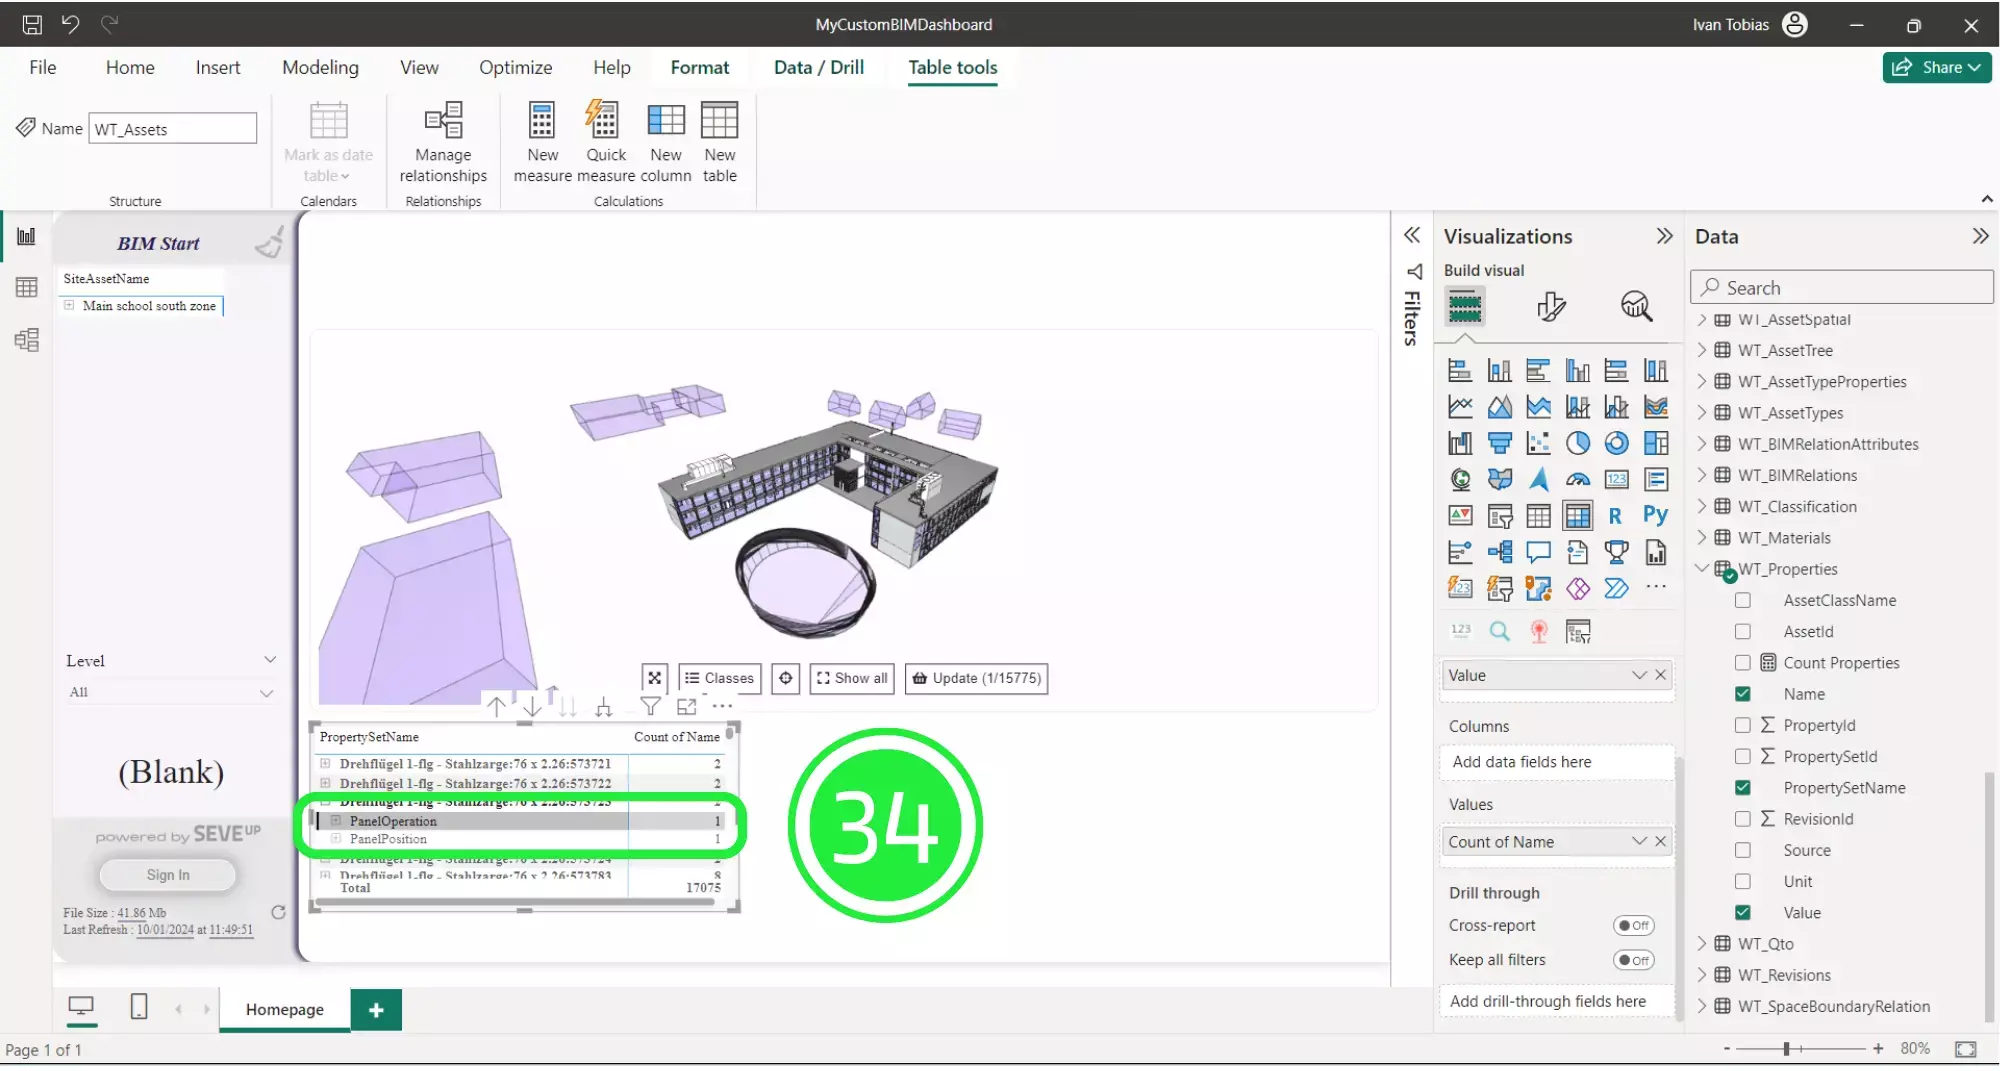
Select an asset from the list of properties within the “Matrix”.
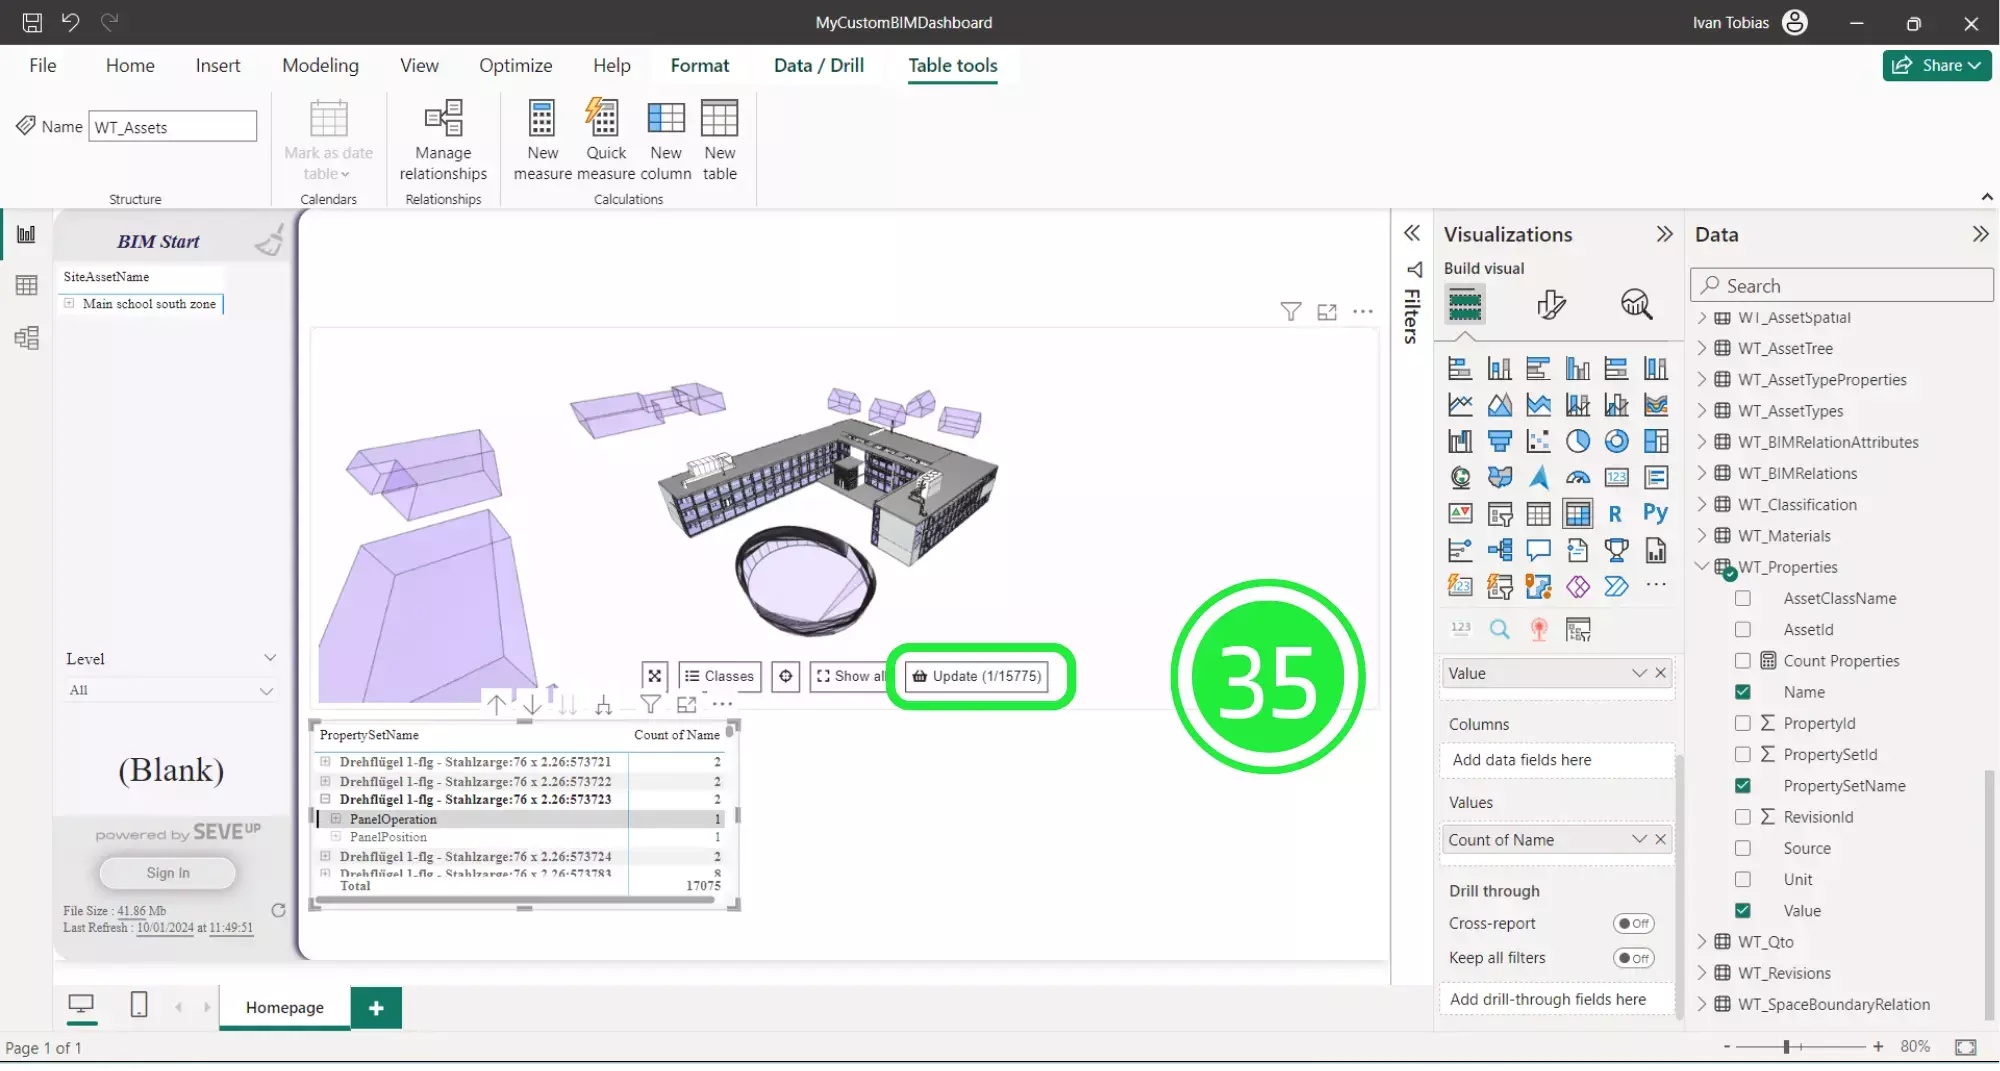
Click on’ Update’ in the BIM Viewer for the selection to be displayed.
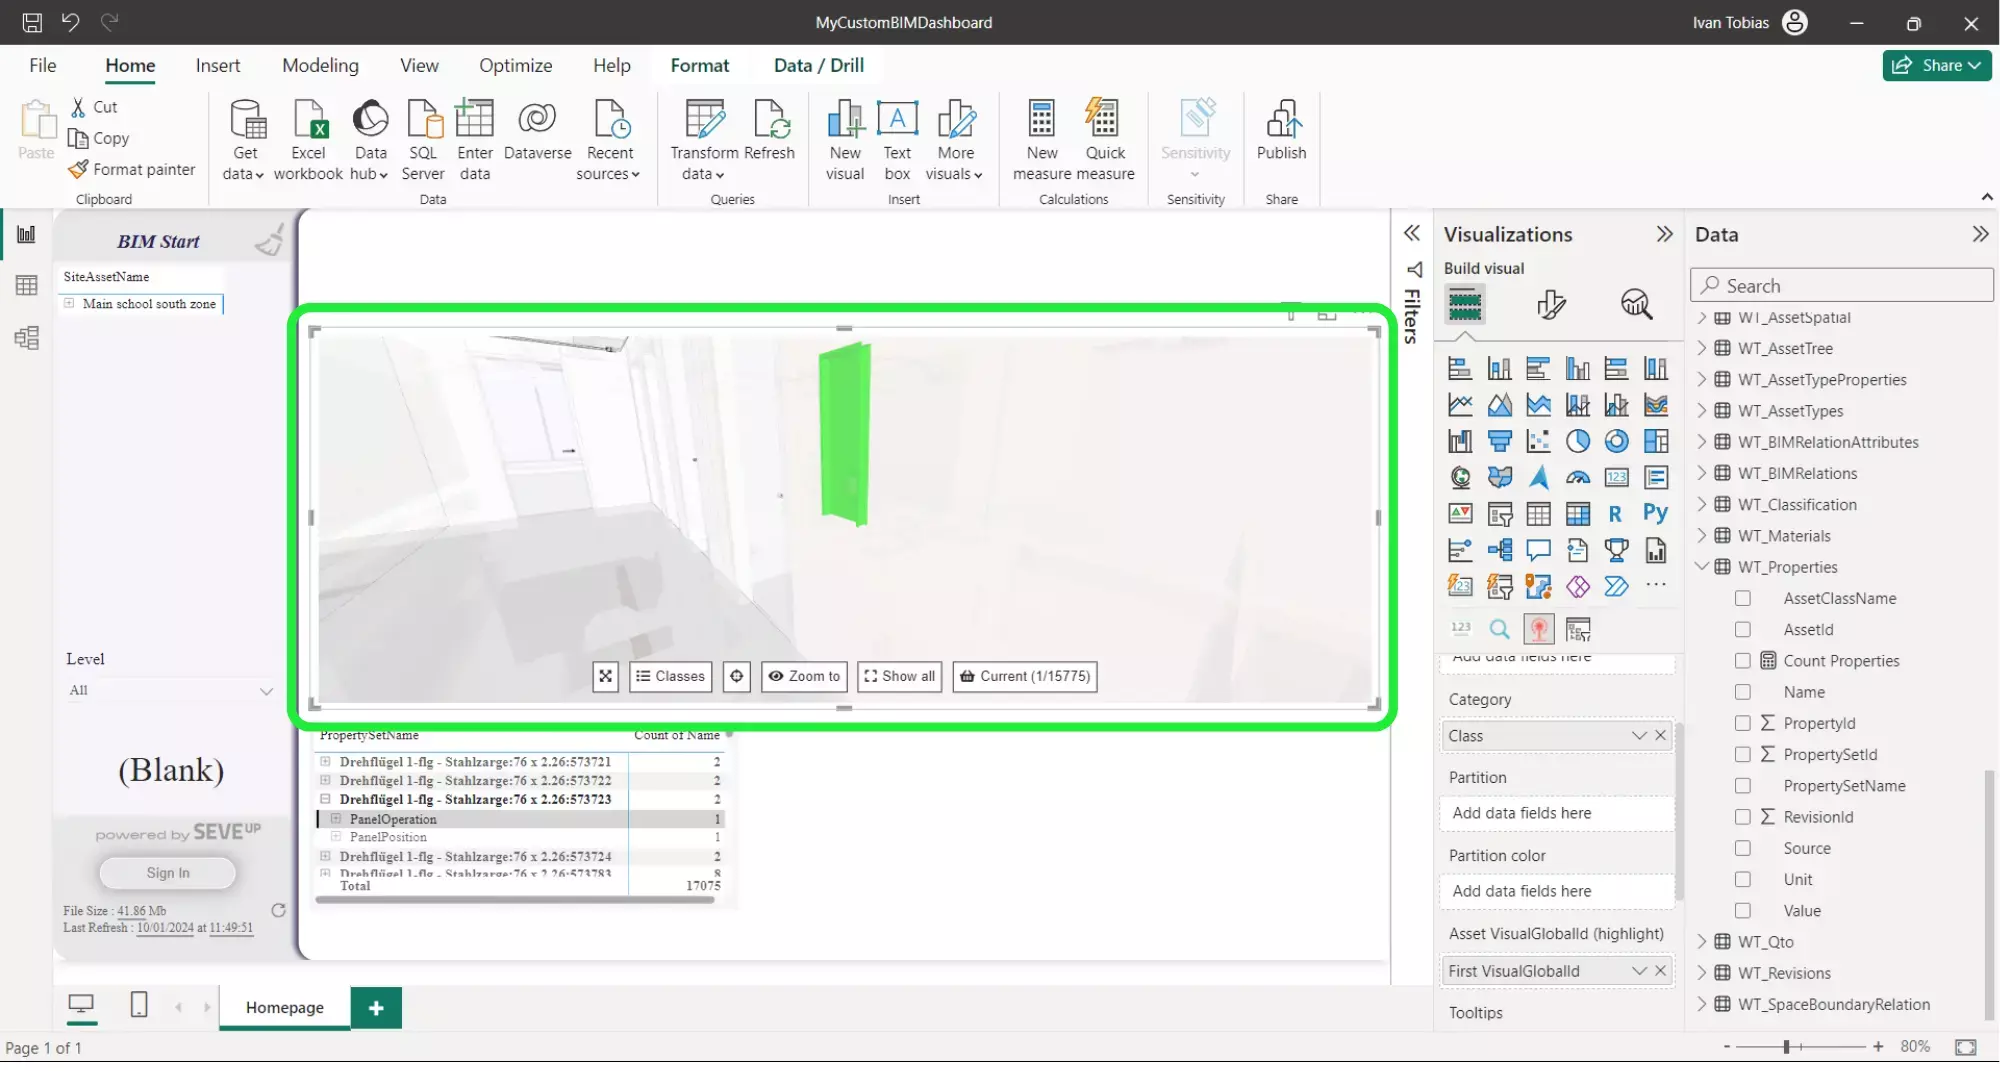
The asset is now shown as highlighted in green. You can rotate the view and zoom in and out as needed to see where the selection sits within the BIM model.
Before uploading the Power BI custom template back into the SeveUp app, it needs to be saved as a template file with the extension .PBIT. To do this click on ‘File’ in the top left corner.
Select “Save As” from the drop down menu.
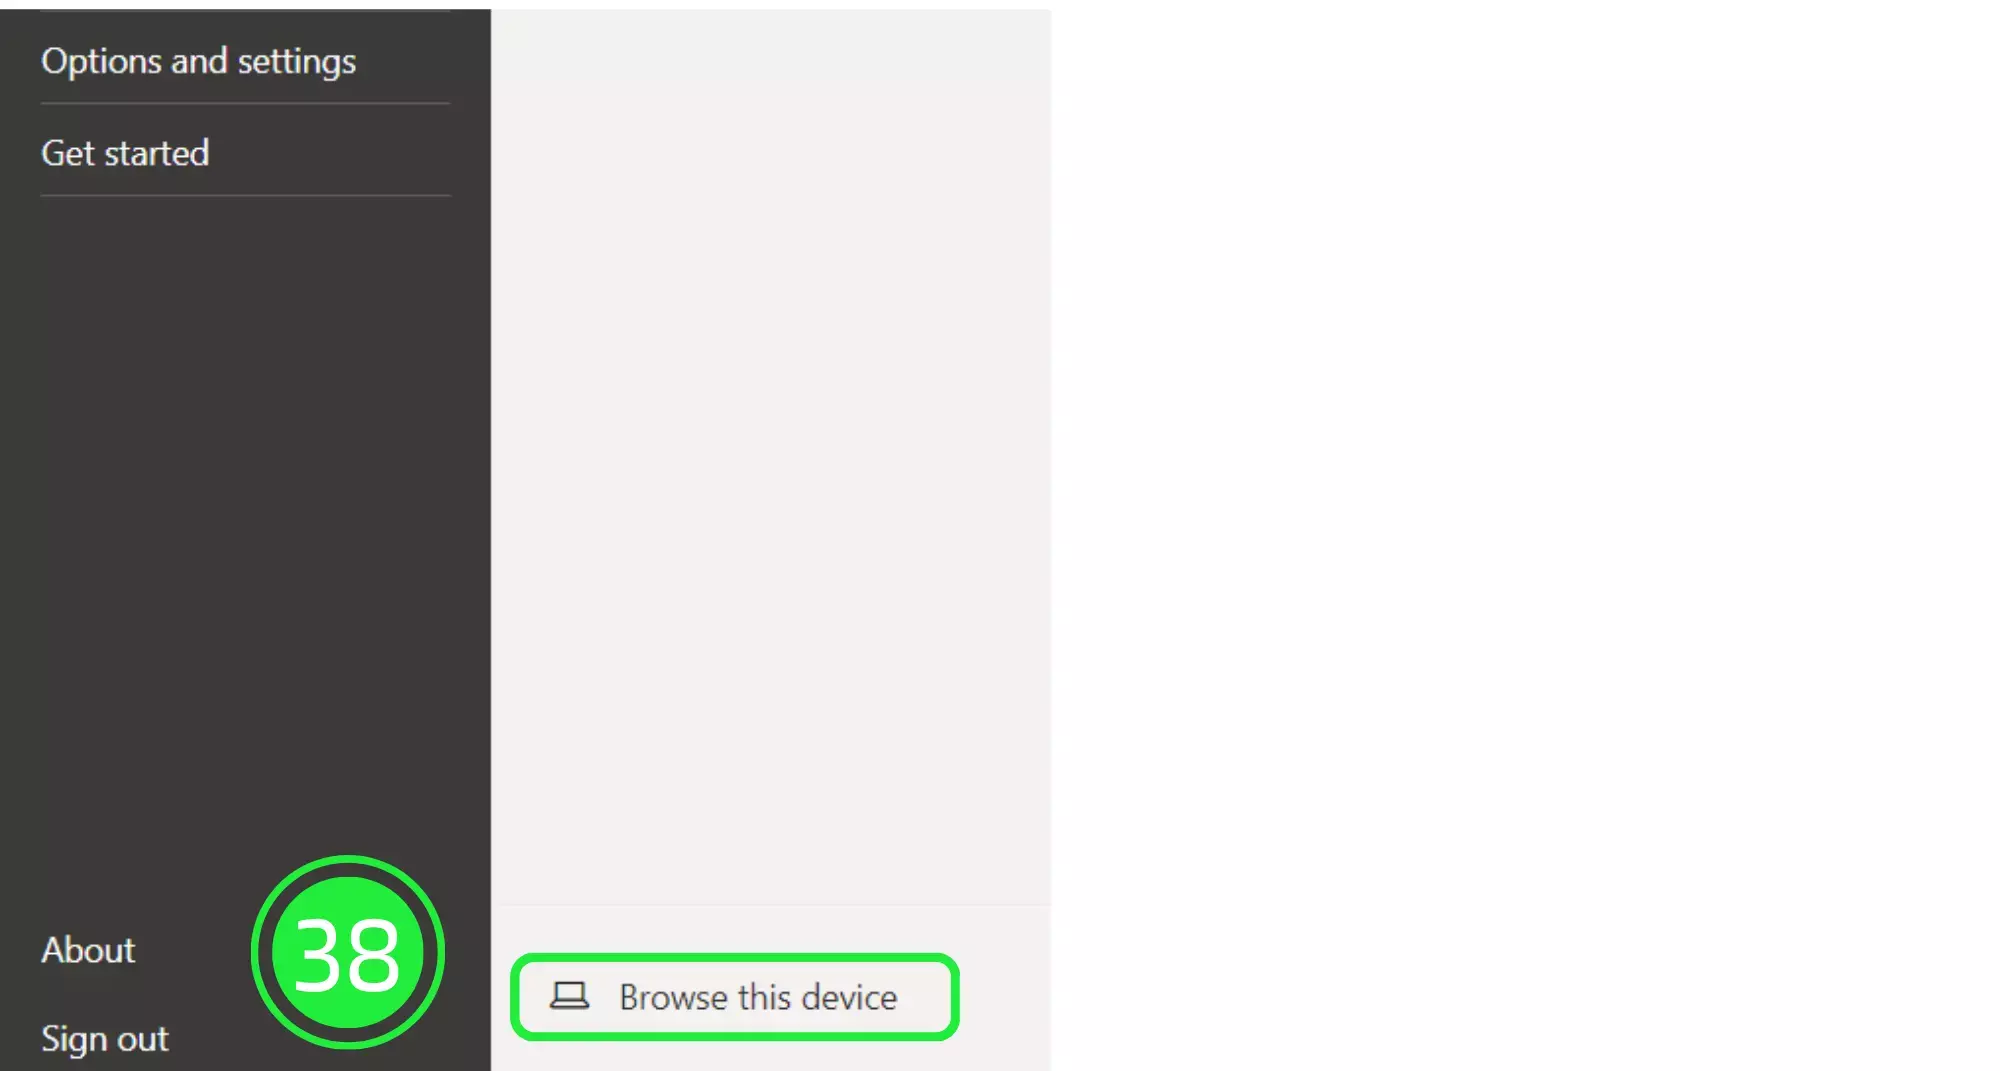
Click on “Browse this device” at the bottom of the screen.
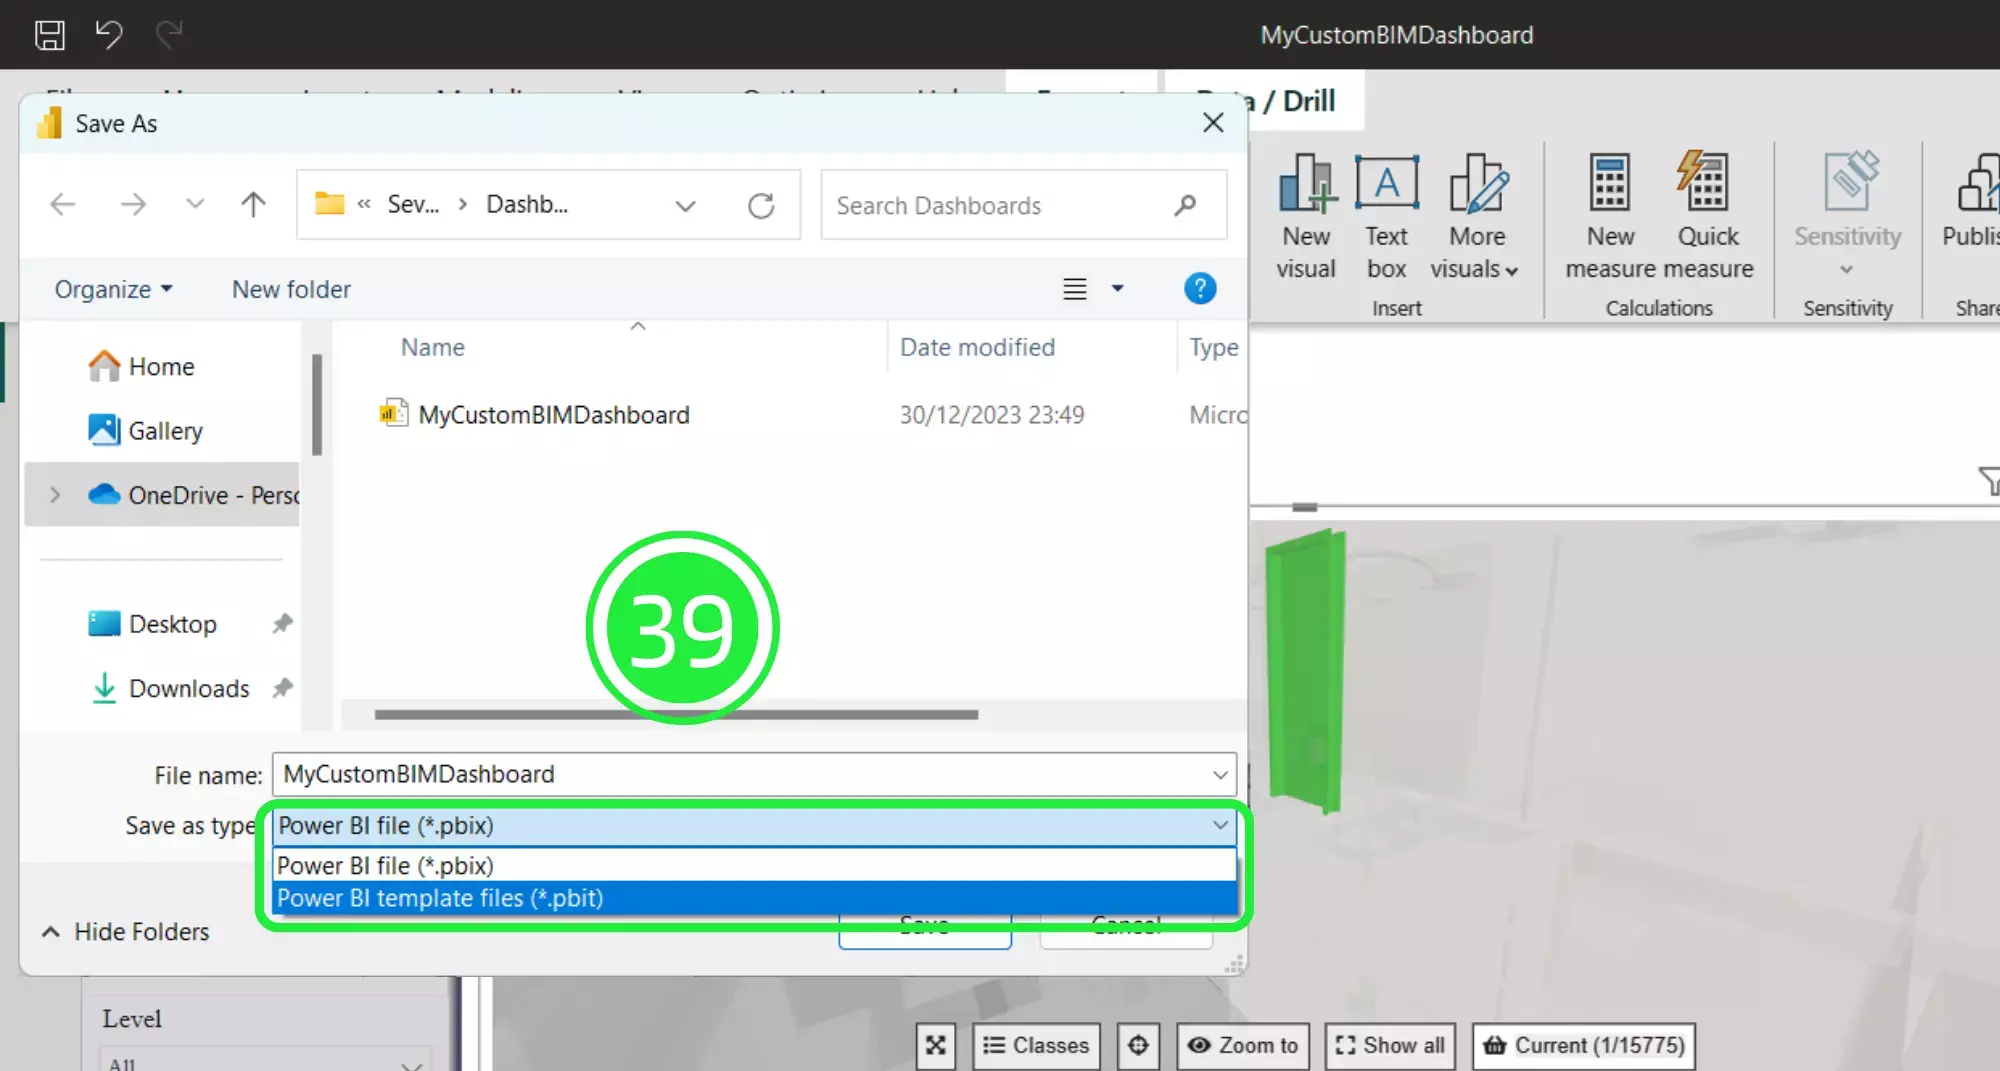
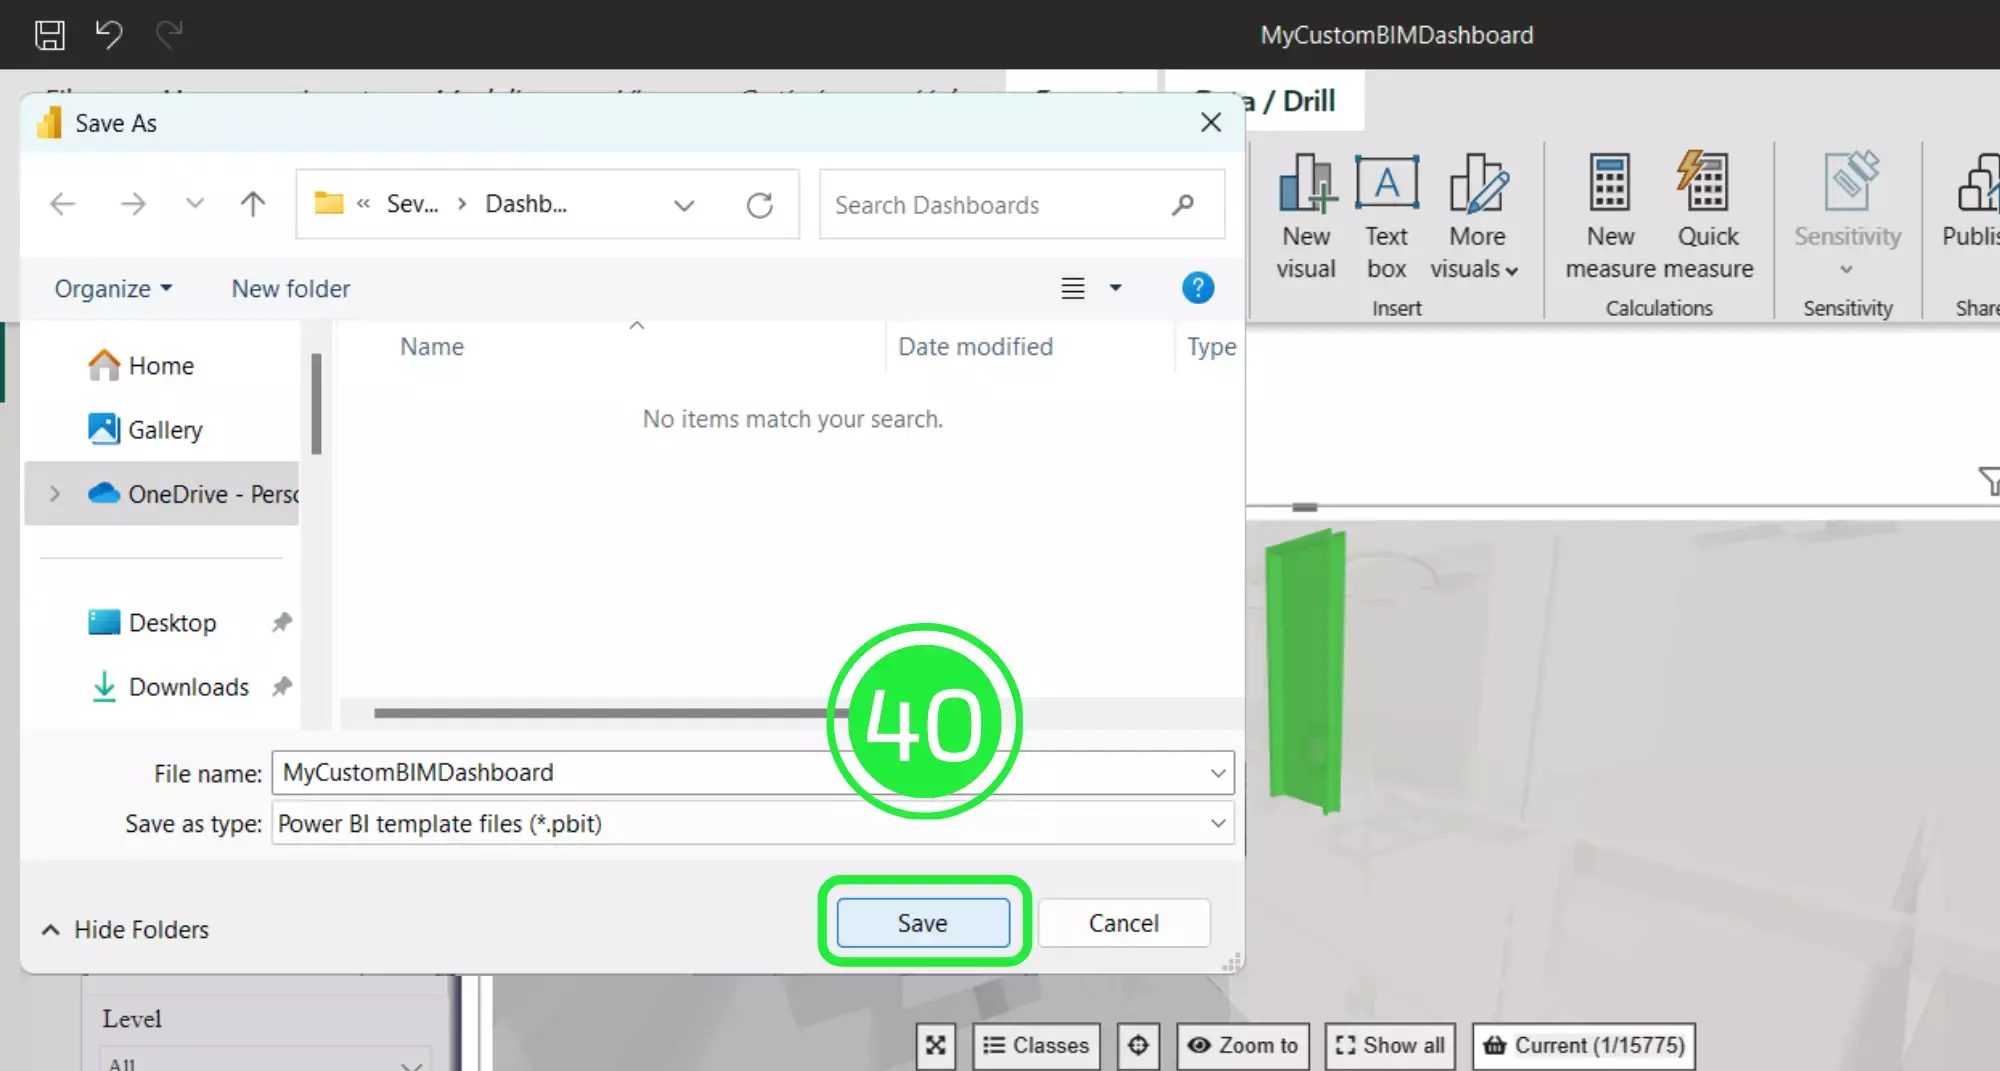
Choose to save the file as a Power BI template file (.pbit).
Click on the “Save” button to save your project to your computer. You have done 80% of the work to organize and showcase your BIM properties.
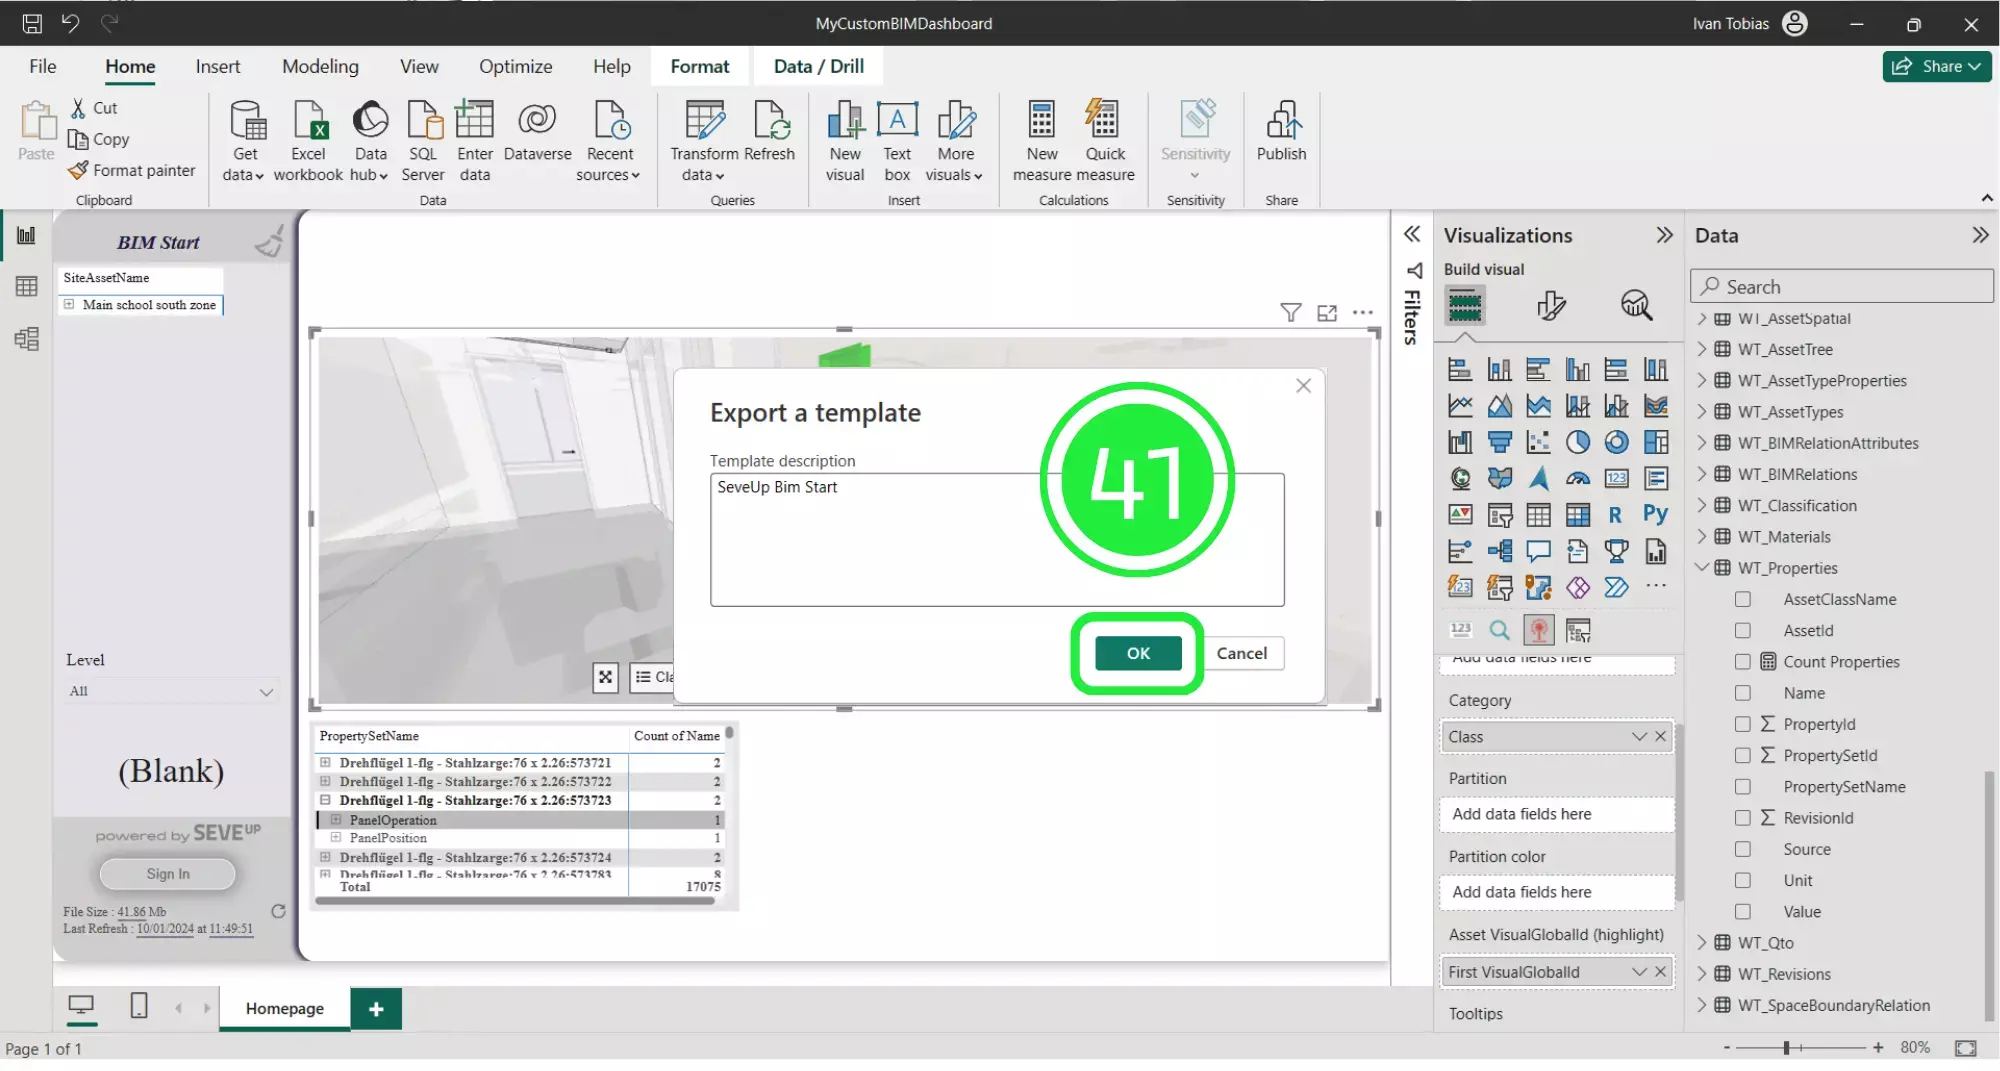
Press on “ok” when the “Export a Template” pop-up appears.
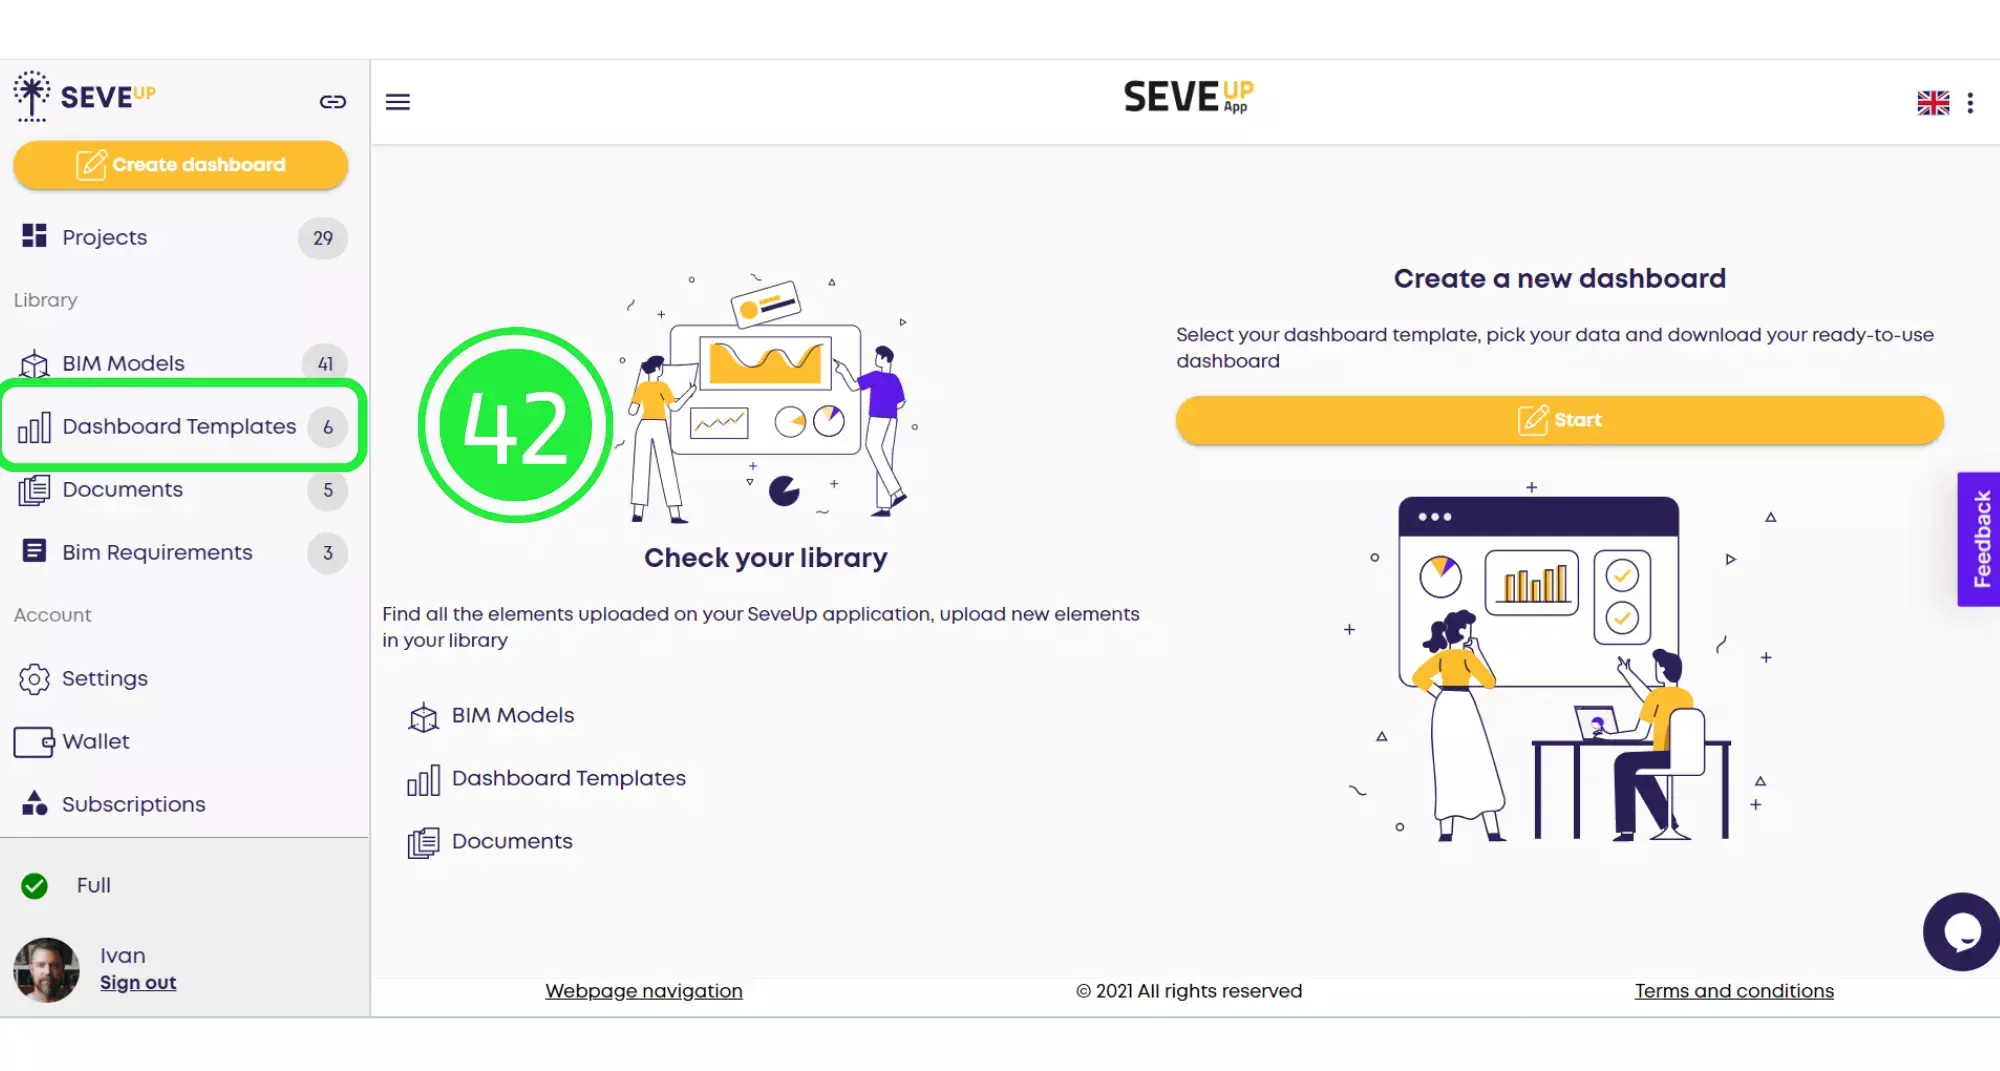
Open the SeveUp App again and click on “Dashboard Templates” on the left hand side.
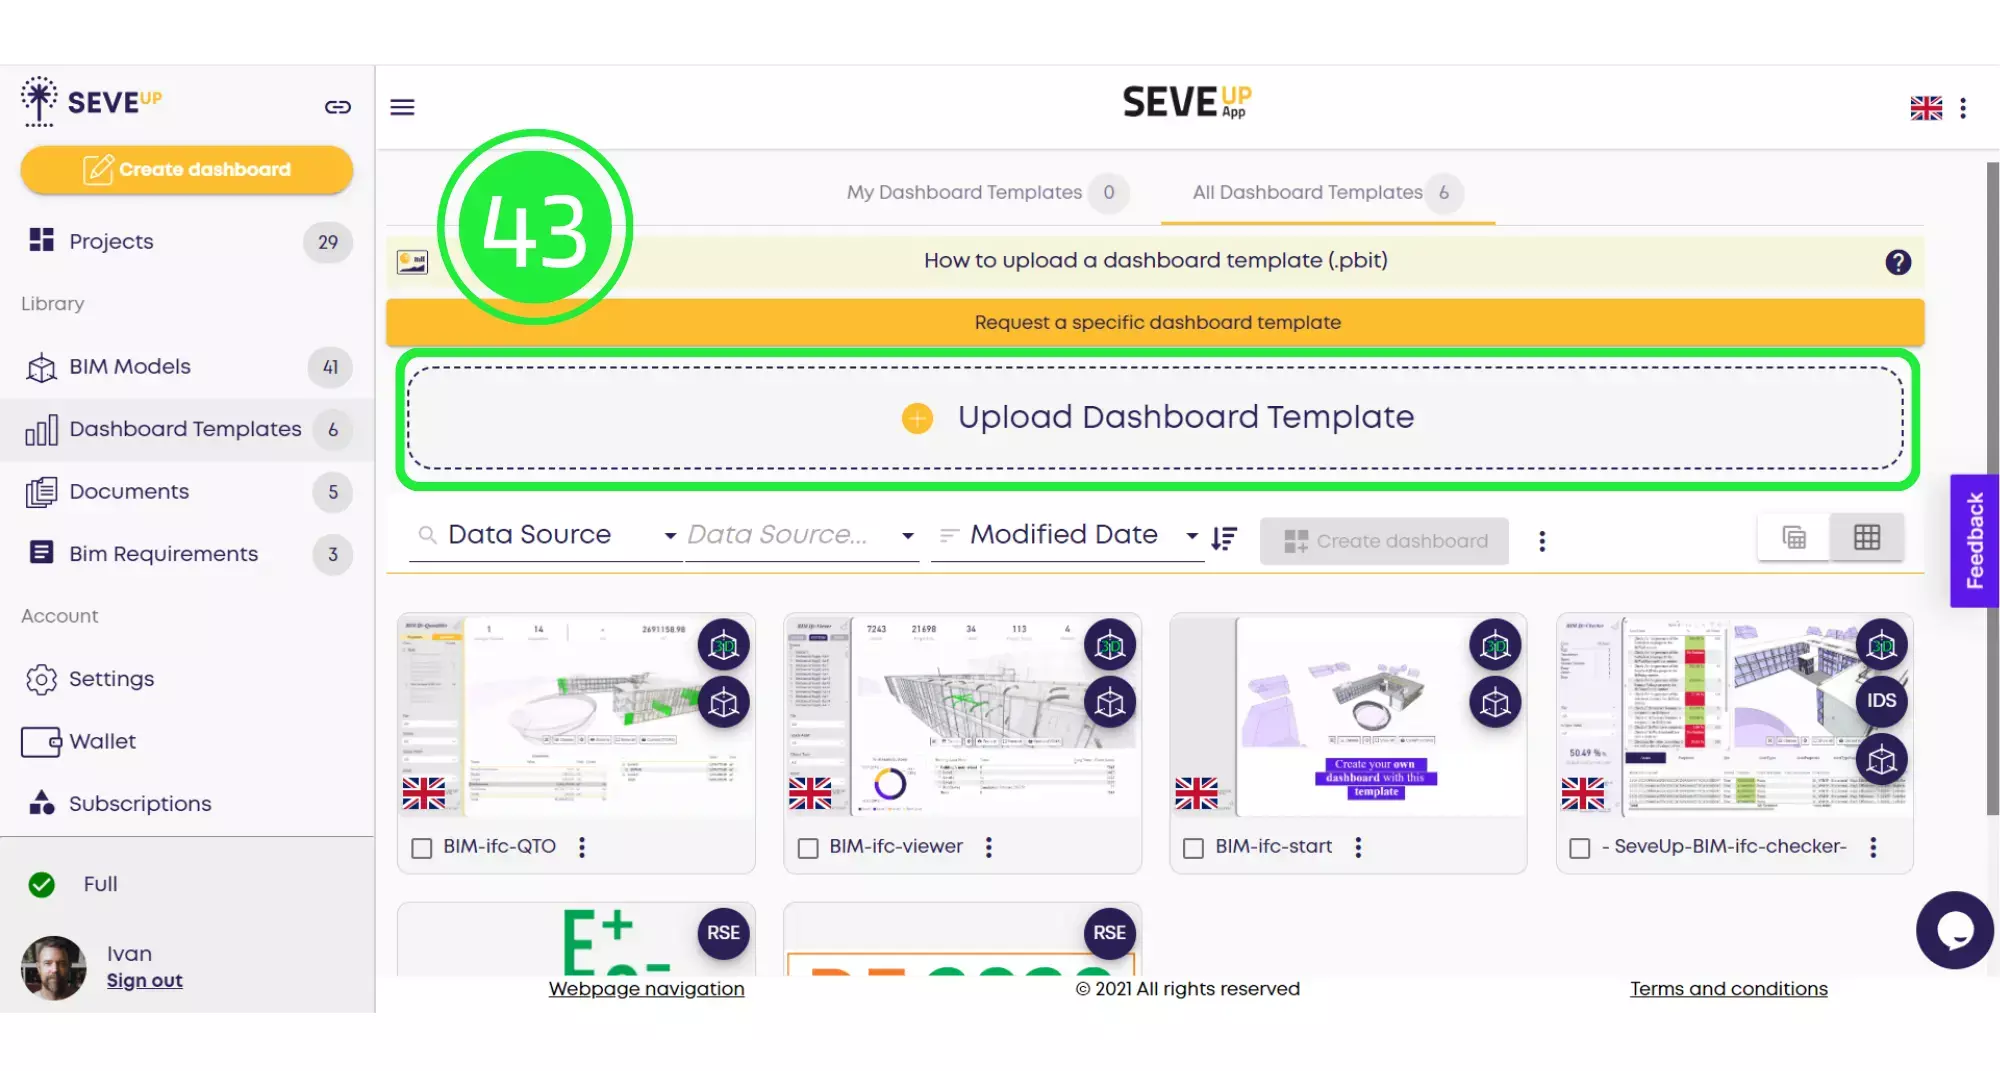
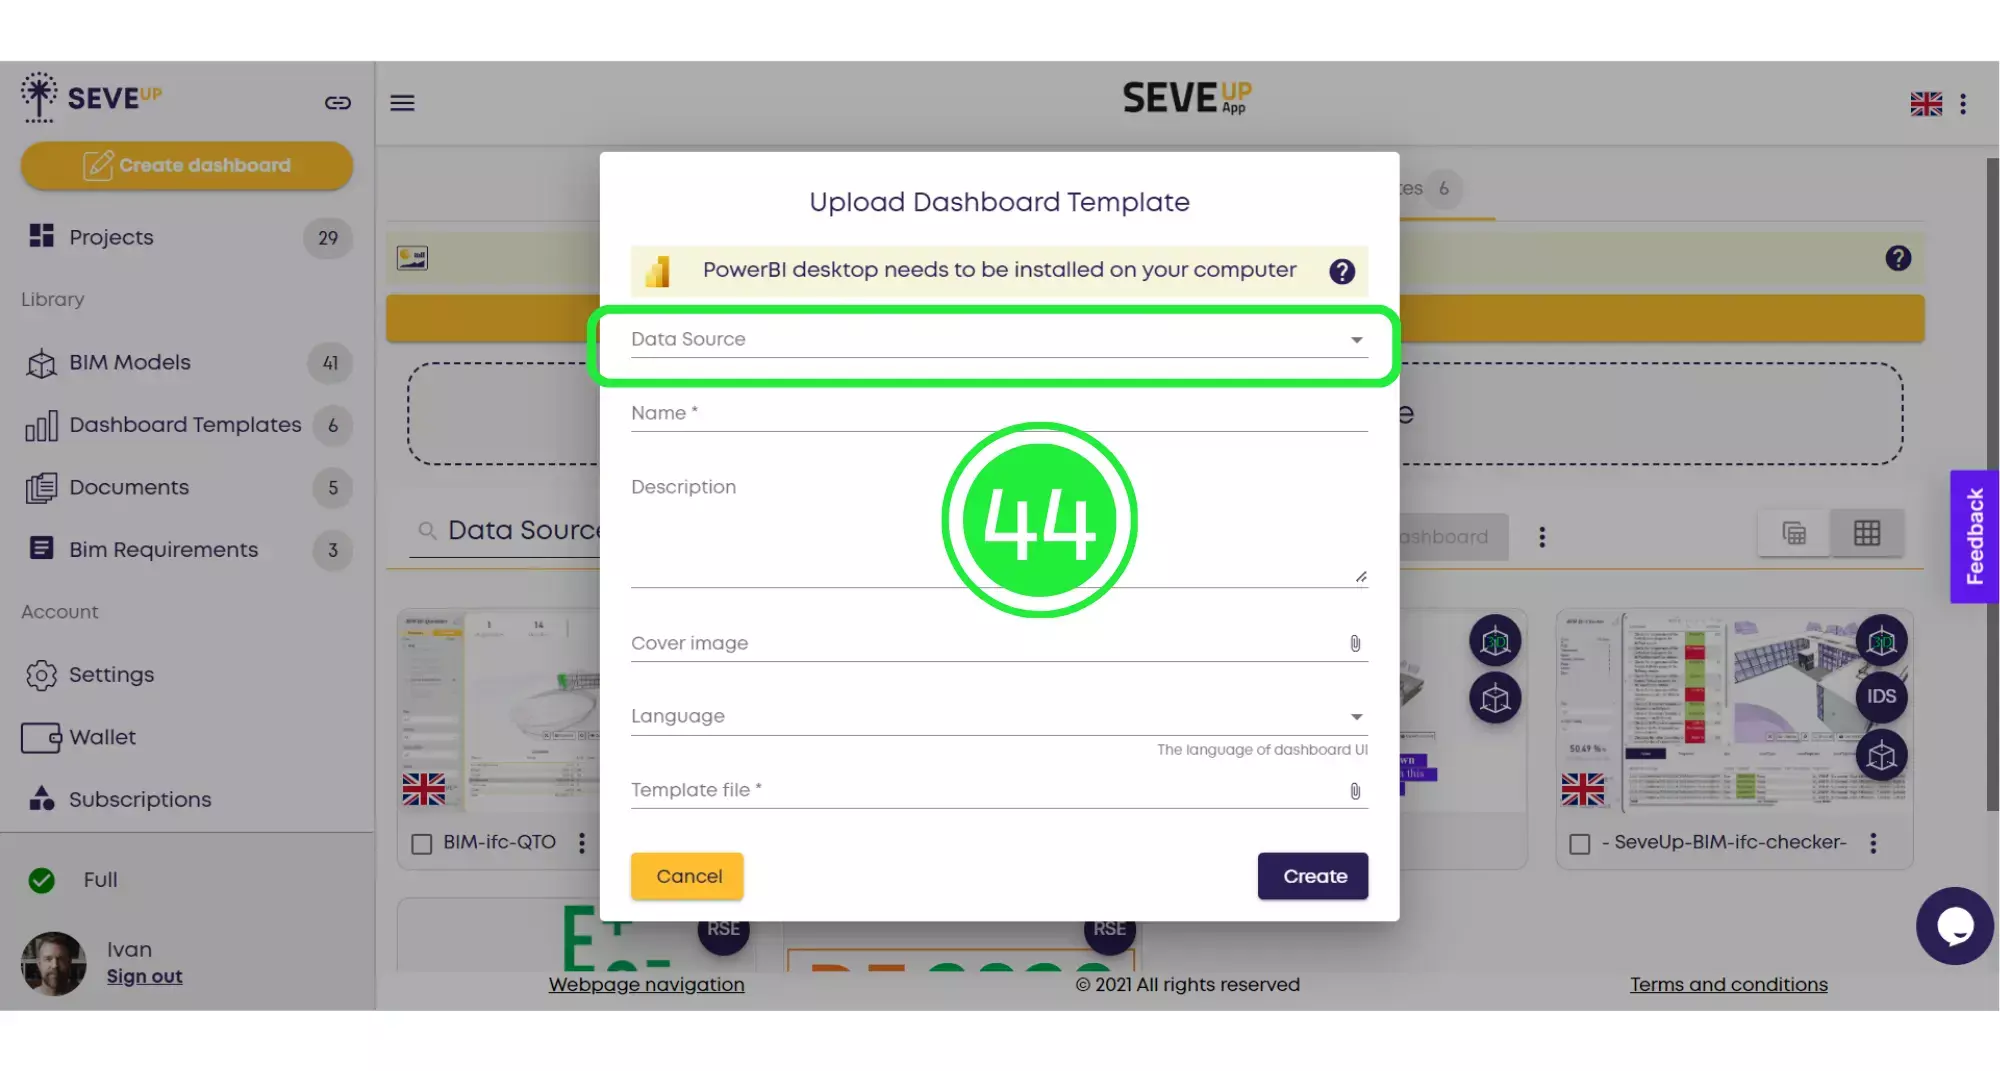
Click on the large “Upload Dashboard Template” button in the centre of the folder.
When the pop-up appears, click on “Data Source”.
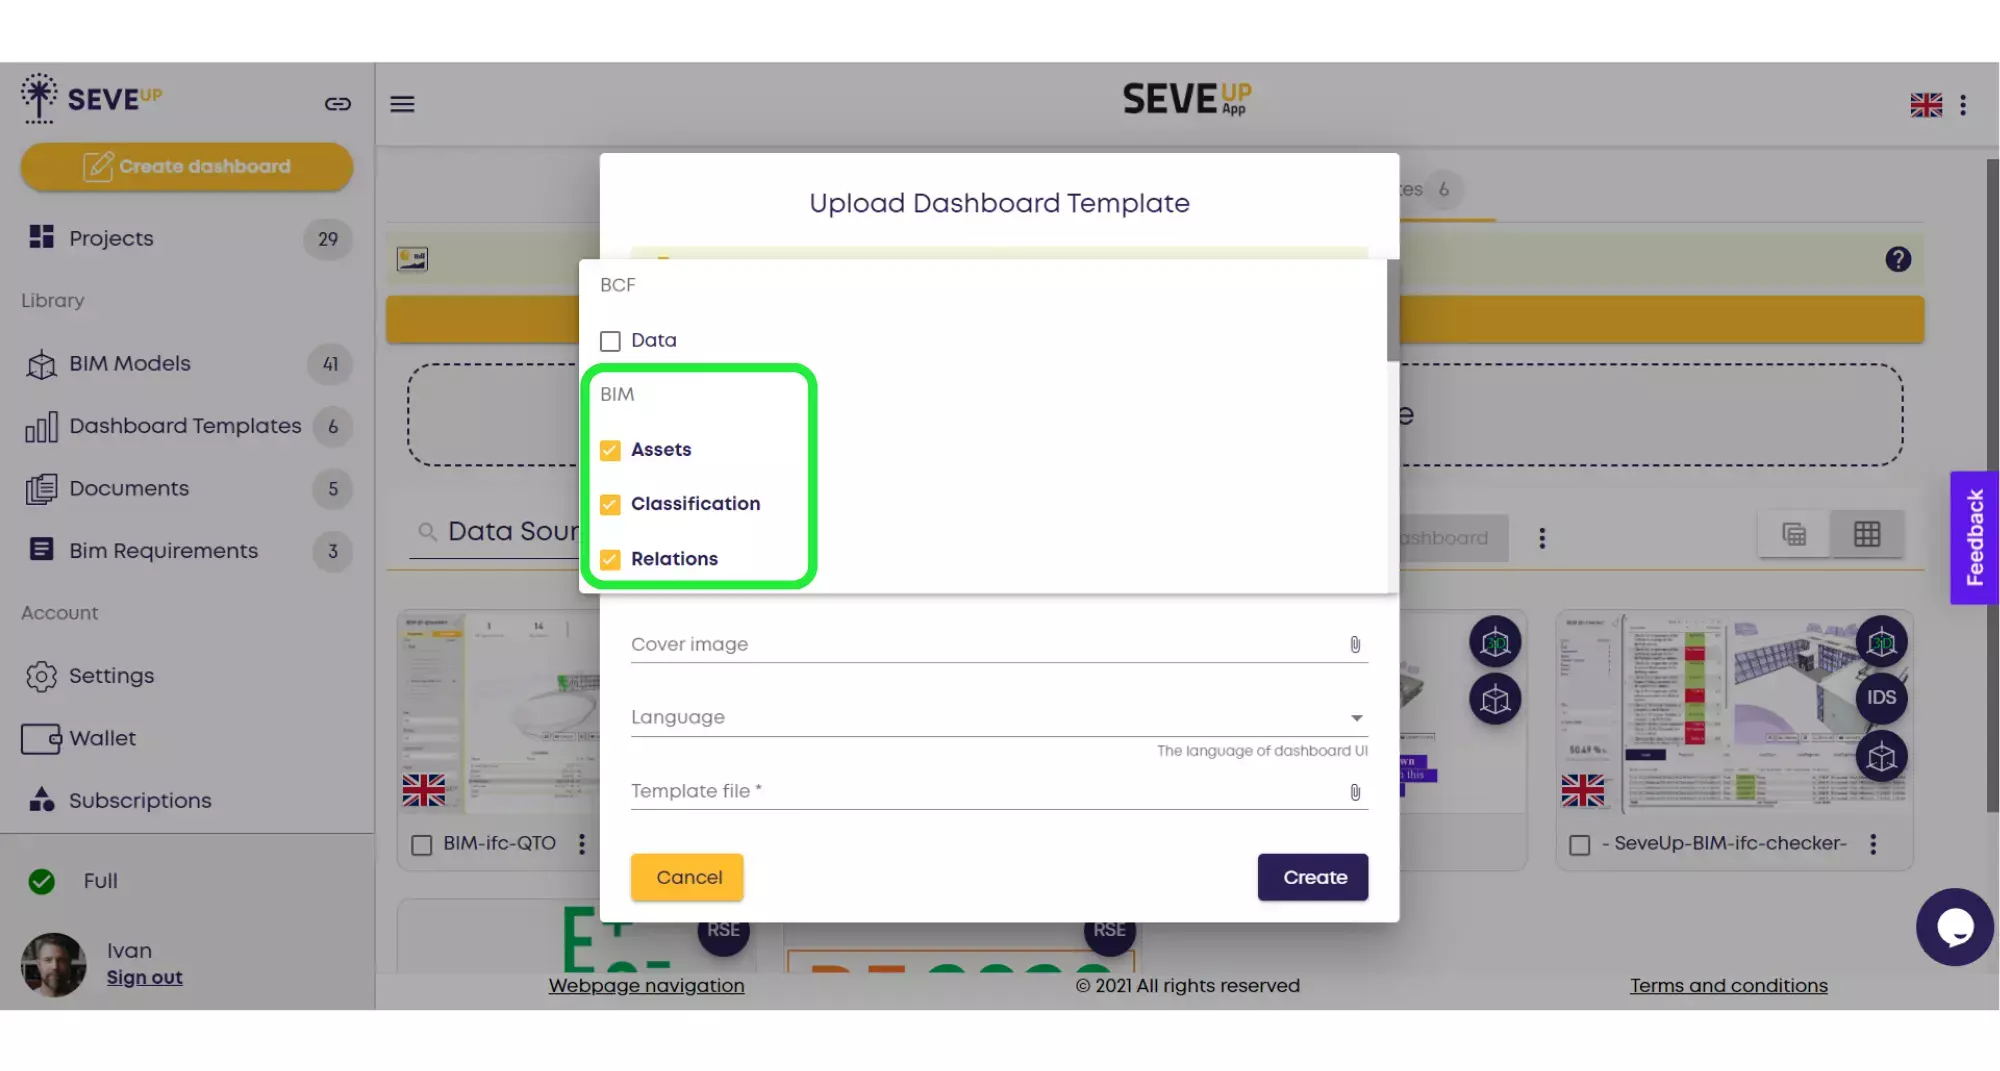
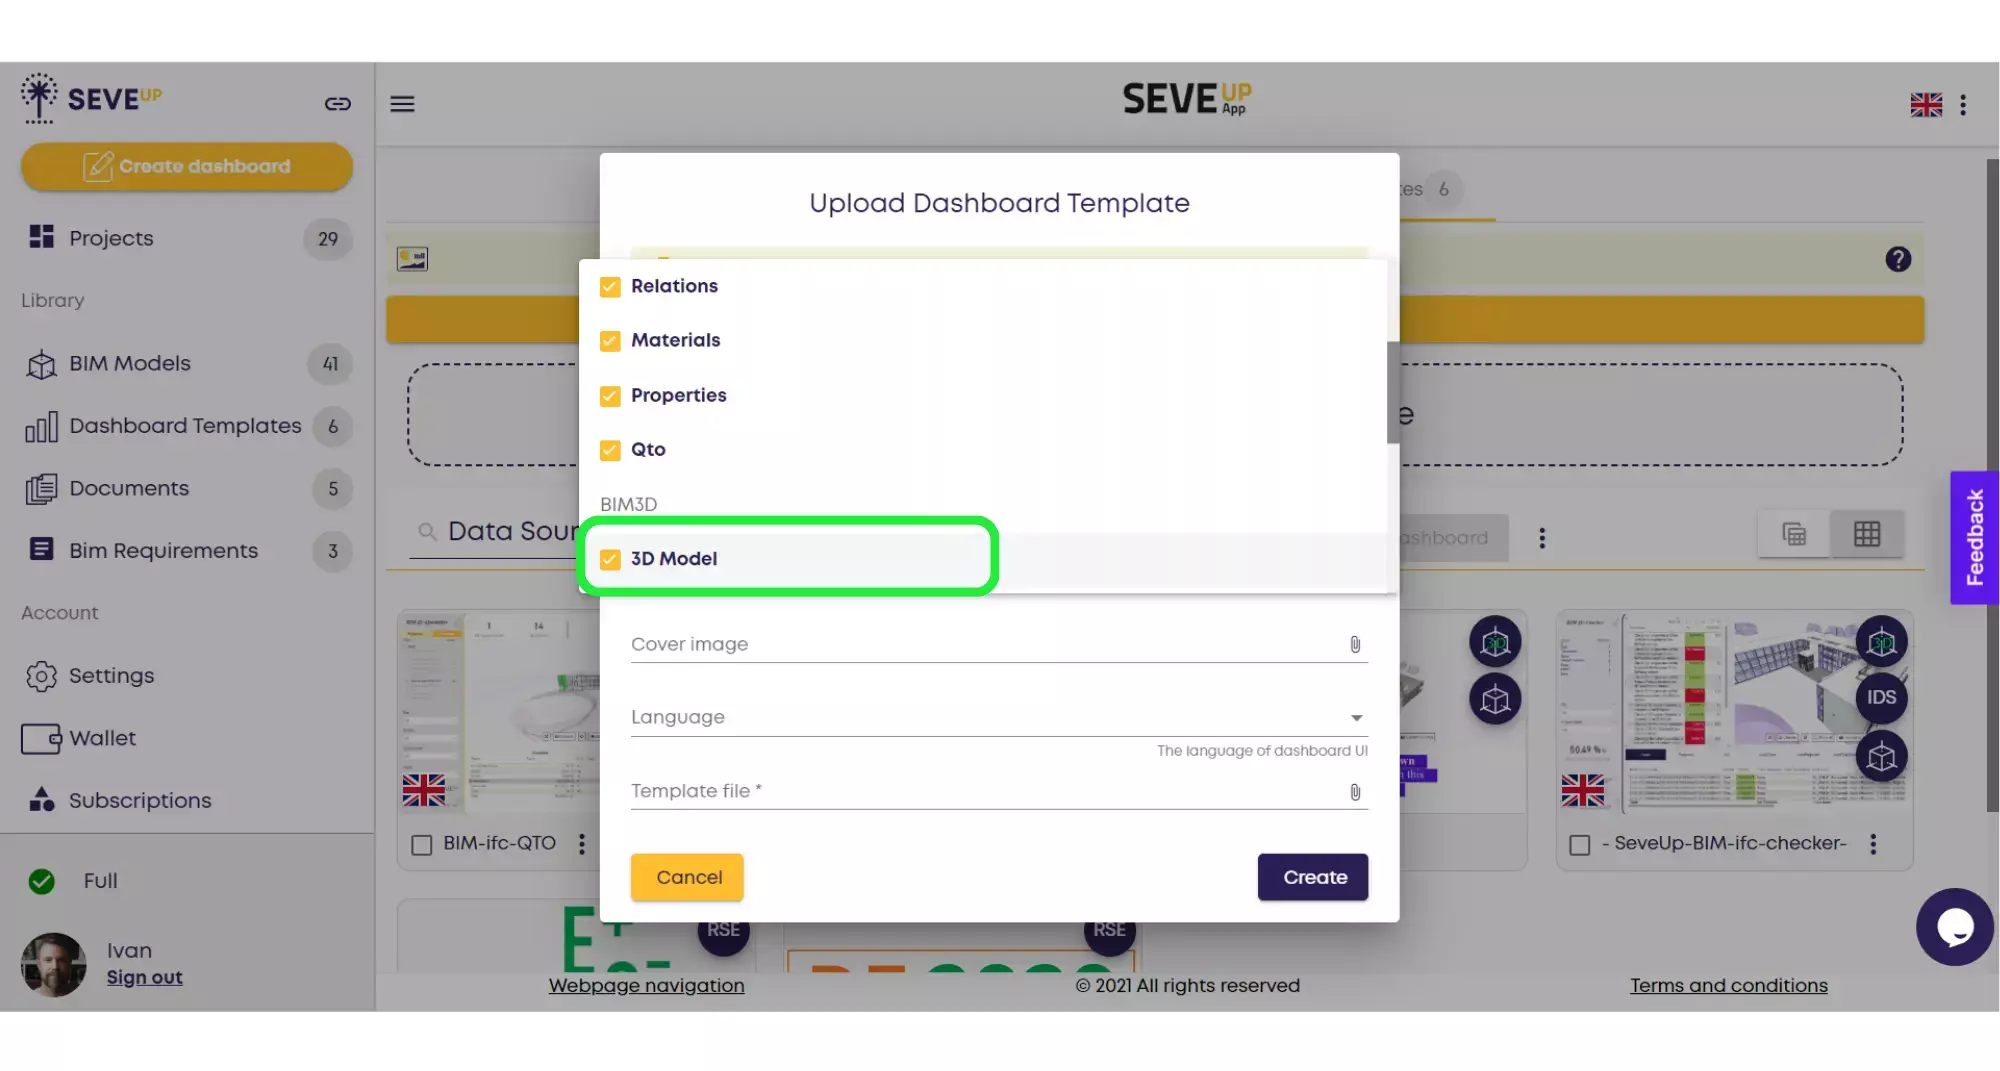
Check off all of the groups of tables under BIM and also make sure to check the BIM 3D option so that the 3D model is included as well.
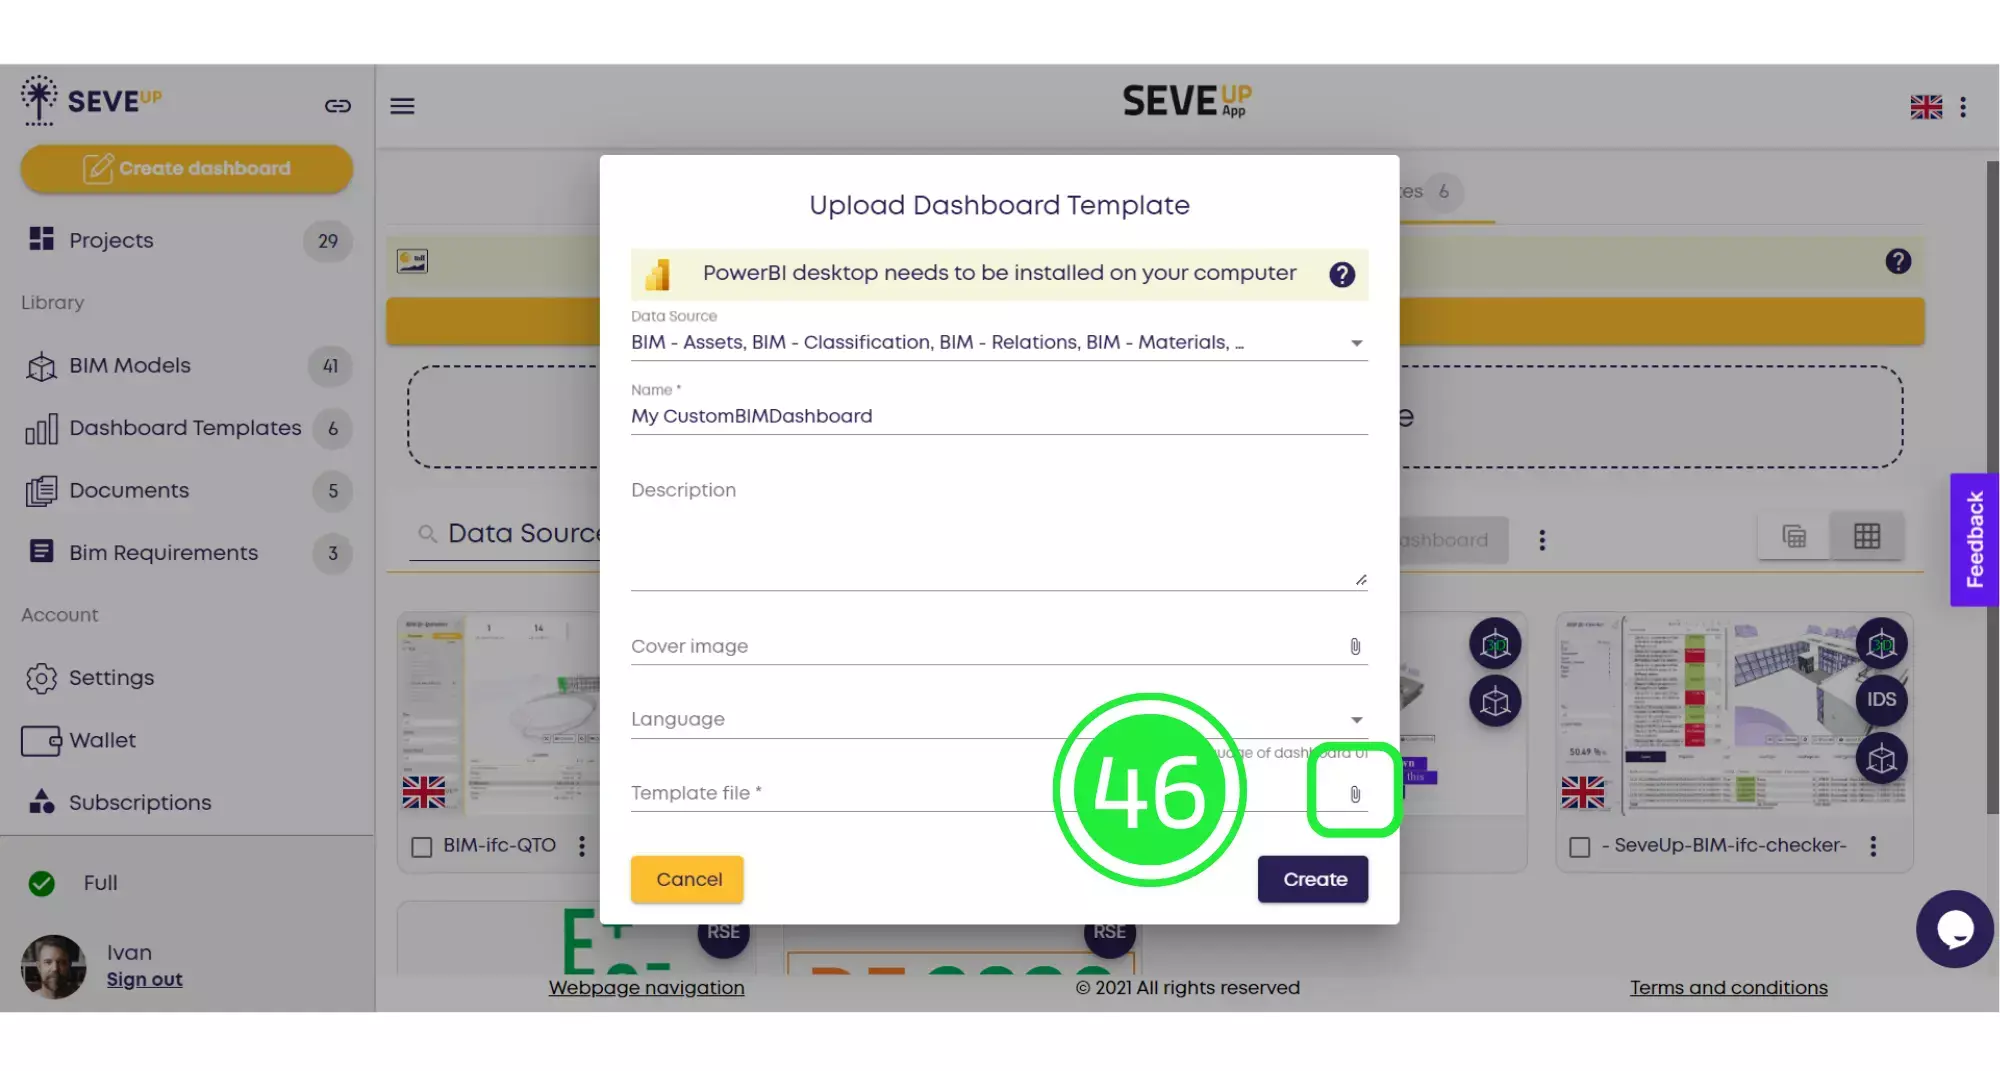
Enter the name and description of your project. You can also attach a cover image or choose a different language.

Click on the “Attach File” icon on the “Template File” line.
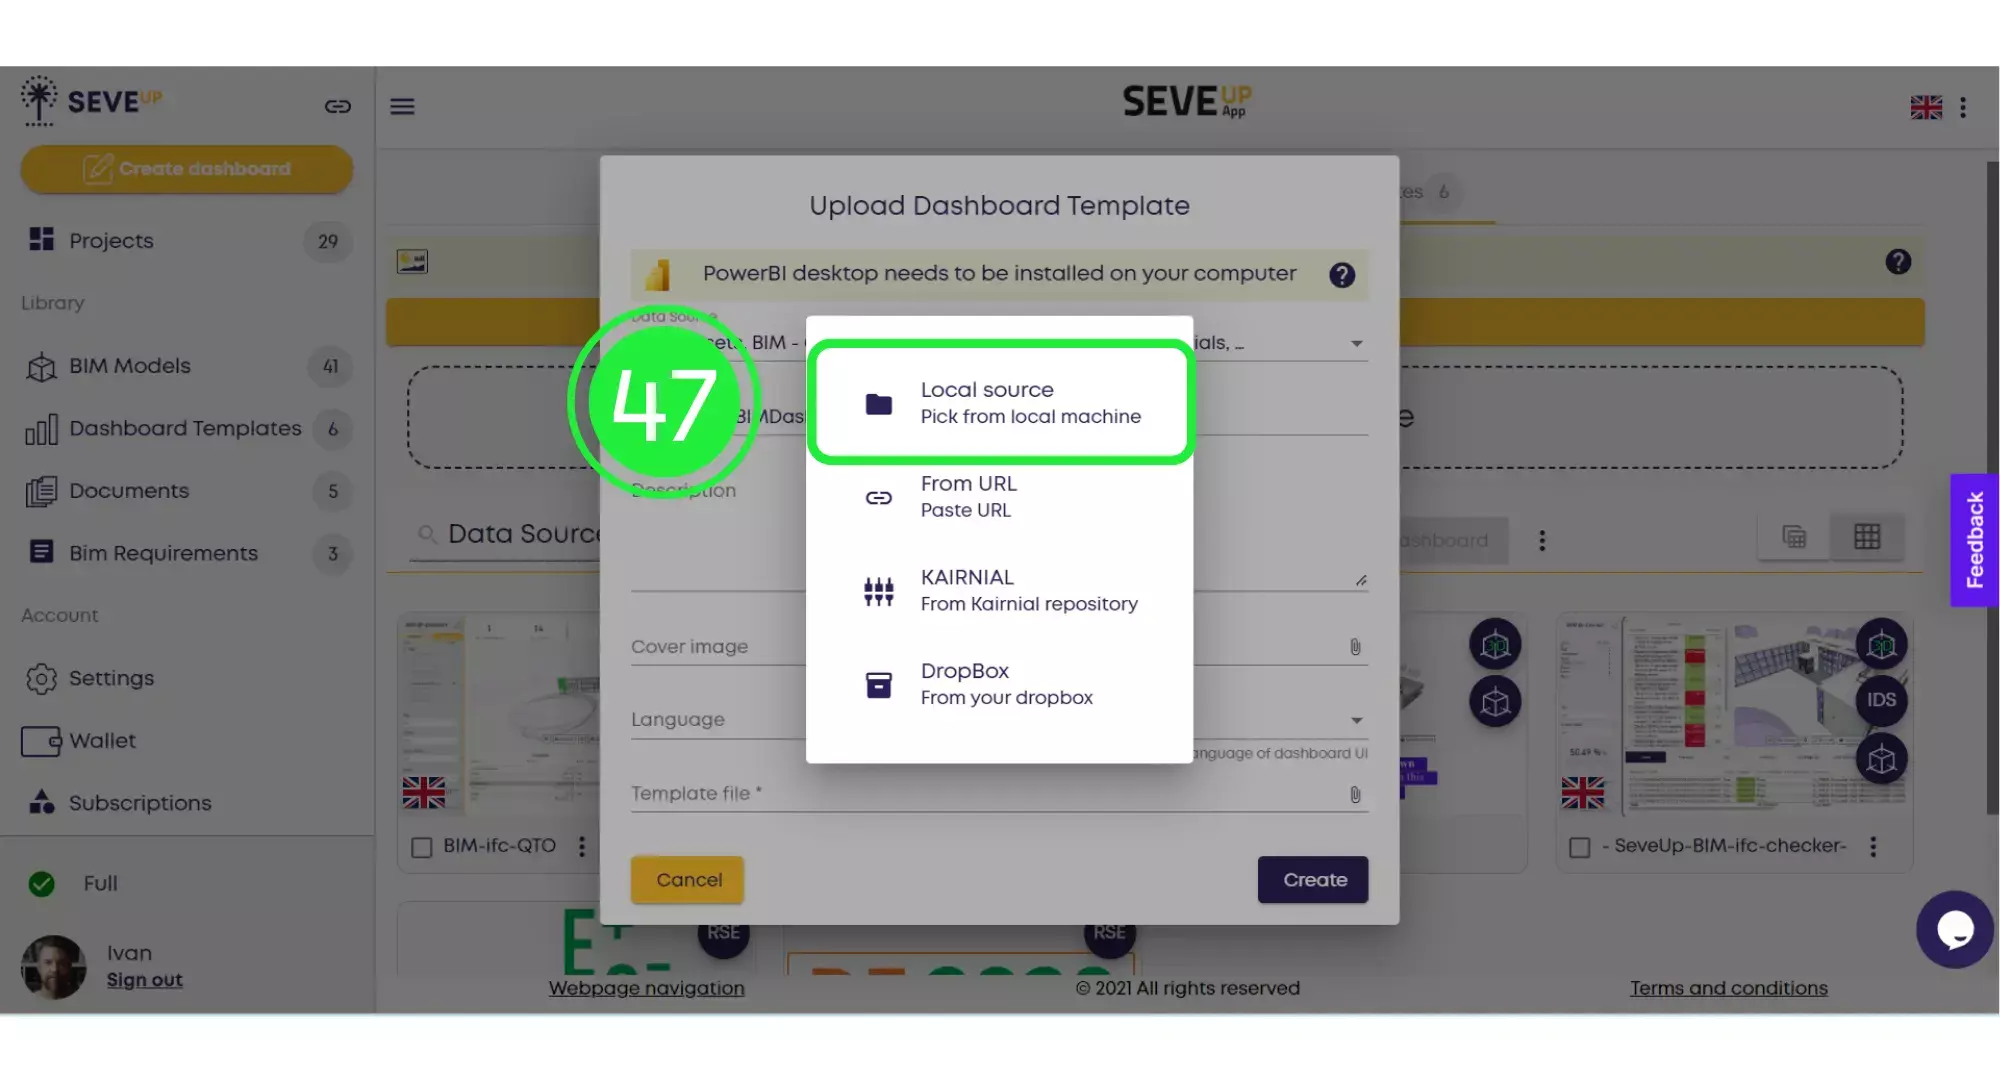
From the pop-up menu choose “Local Source” to attach the file from your computer.
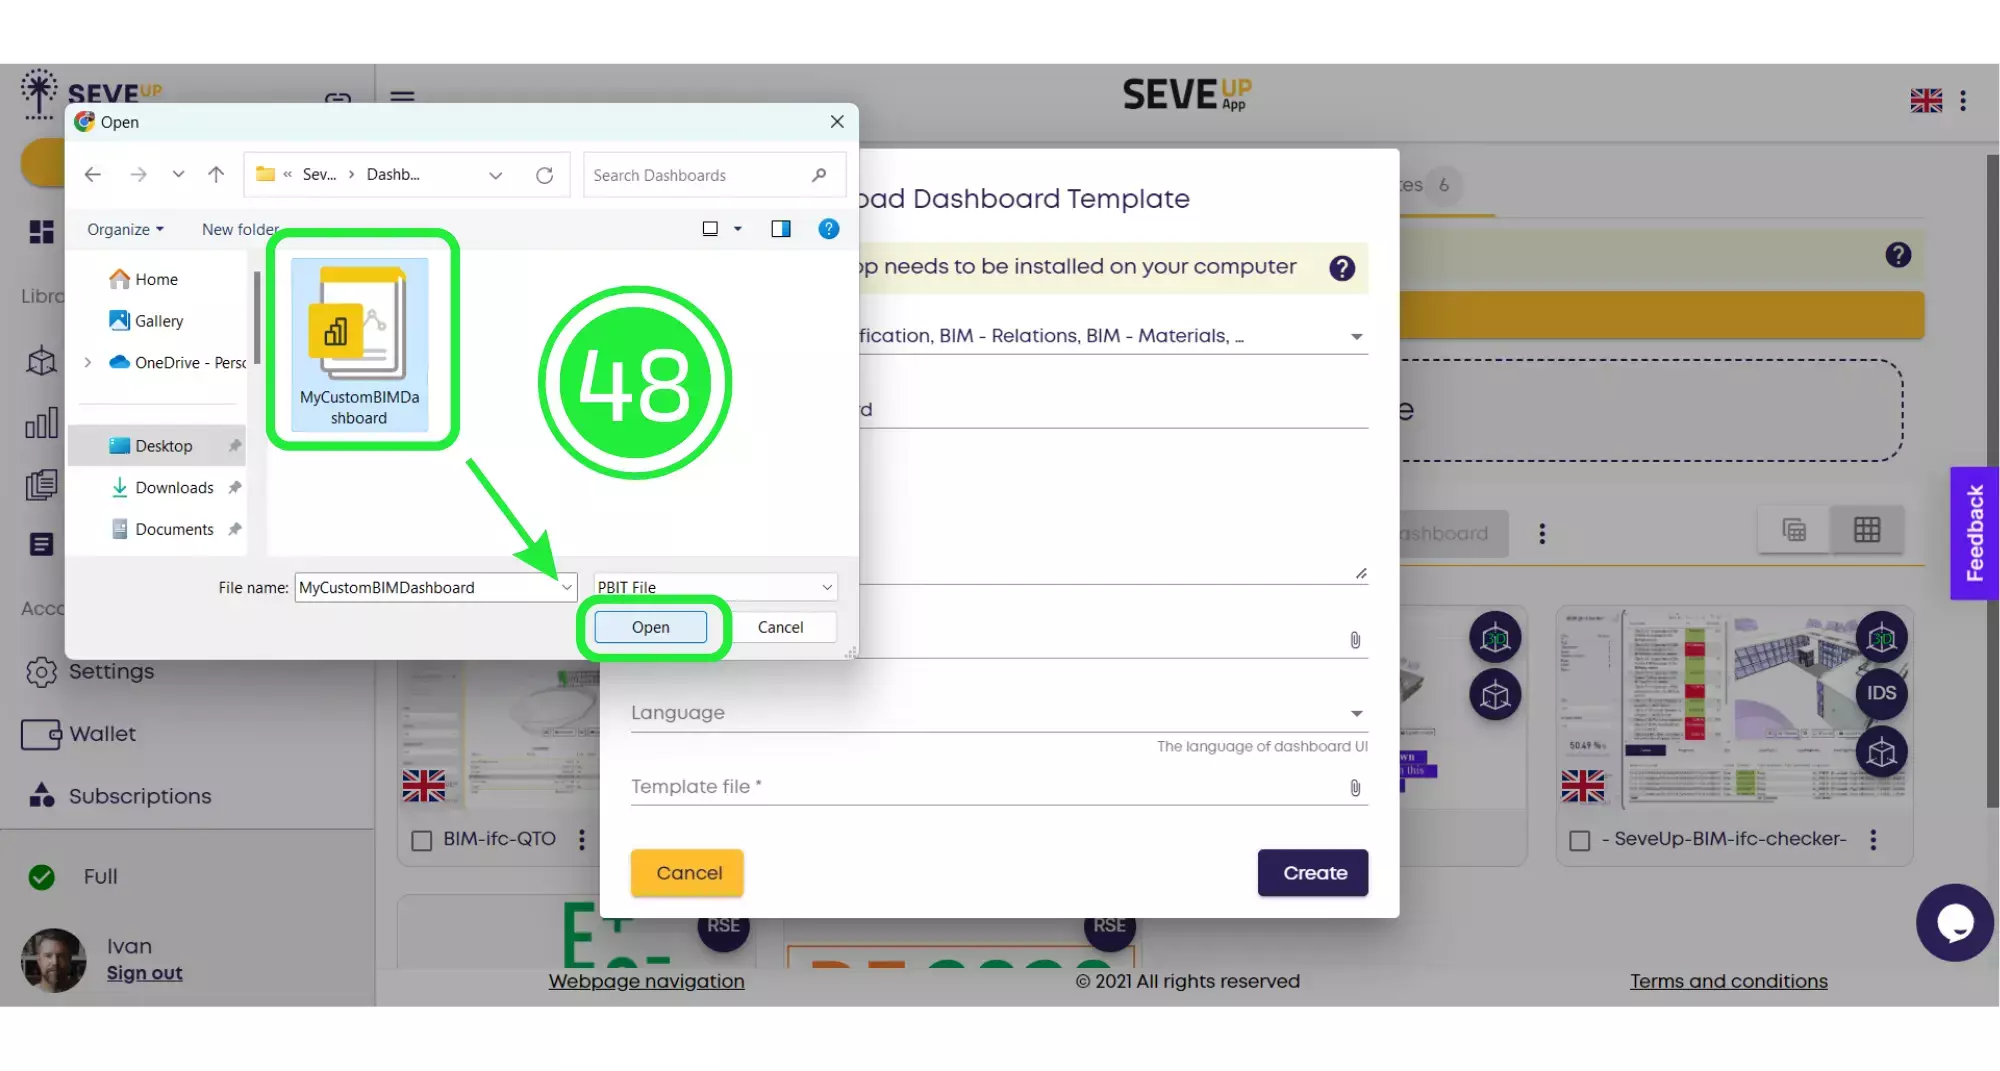
Select your template and click on “Open”.
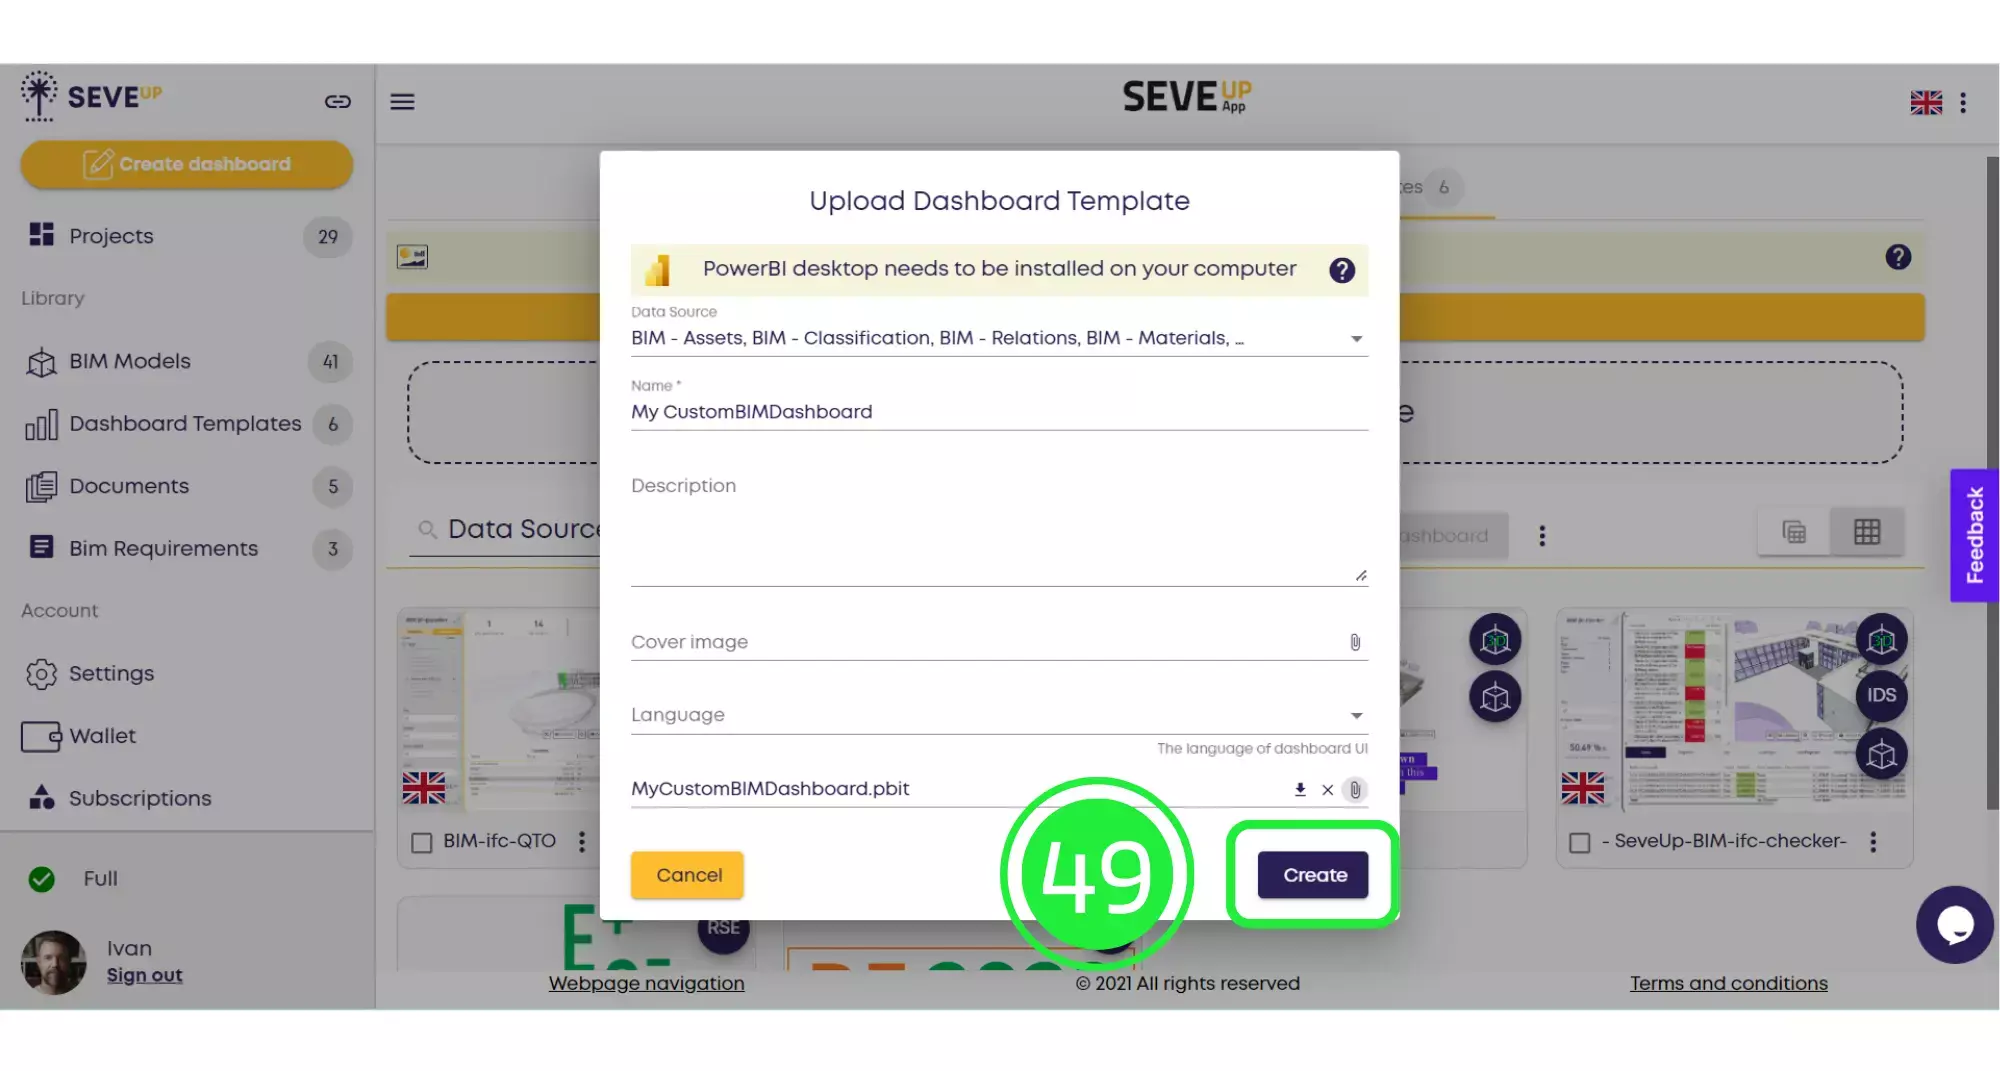
Click on “Create” to finish uploading your template into the SeveUp app.
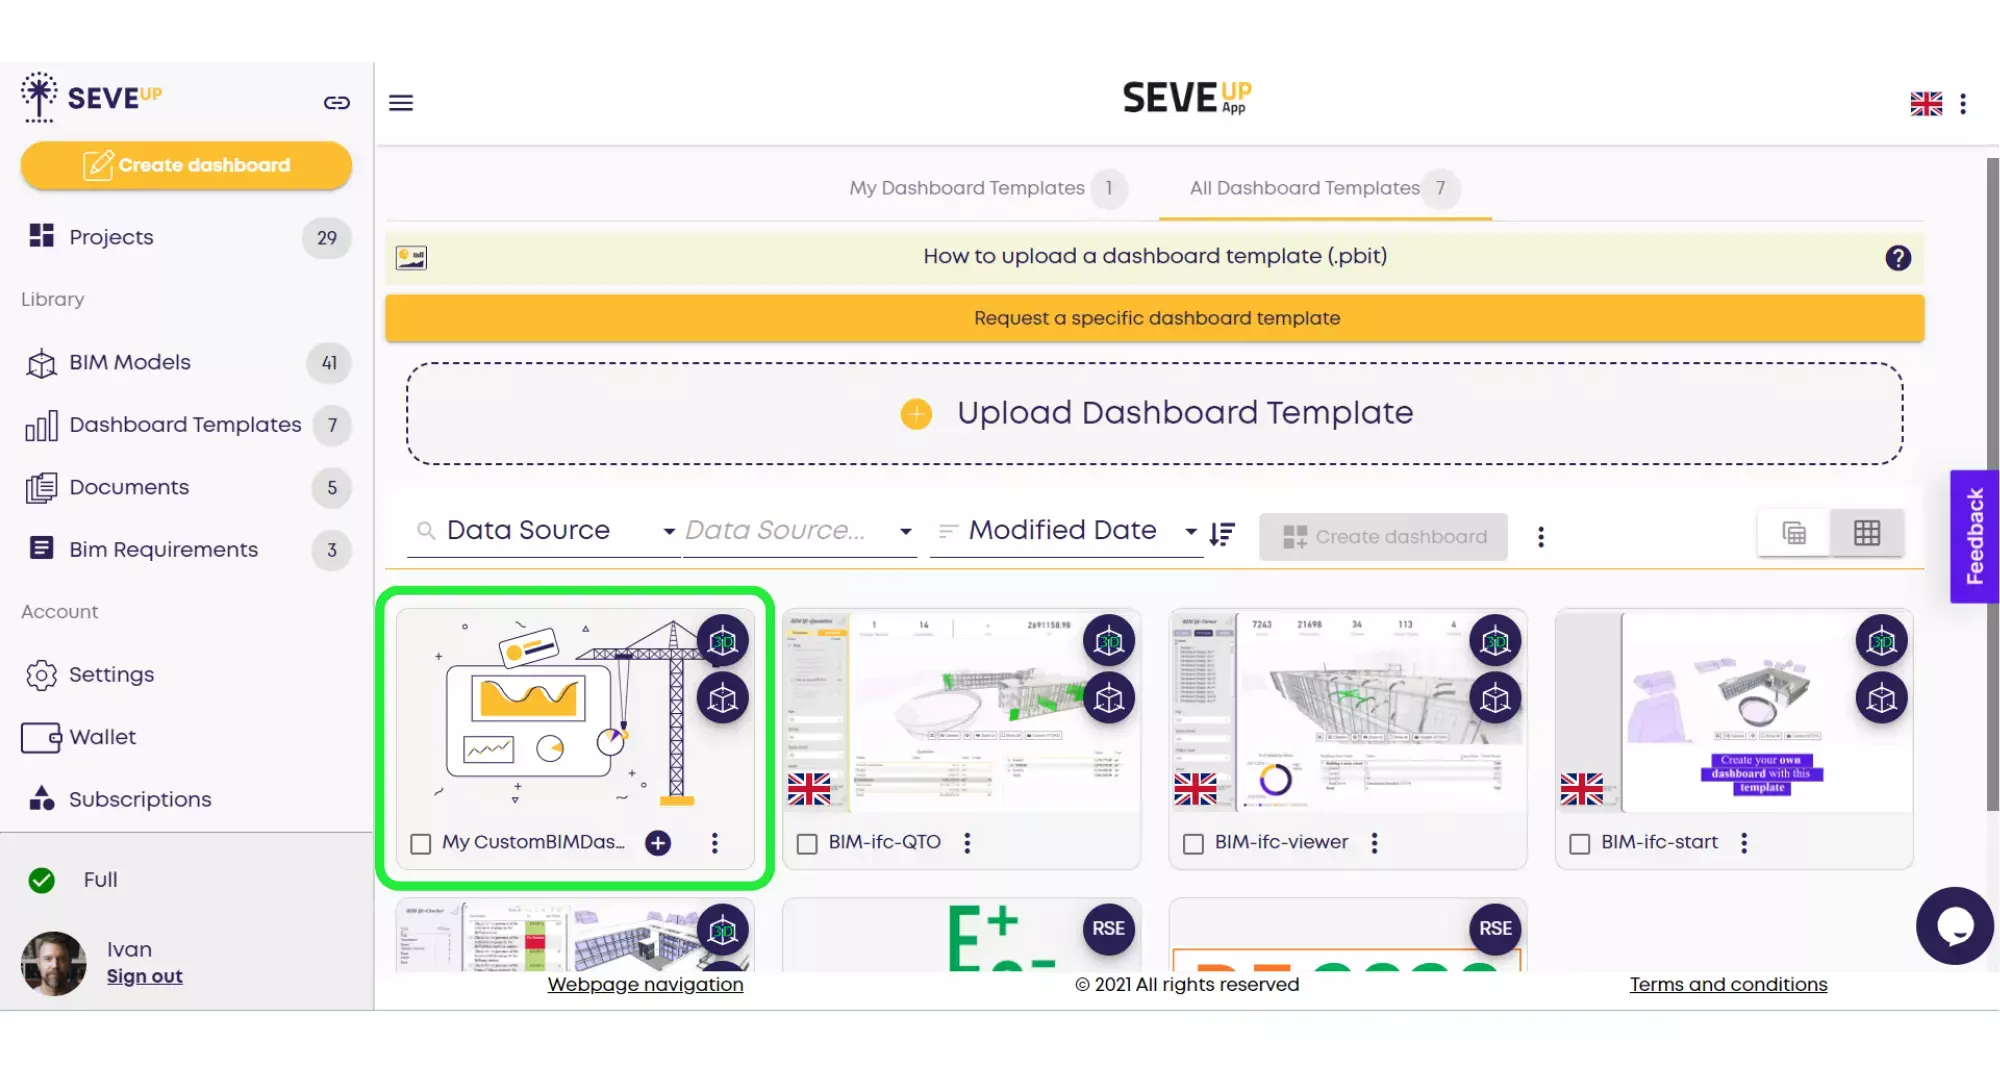
Your newly created template file will now appear in the Dashboard Templates folder and it can be used in any number of projects without the need to create a brand new template each time.
You did it ! You know now arrange and exhibit your BIM properties.
Want to get started with your very own BIM project? You’ll be surprised by just how easy it is. Create your own free account is SeveUp today and give it a try.


Want to get started with your very own BIM project? You’ll be surprised by just how easy it is. Create your own free account is SeveUp today and give it a try.

Unlock the power of your building data with SeveUp. Tailored dashboards, seamless integration
🎓 Free BIM Checker Training Learn how to automate your BIM model checks and get certified. Register for Free Click
Learn More🎓 Free BIM Checker Training Learn how to automate your BIM model checks and get certified. Register for Free Click
Learn More🎓 Free BIM Checker Training Learn how to automate your BIM model checks and get certified. Register for Free Choose
Learn More