Trusted by companies
all over the world:
In this tutorial we'll unravel the intricacies of 3D BIM viewer Customization in 5 min in Power BI, empowering you to craft a dashboard that not only captivates visually but also provides all the essential information to streamline your BIM process.
Whether you're aiming for a visually stunning display or need specific data points readily accessible, customization offers the flexibility to mould your dashboard to your exact requirements.
With the SeveUp 3D BIM viewer in Power BI, you have the tools at your fingertips to create a dashboard that strikes the perfect balance between aesthetics and functionality. From adjusting colour schemes and layouts to incorporating interactive elements and data visualisations, the possibilities are endless.
By tailoring your dashboard to suit your workflow and project needs, you can ensure that all relevant information is at your fingertips, facilitating quicker decision-making and enhancing productivity.
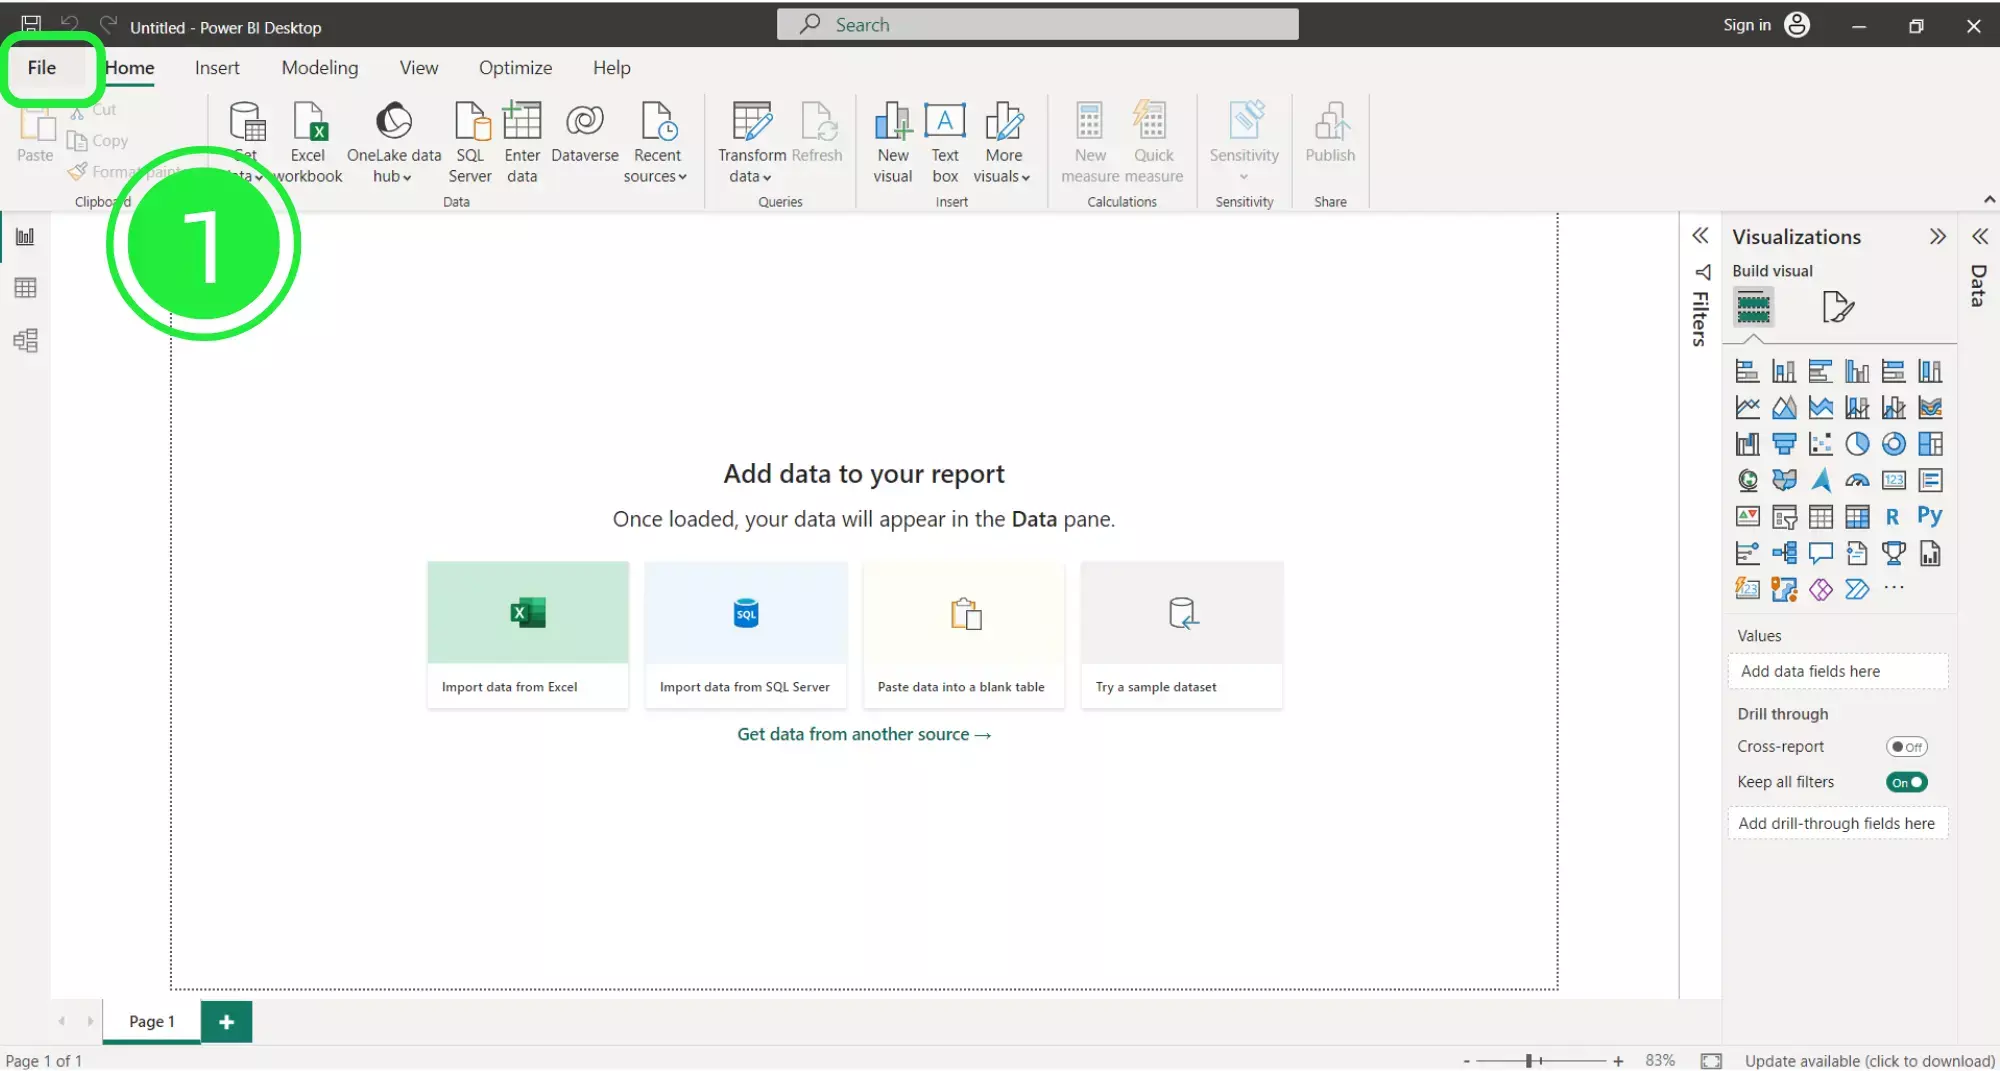
Start by open up Microsoft Power BI and click on “File” on the top left of the page. This short tutorial will show you how to customize our incredible 3D BIM viewer in just 5 minutes.
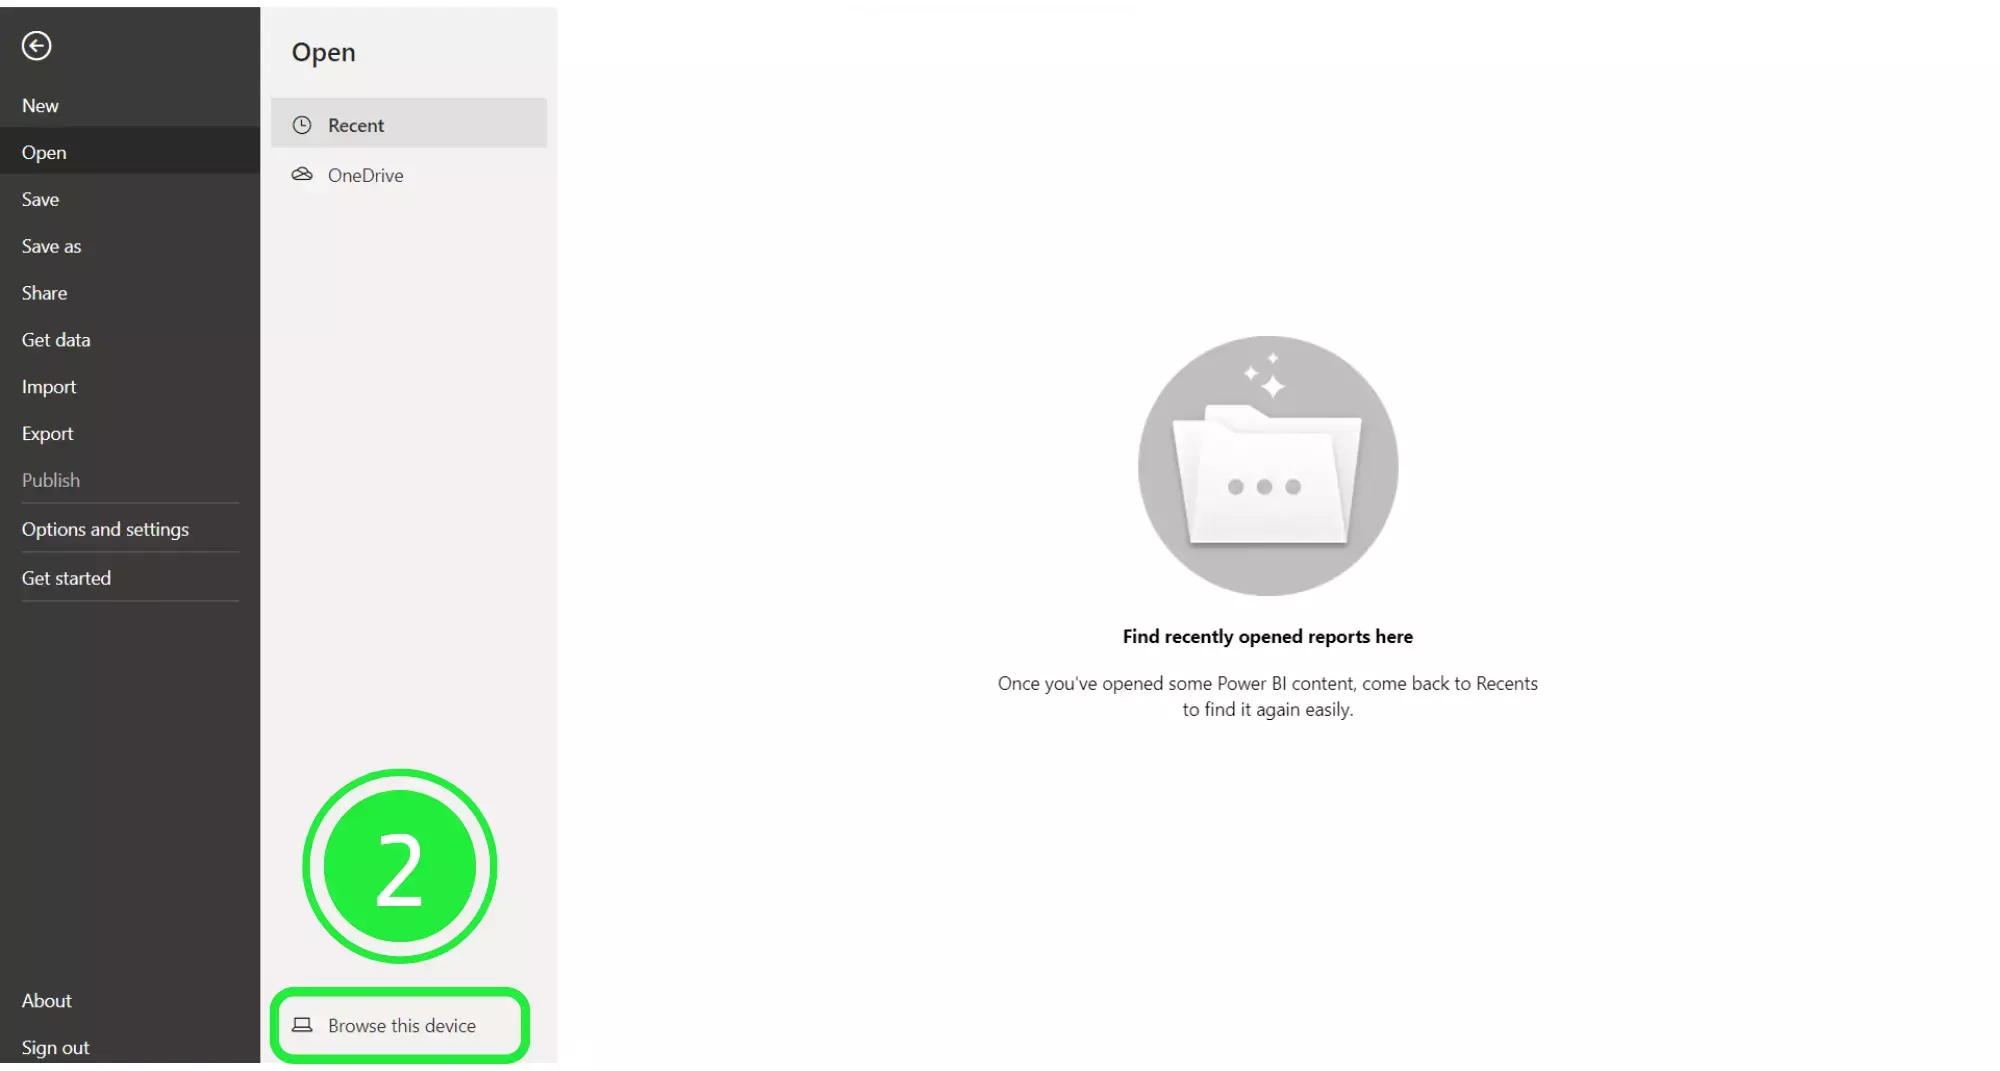
A menu will open up. Click on the “Browse this device” button at the bottom of the screen to search for your newly downloaded dashboard.
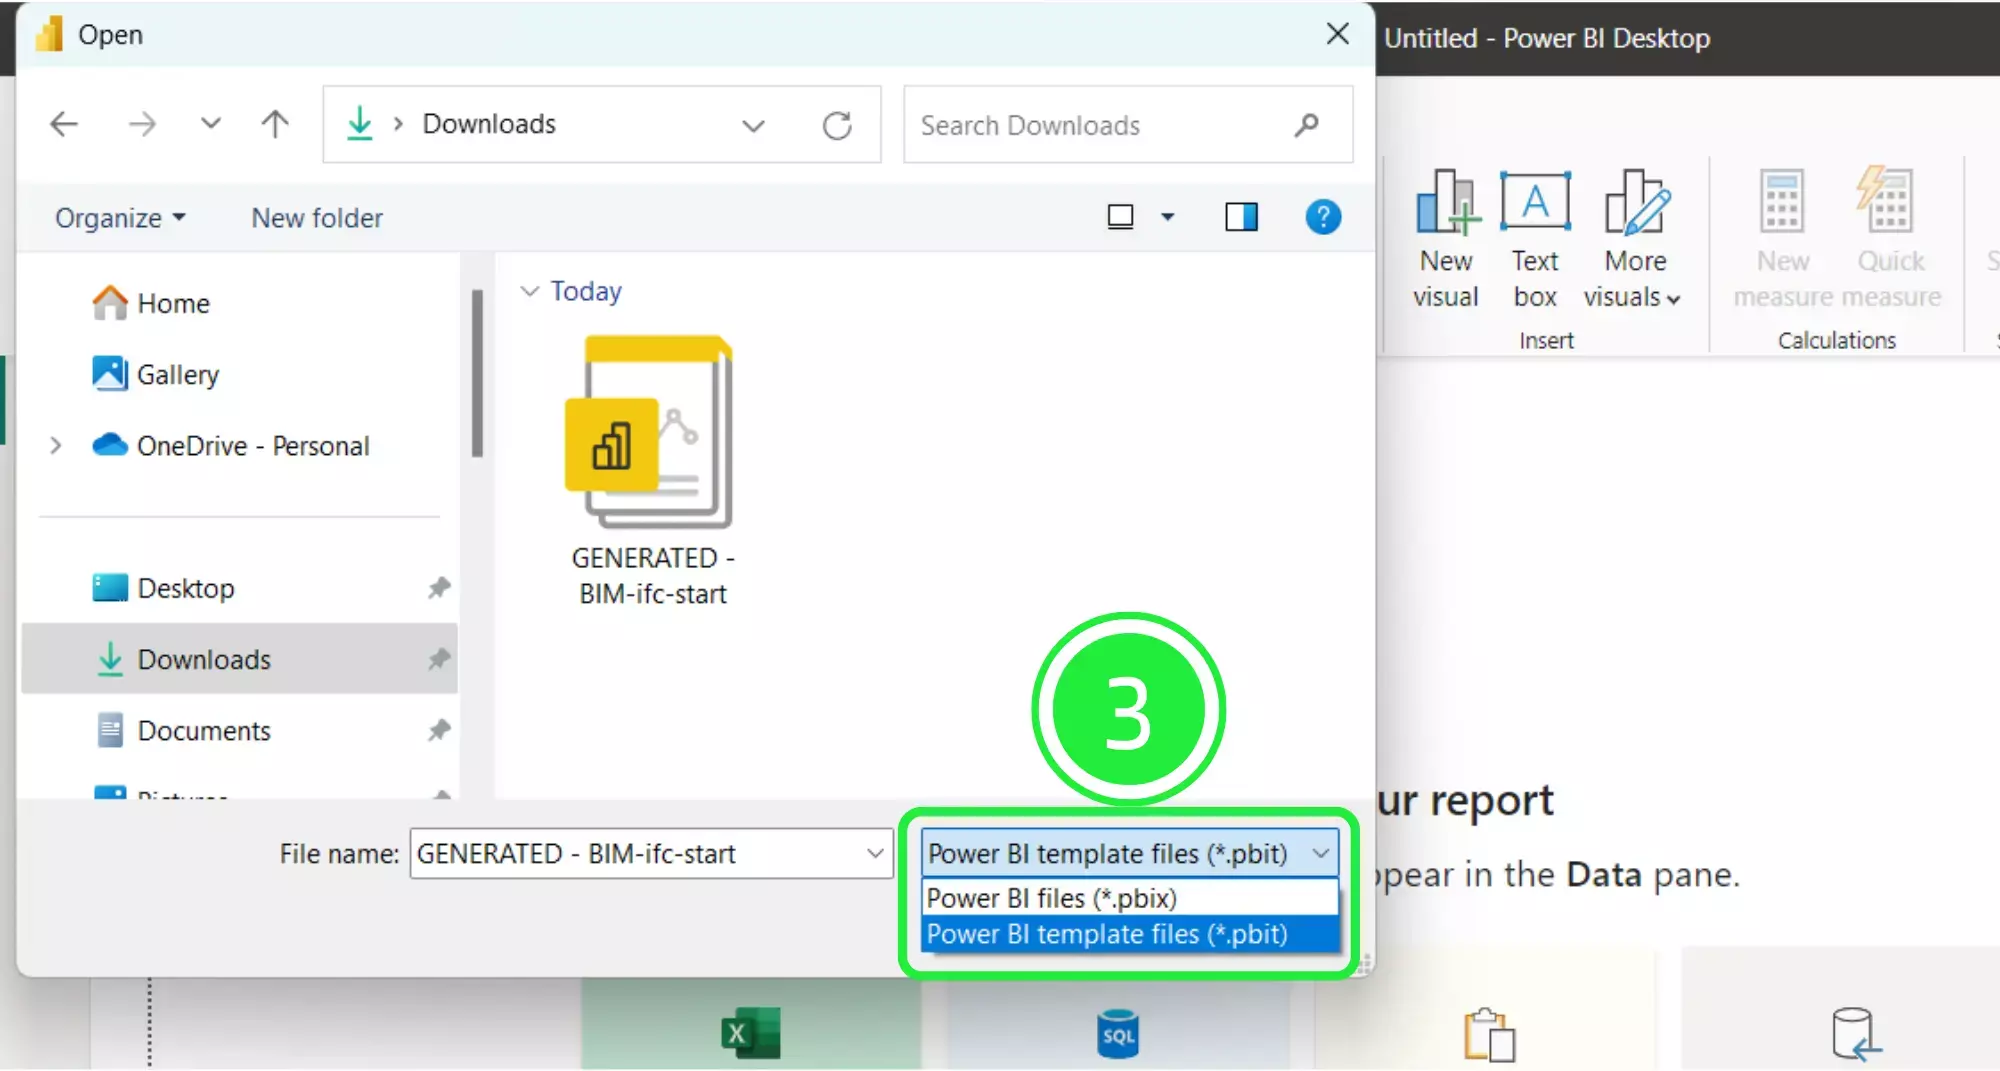
On the “Open” window, go to the bottom right and choose the correct file extension. Choose “Power BI Template Files (*pbit). Any files of this type will now show in the window.
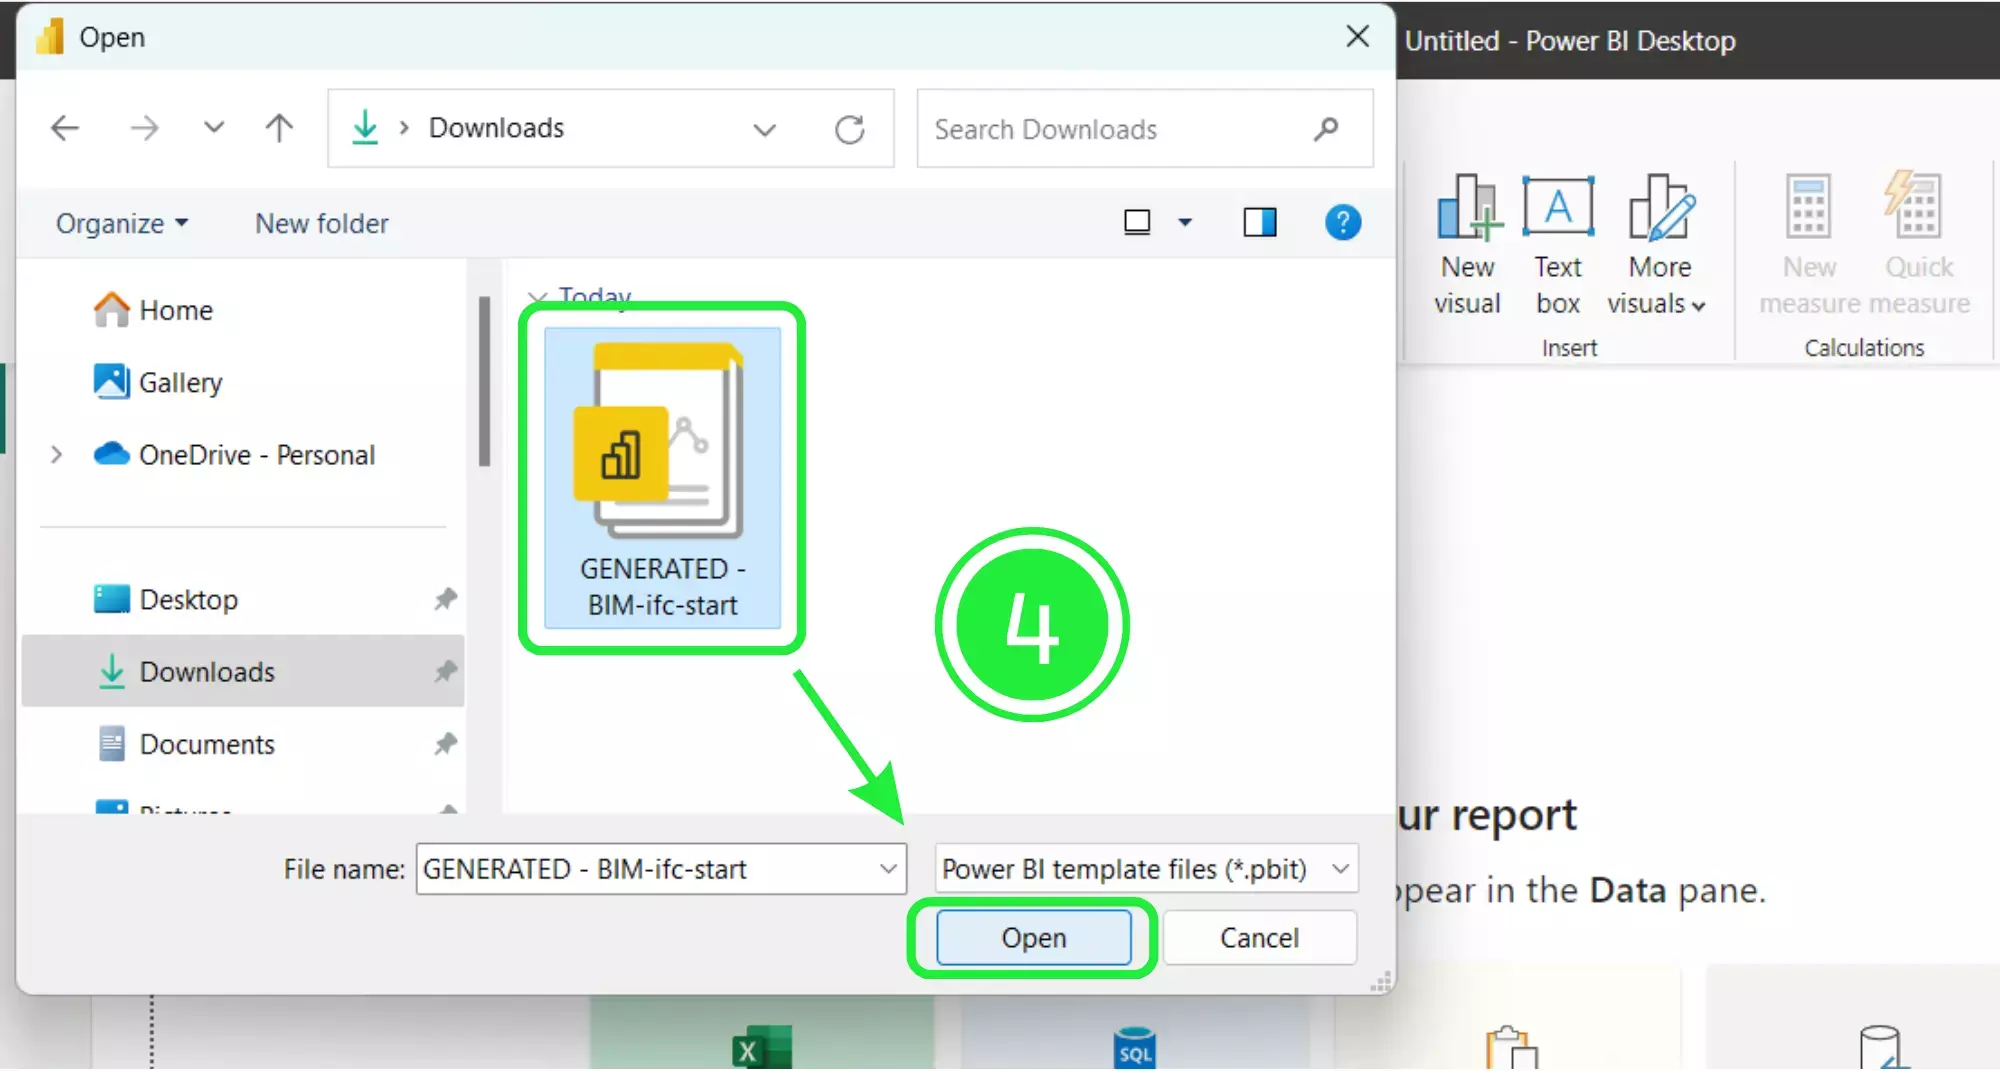
Select your newly downloaded template file and then click on “Open”.
A pop-up will appear showing the file details. Click on “Load” and your Dashboard Template file will start to load in Microsoft Power BI.
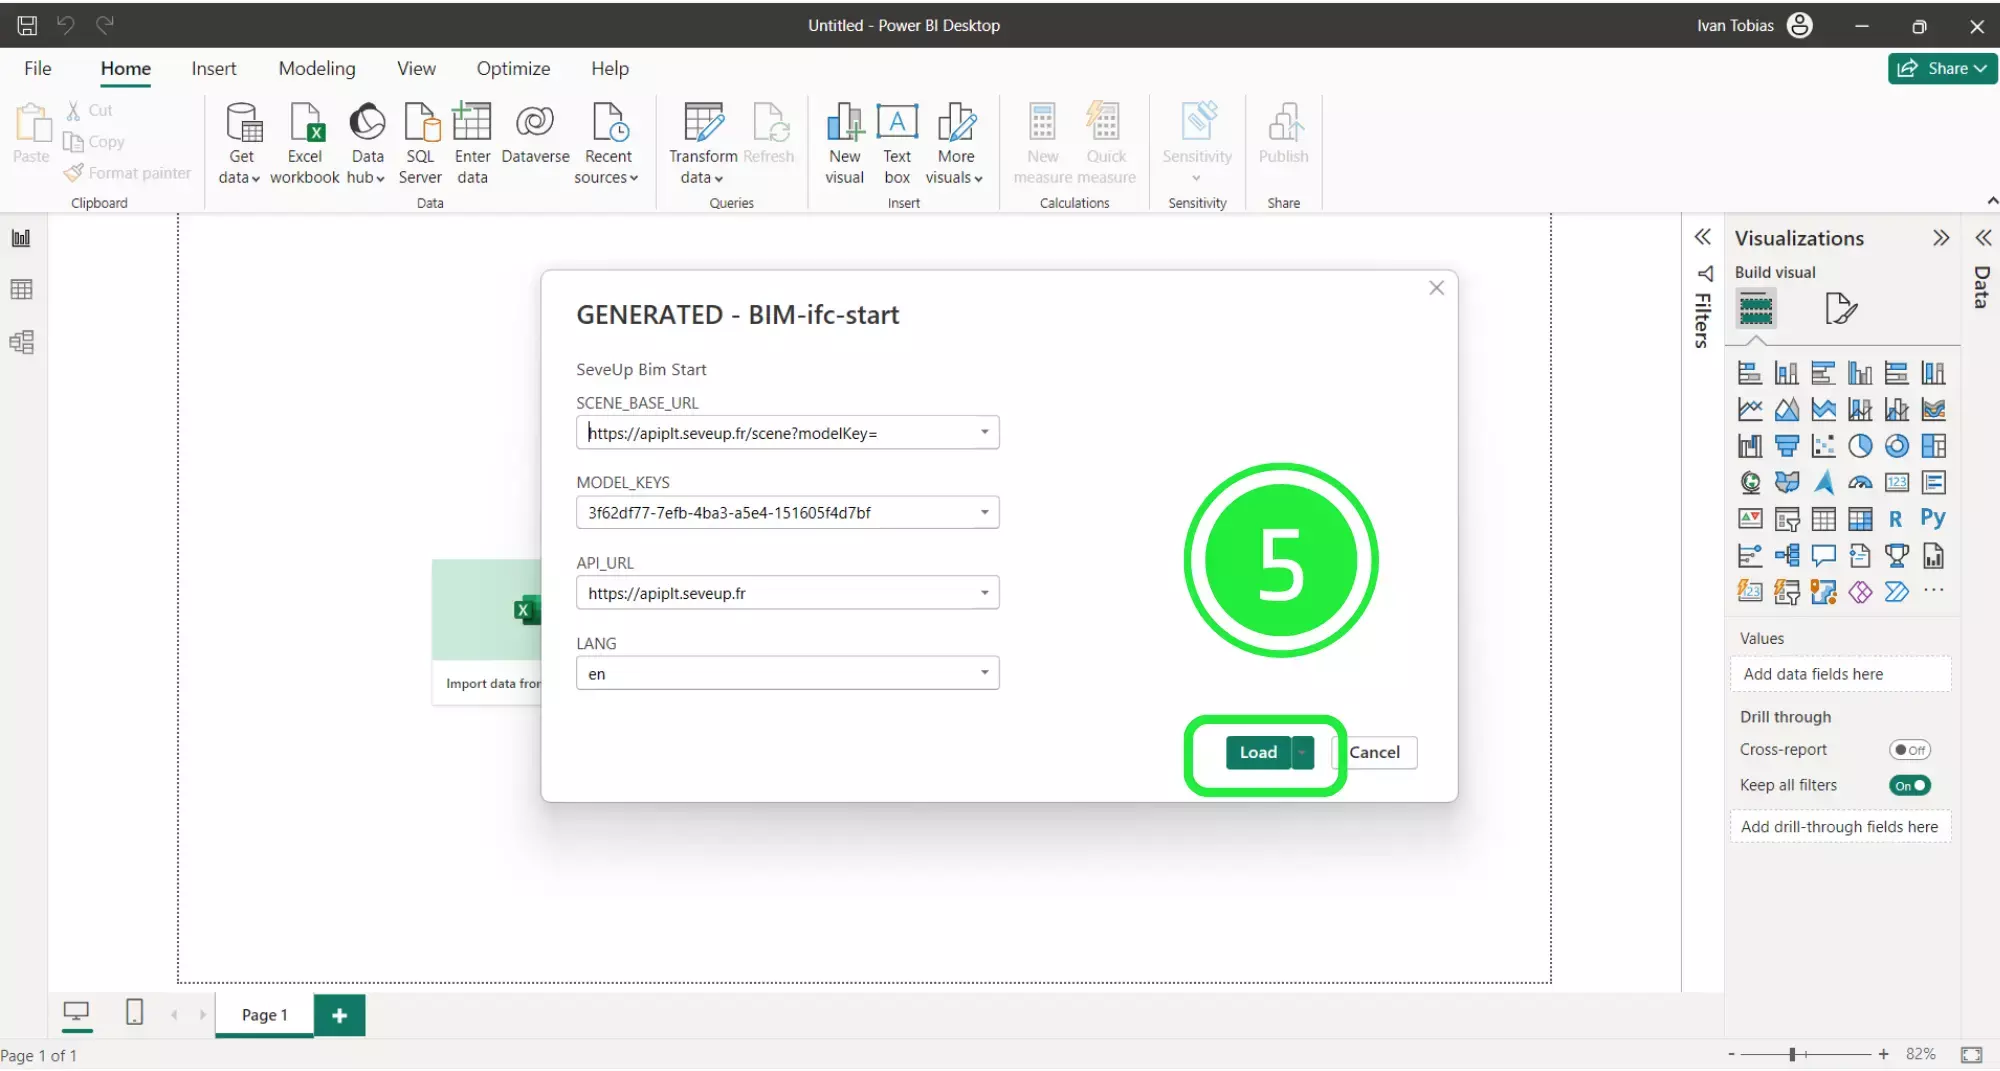
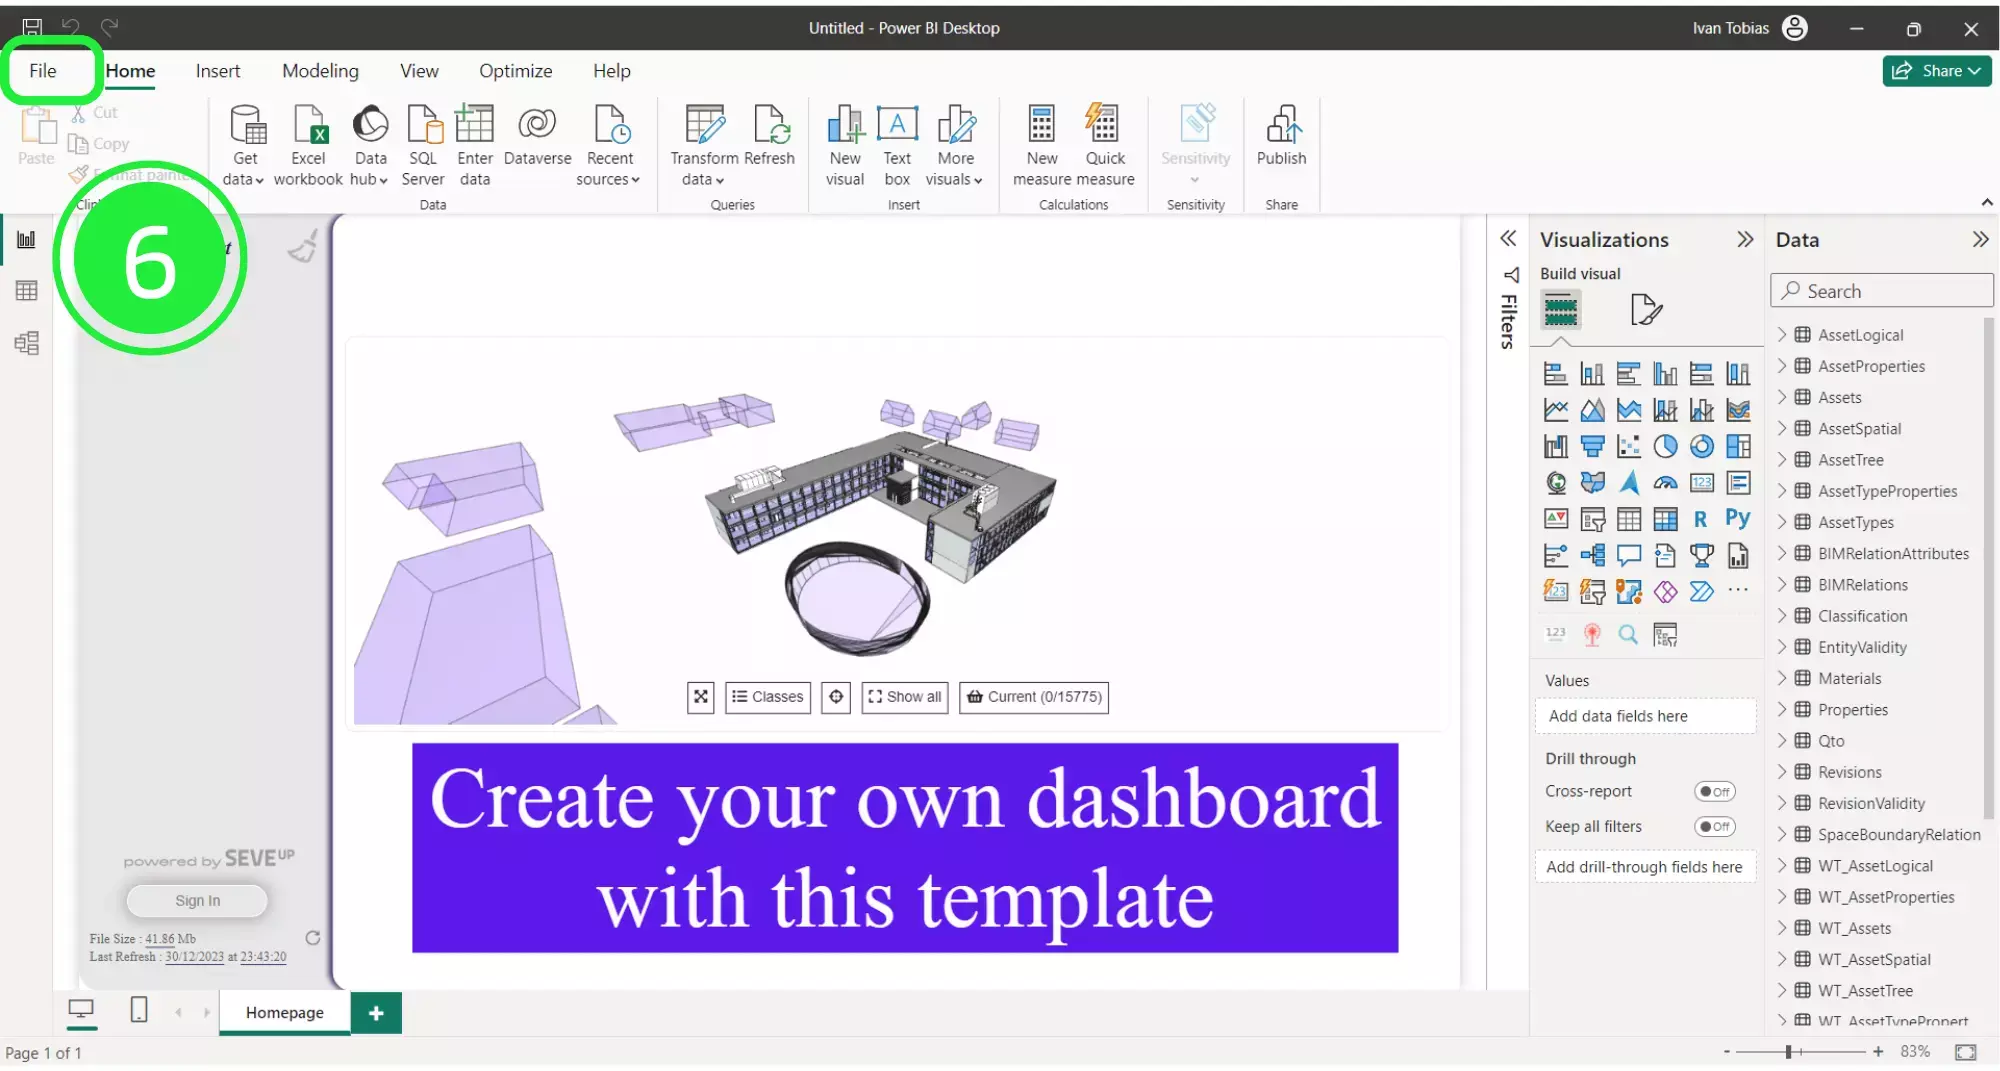
Once your new dashboard template has loaded, it will populate the Power BI interface with all of the BIM data from your dashboard.
In order to build the template in Power BI we first need to save it as a Power BI file (.pbix). To do this click on “File” in the top left corner of the page.
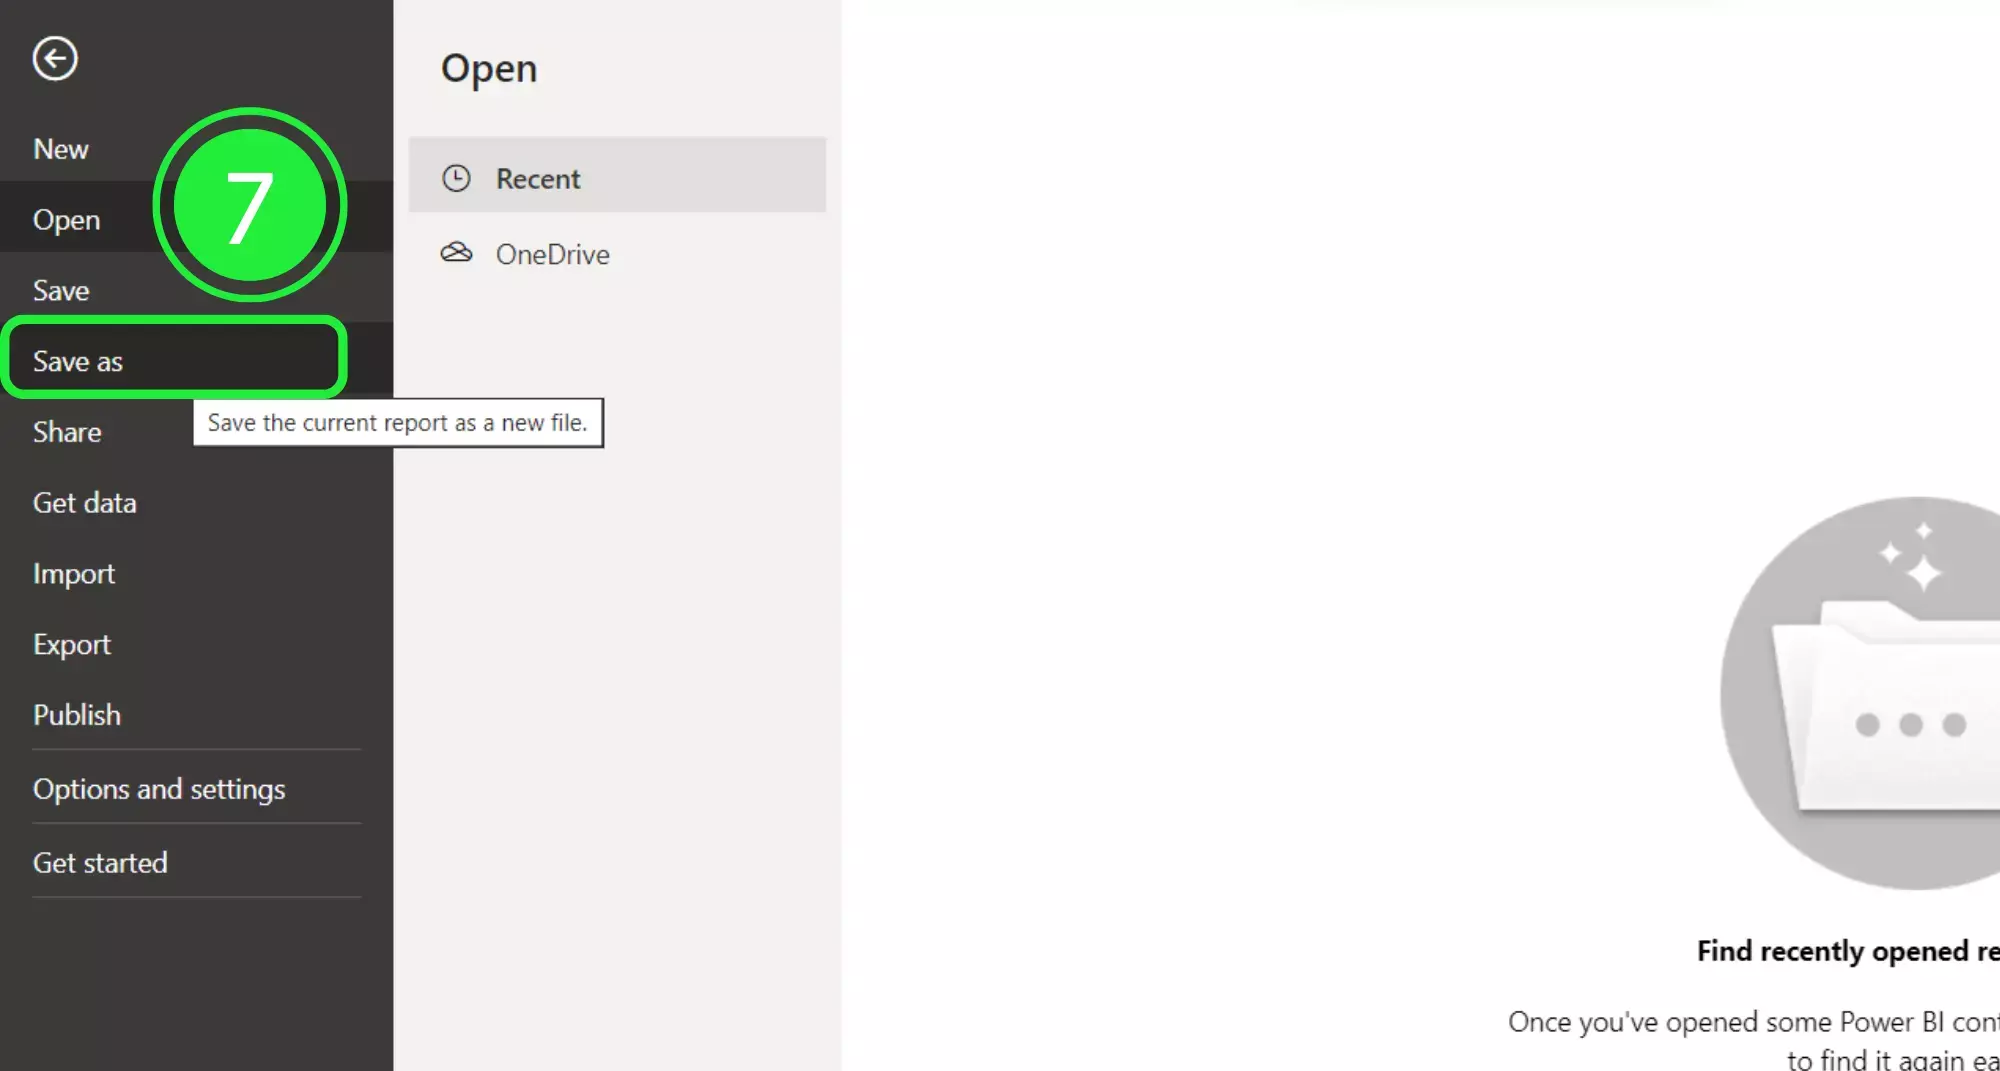
Select “Save As” in order to save your file.
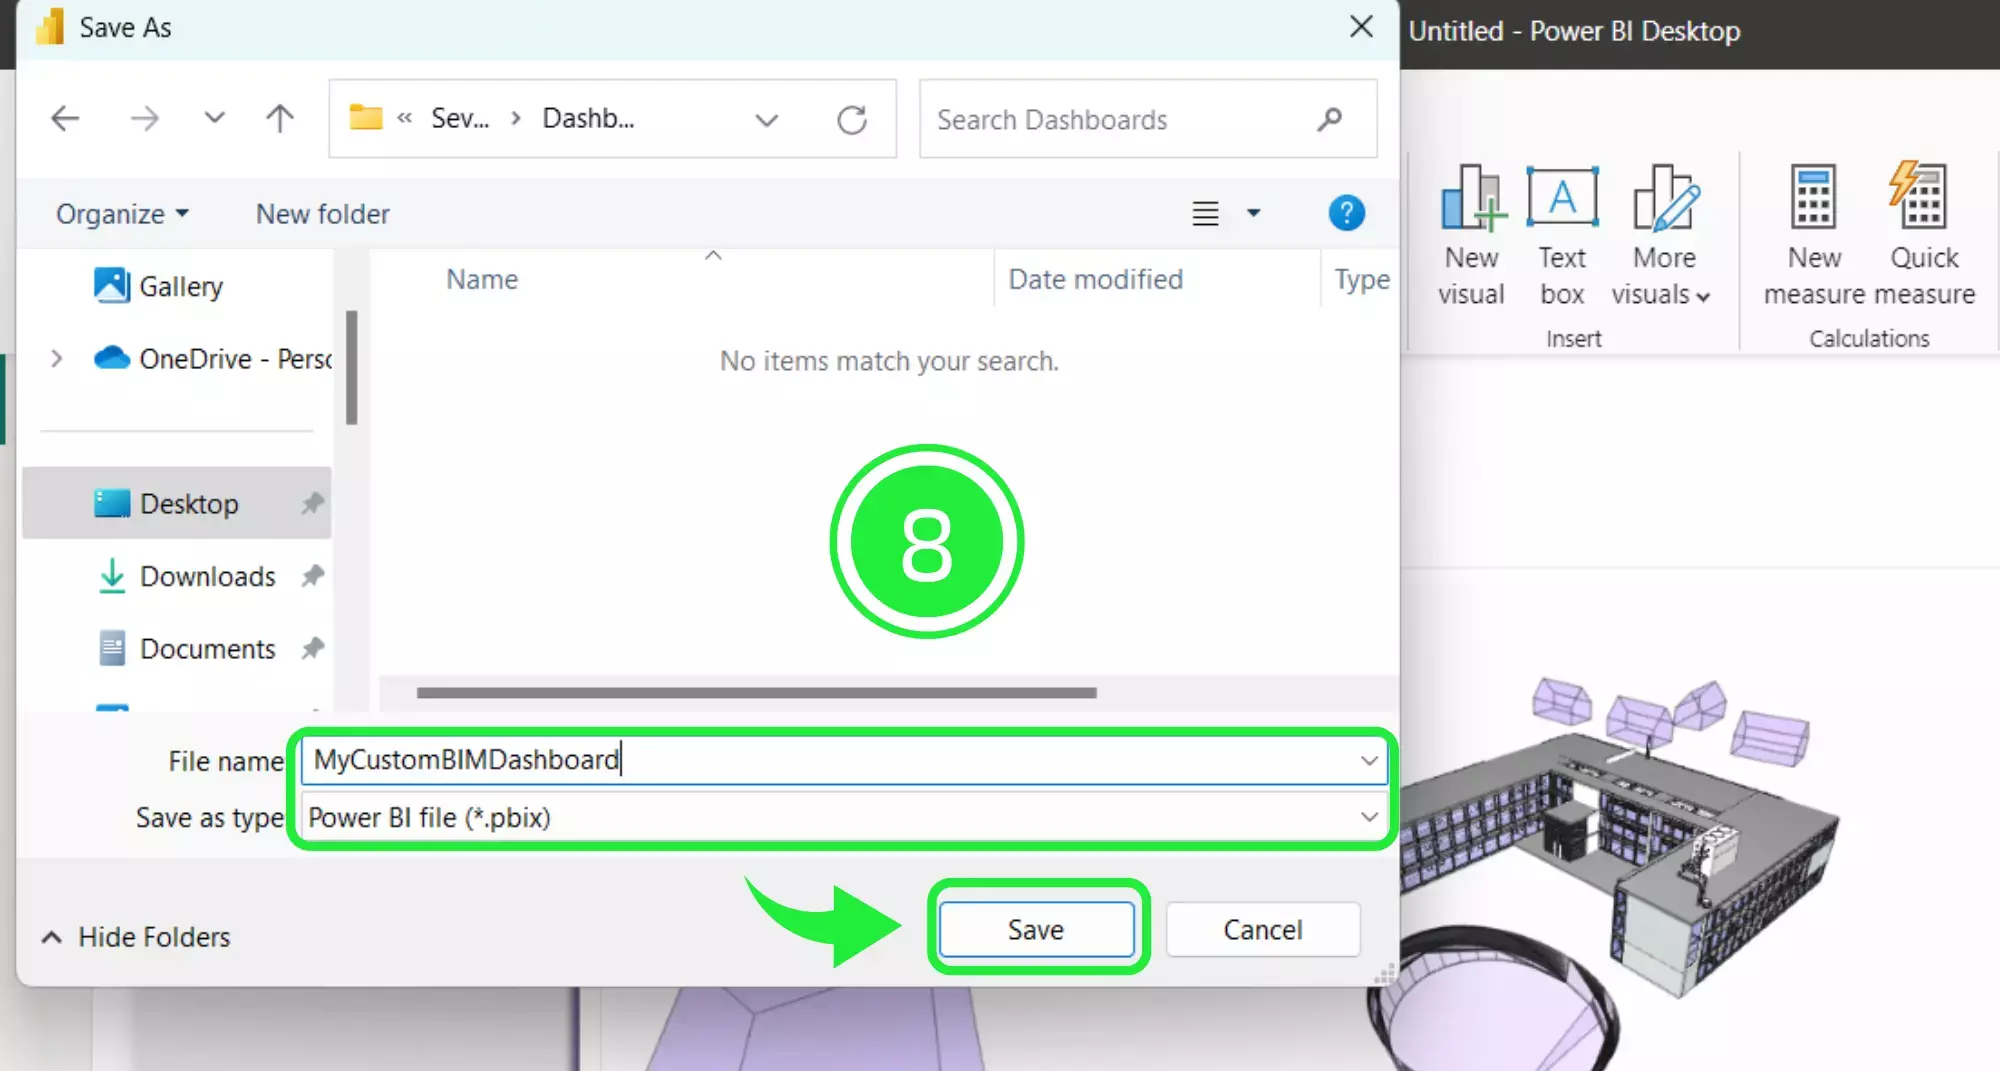
Choose an appropriate name for your file and then click on the “Save” button.
On the right-hand side of the report there are several panes – Filters, Visualizations and Data. The “Visualizations” pane helps to turn complex construction details and architectural designs into easy-to-understand charts and graphs by using the different types of visuals.
It takes all those measurements, materials, and stages of your building project and shows them in a way that everyone on your team can grasp quickly. This pane lets you play around with your data, find what matters most, and share it in a clear, visual way that makes sense to both builders and non-builders alike.
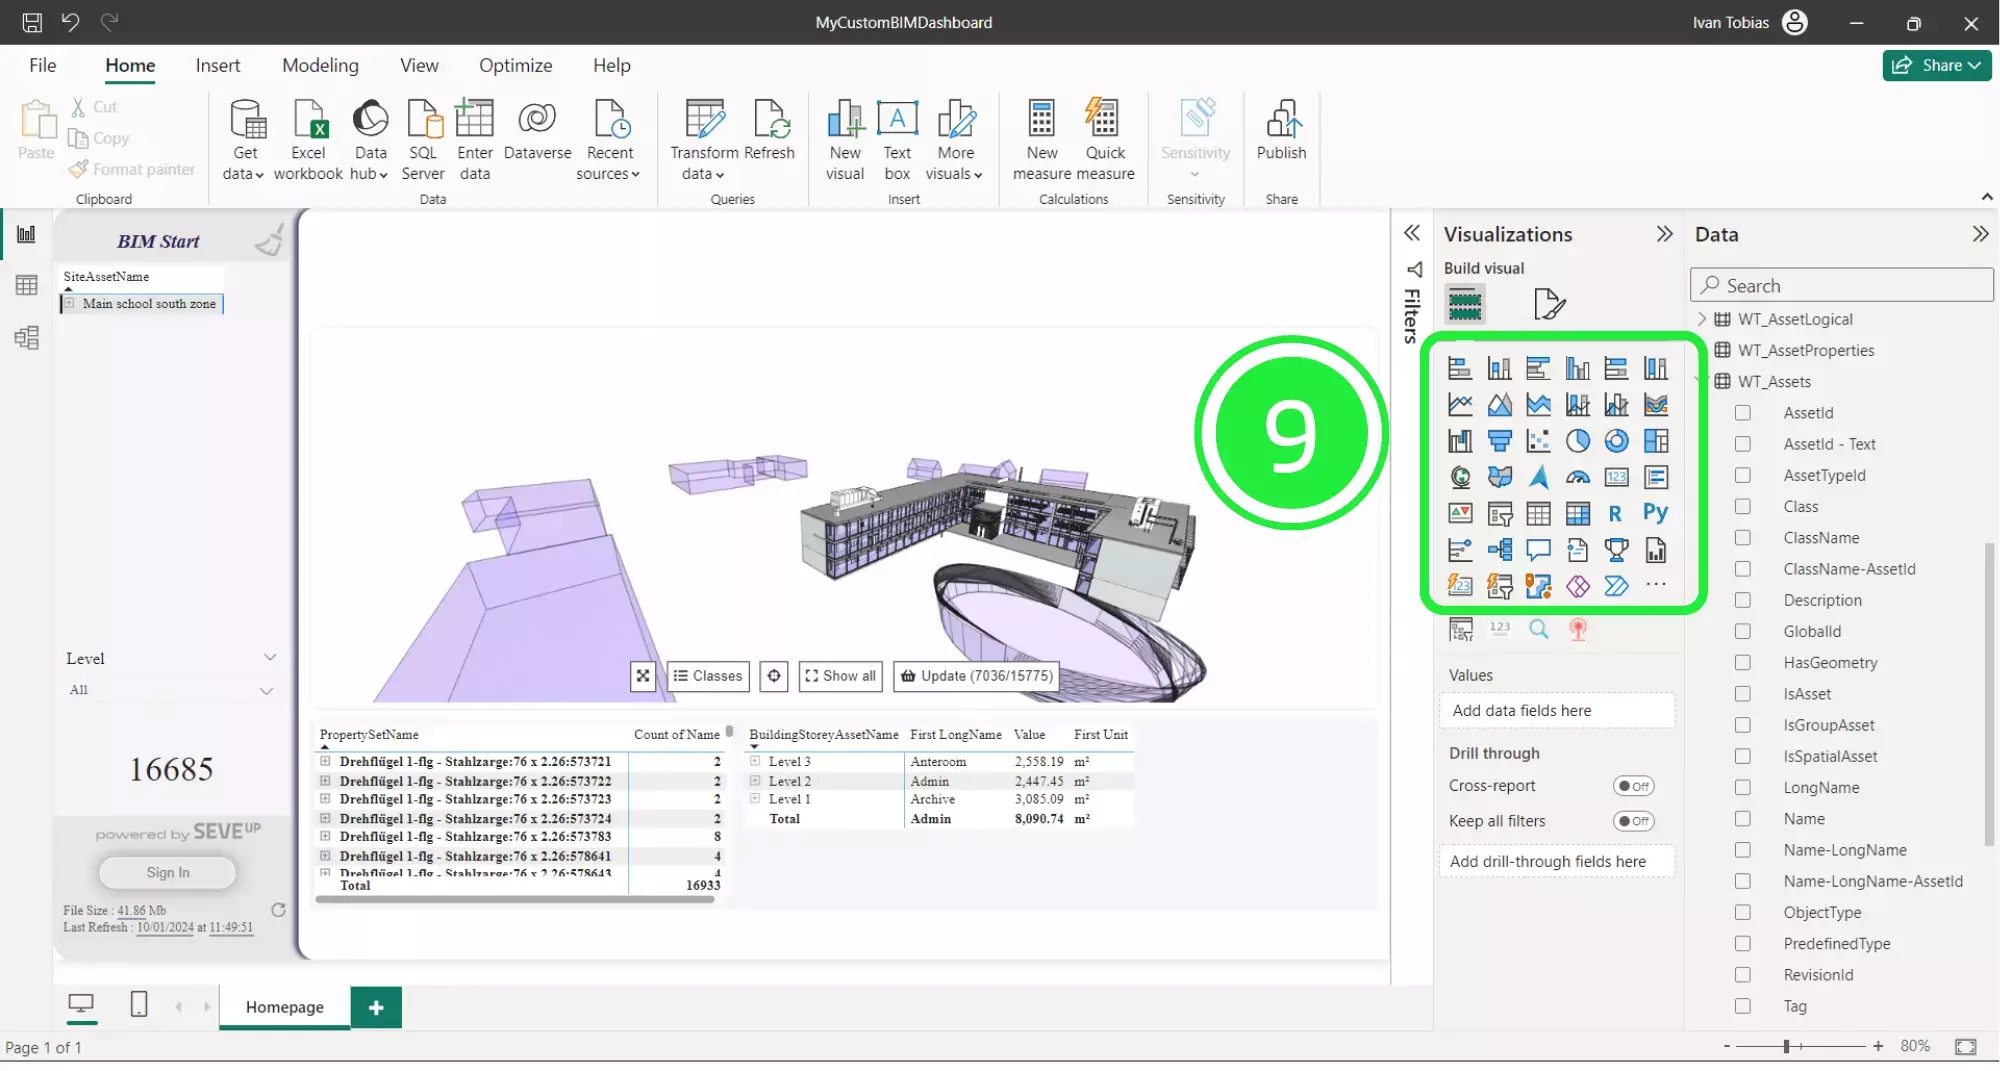
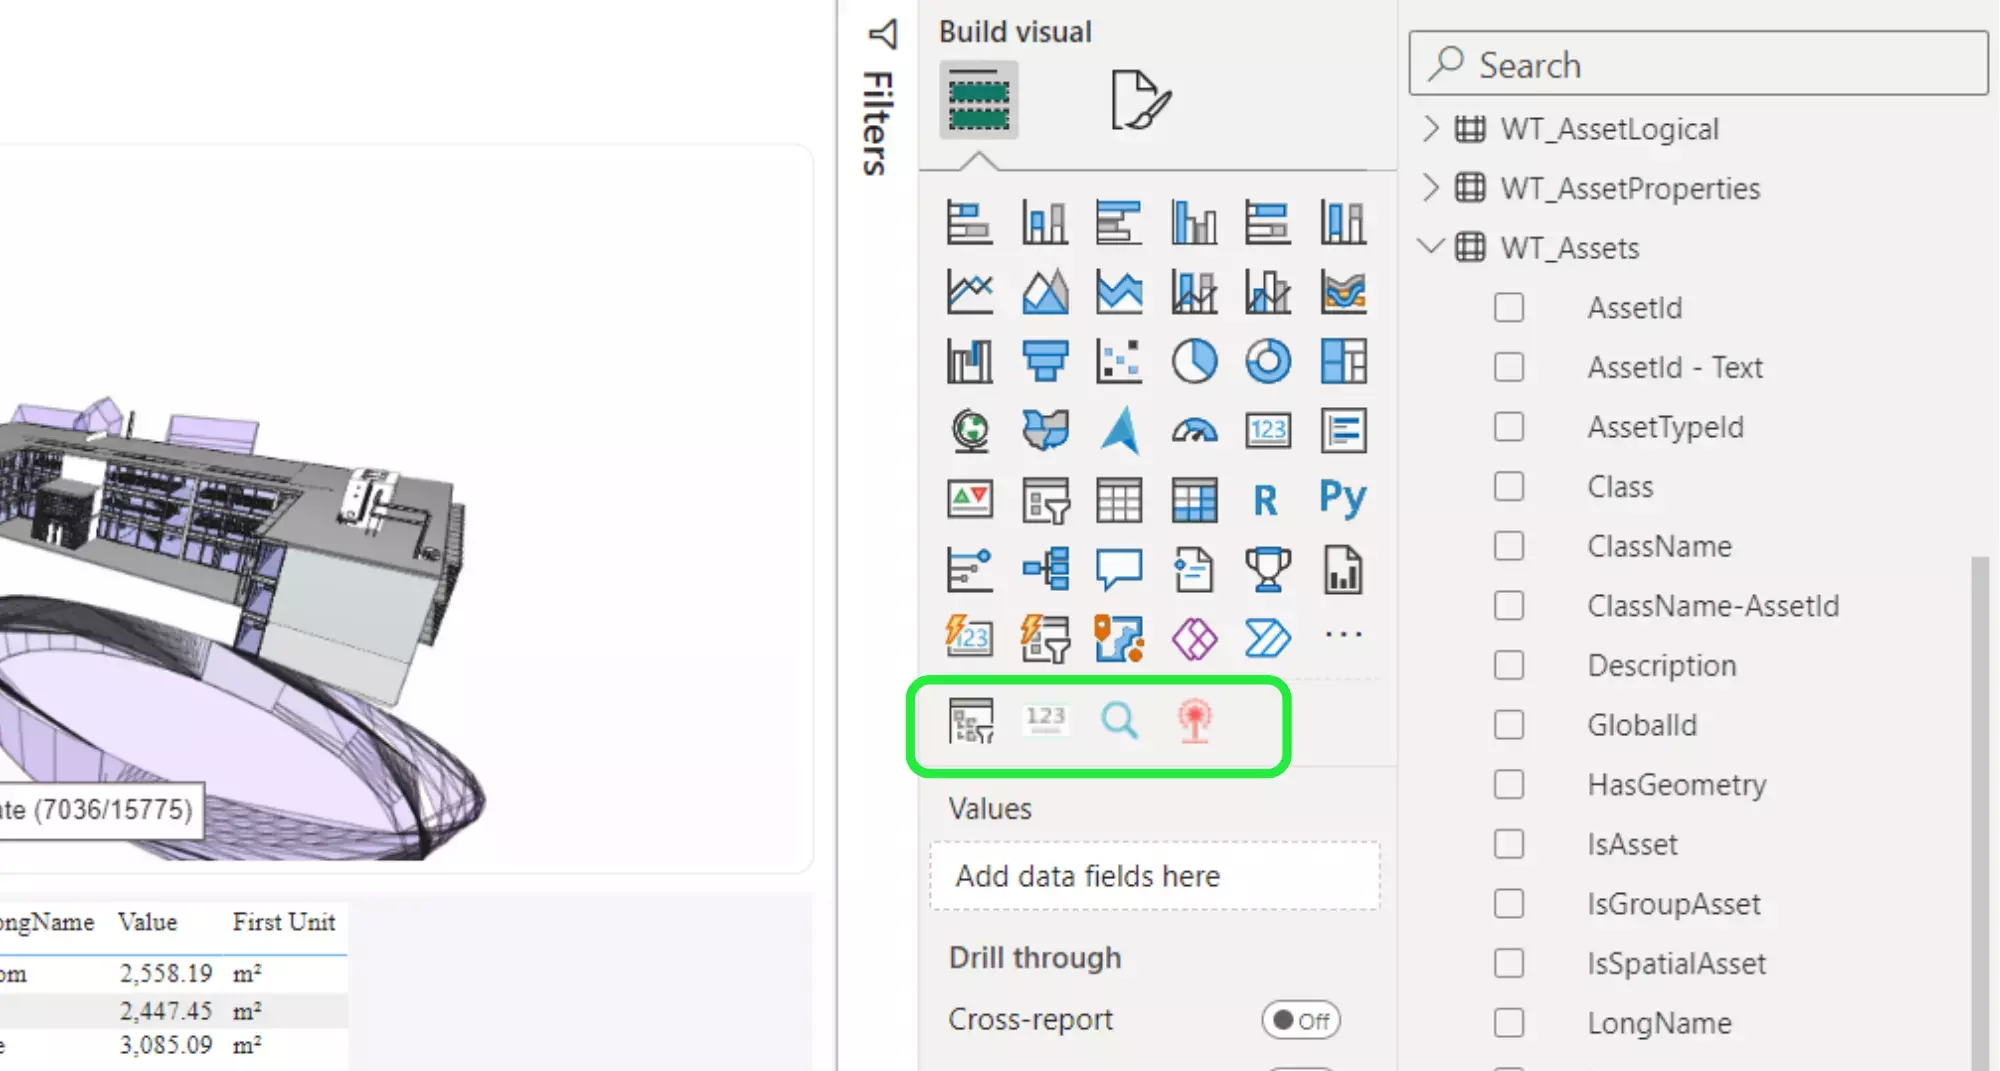
SeveUp has designed several custom visuals for use in the dashboards. These have already been inserted and pre-configured as standard for all of our dashboards. You can browse the other articles on the blog here
Before changing or adding data to a visual, you must make sure that it is selected by clicking on it. You can tell when a visual is selected because it will have a resizing border around it.
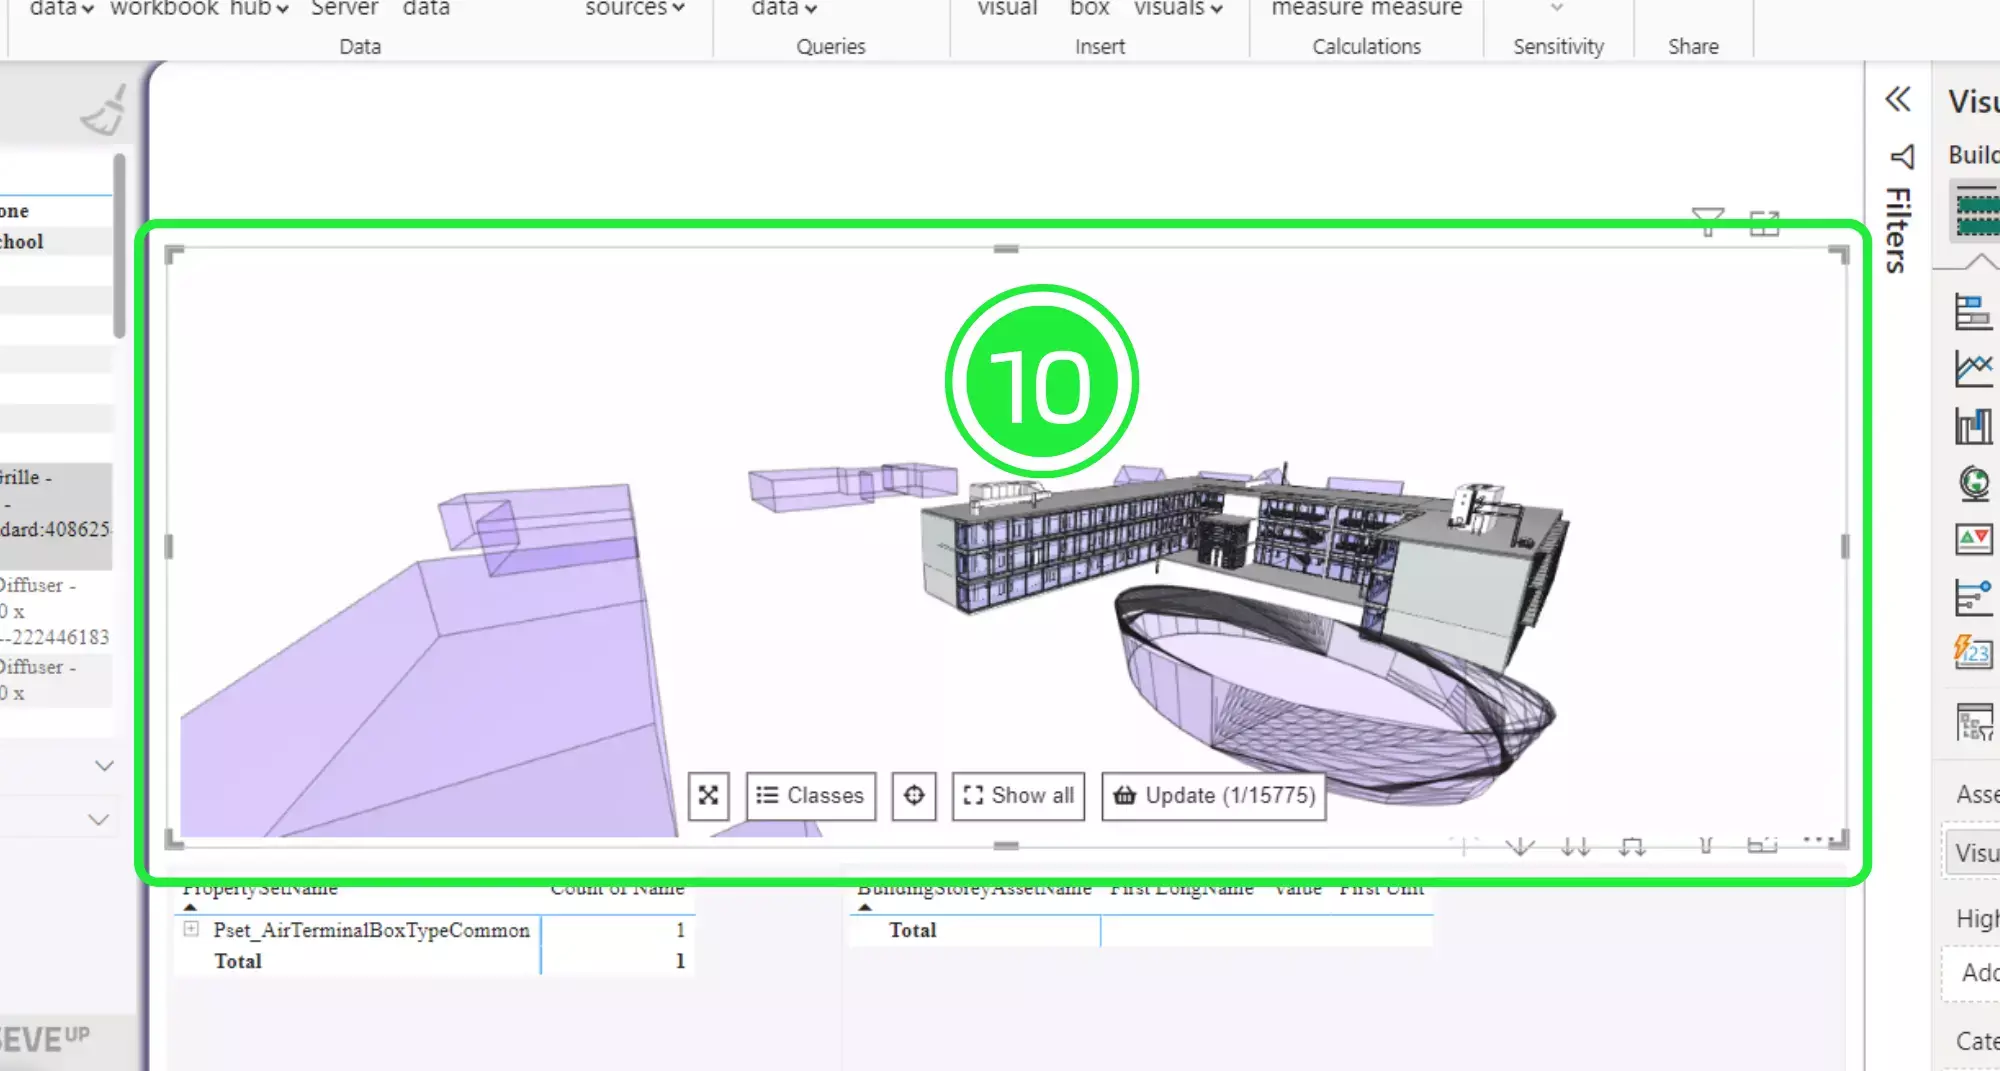
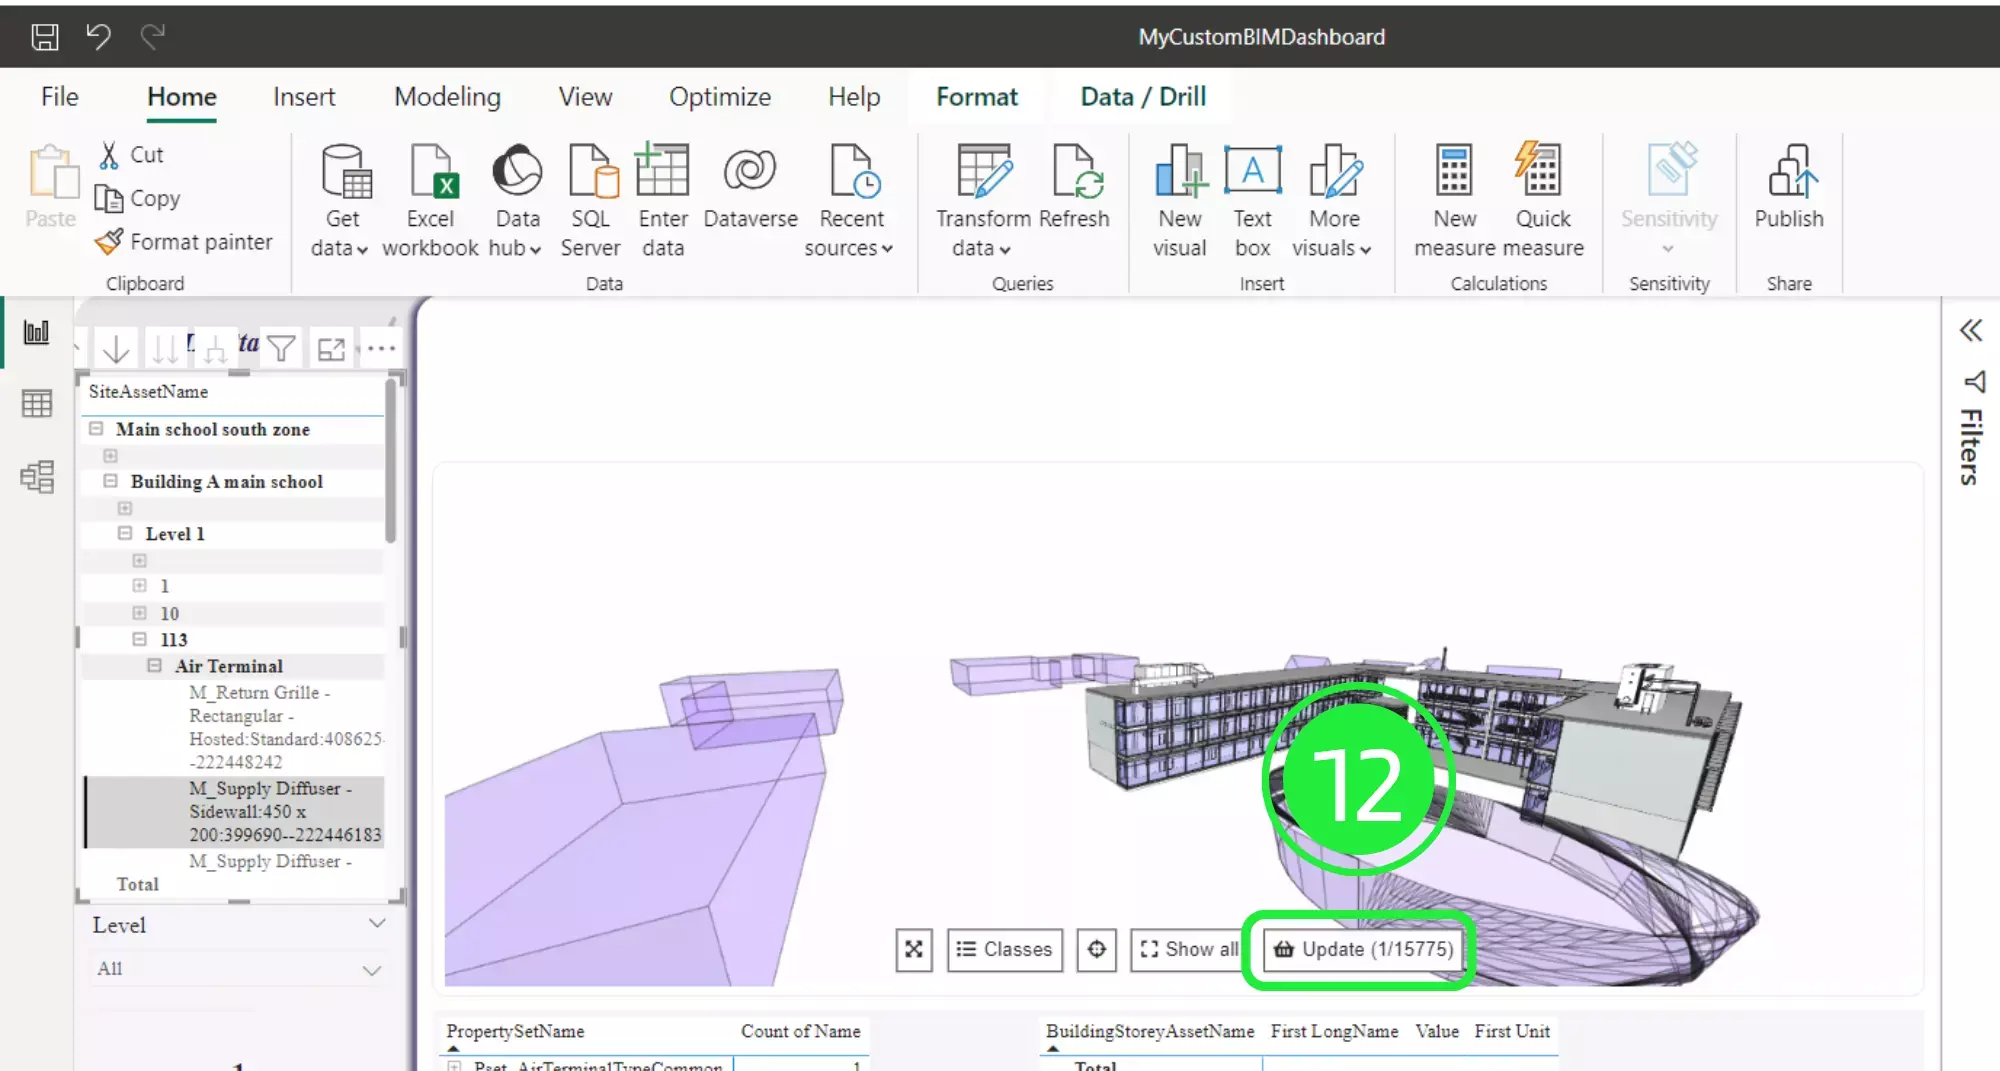
The SeveUp 3D BIM Viewer is created to work in two ways. The first way allows you to select data across other Power BI visuals and then it automatically displays the data within the 3D BIM viewer. Select an asset from another visual by clicking on it.
Now click on the “Update” button within the BIM Viewer. You’ll notice that it displays the amount of chosen assets on the button.
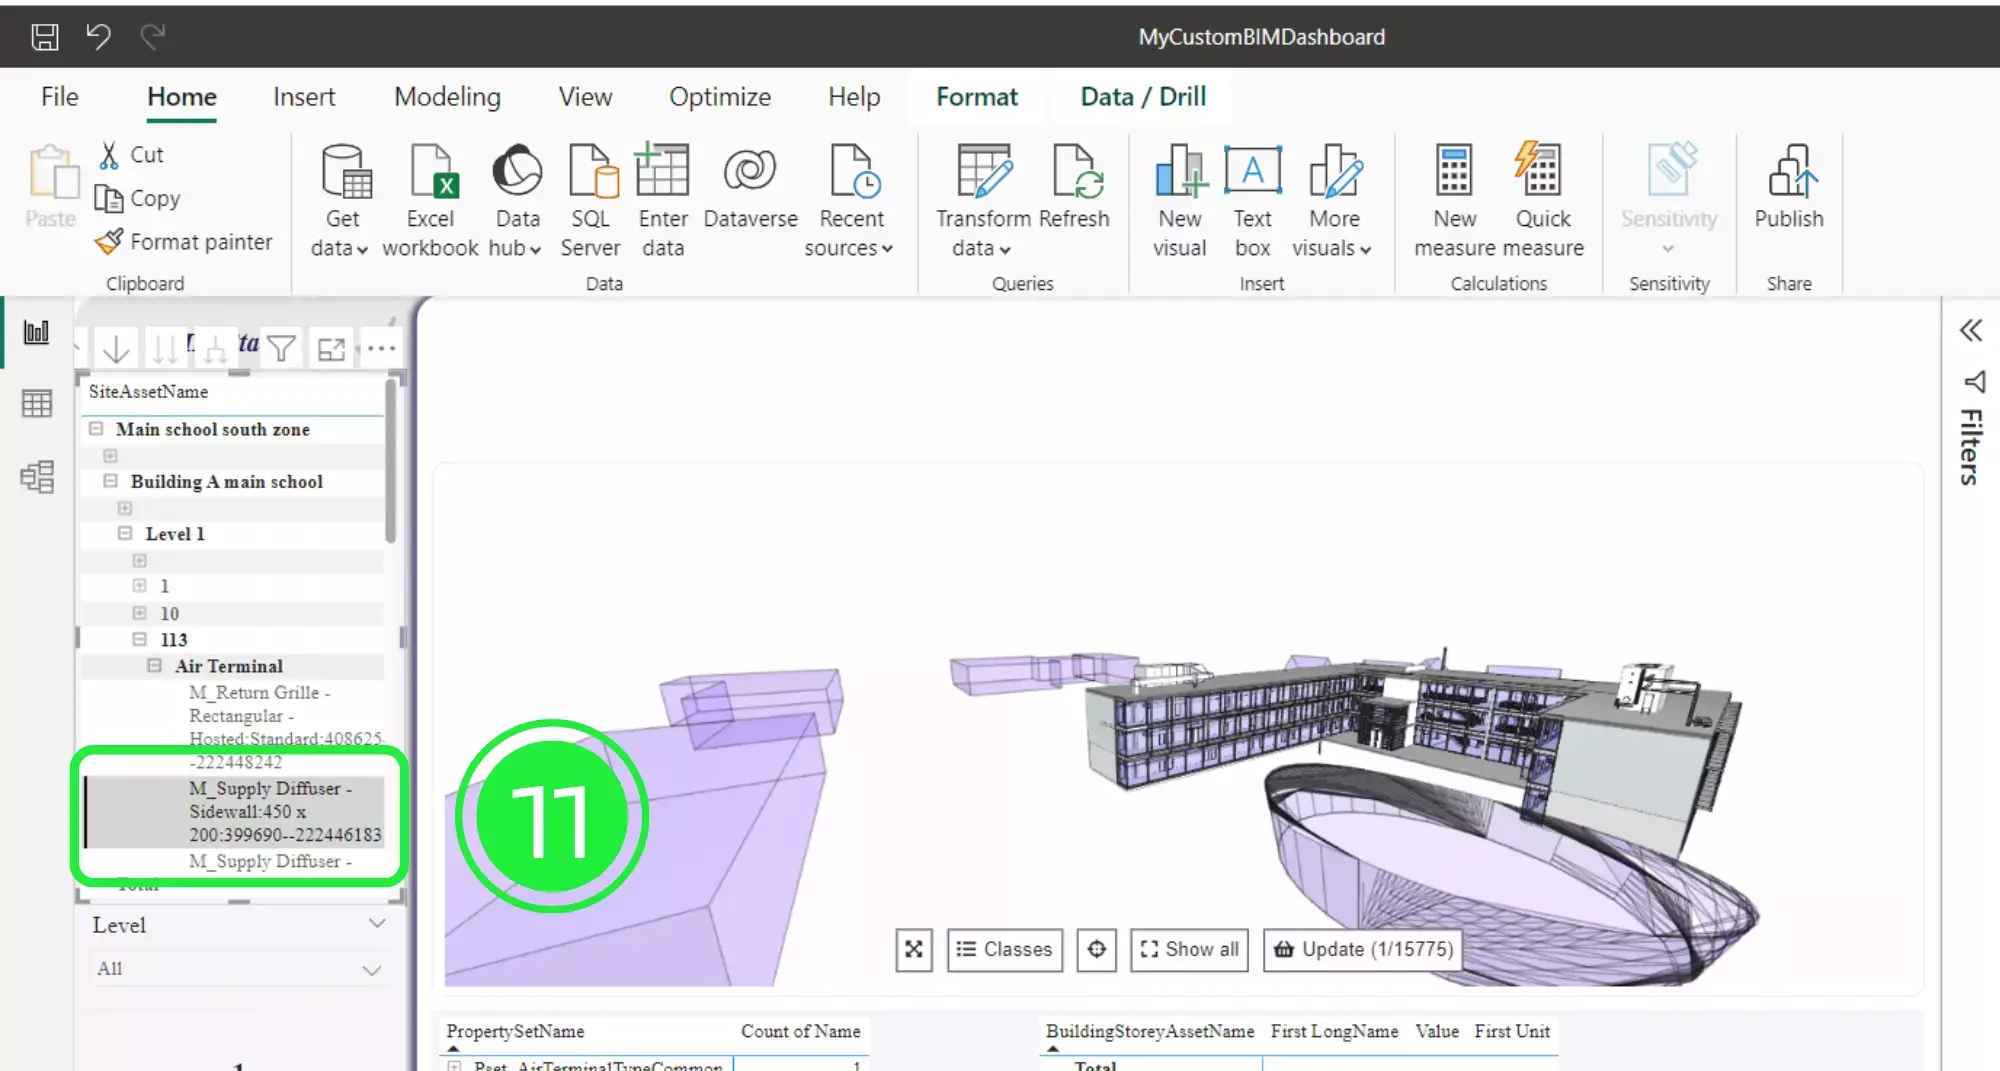
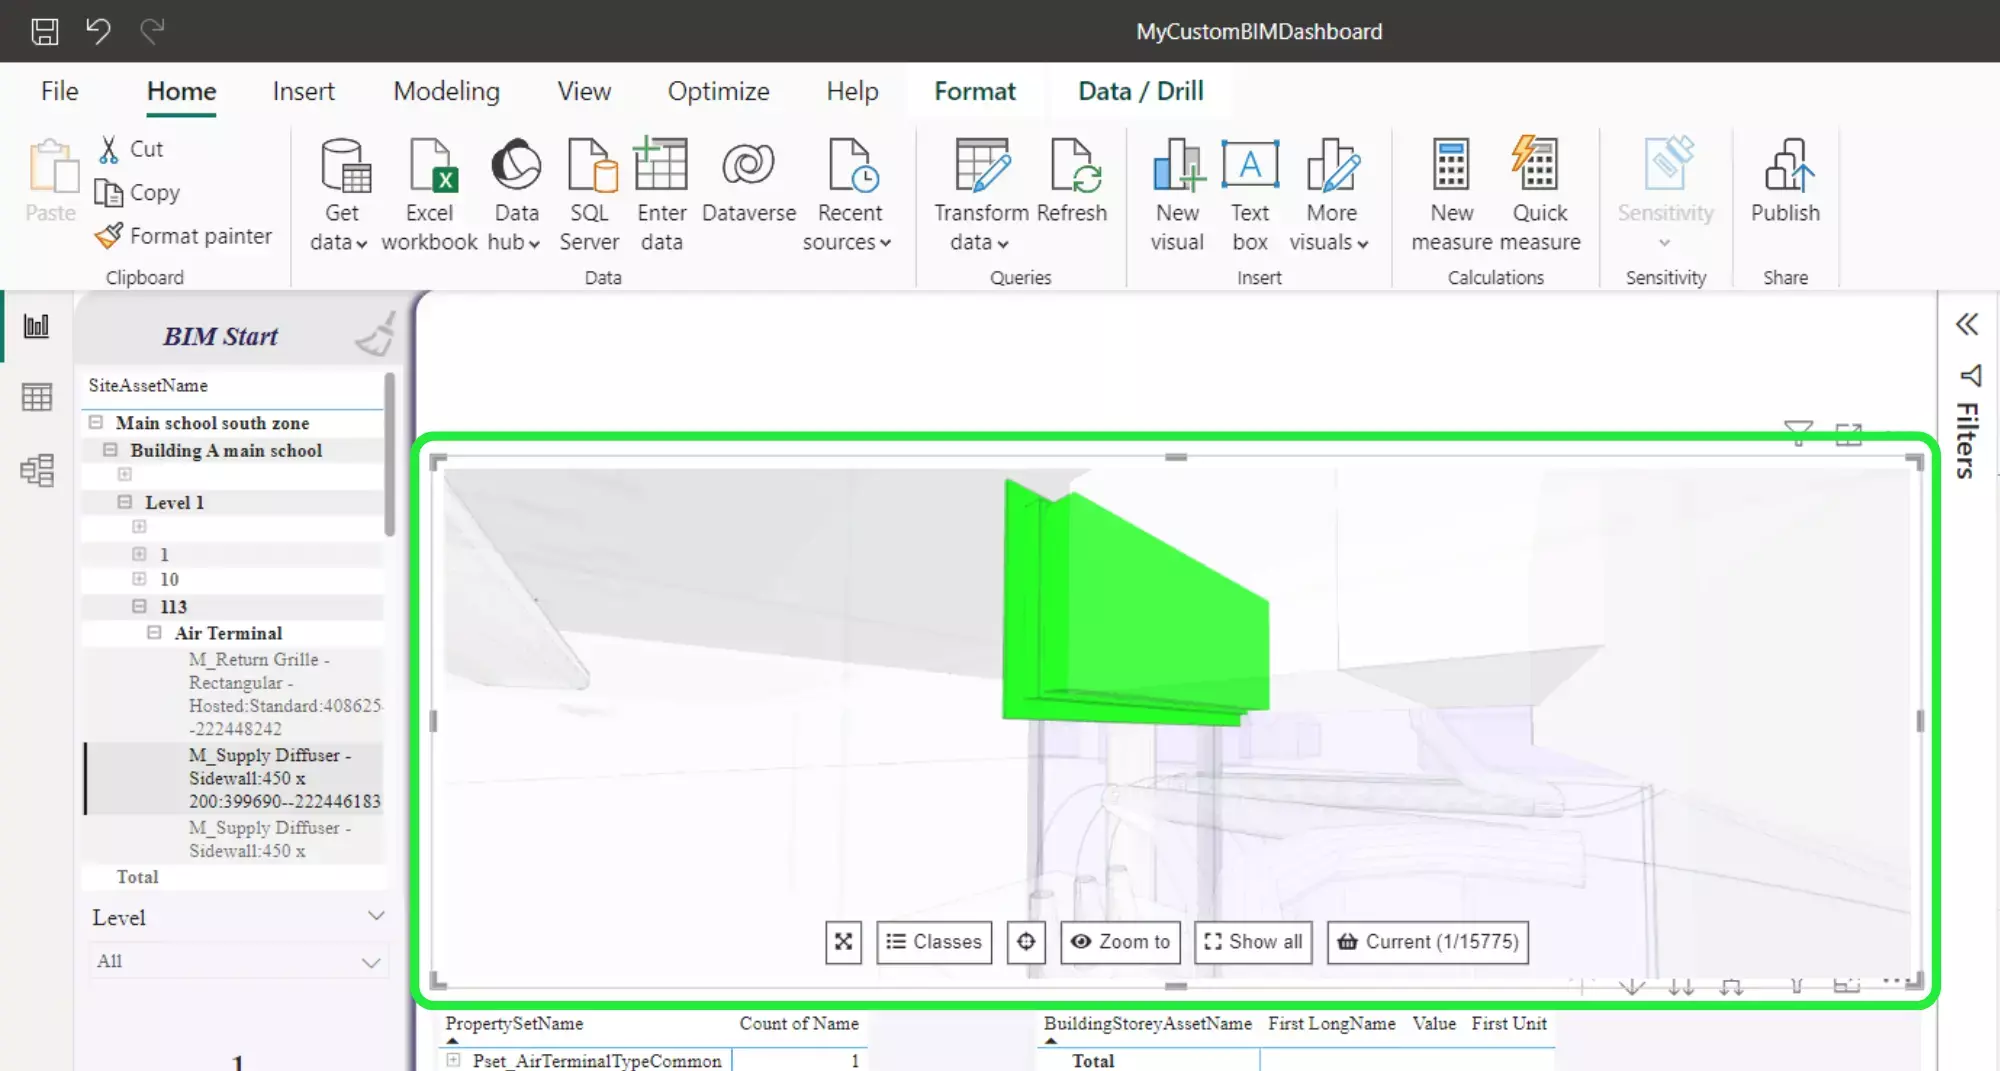
The 3D BIM Viewer will now display and auto focus on the selection.
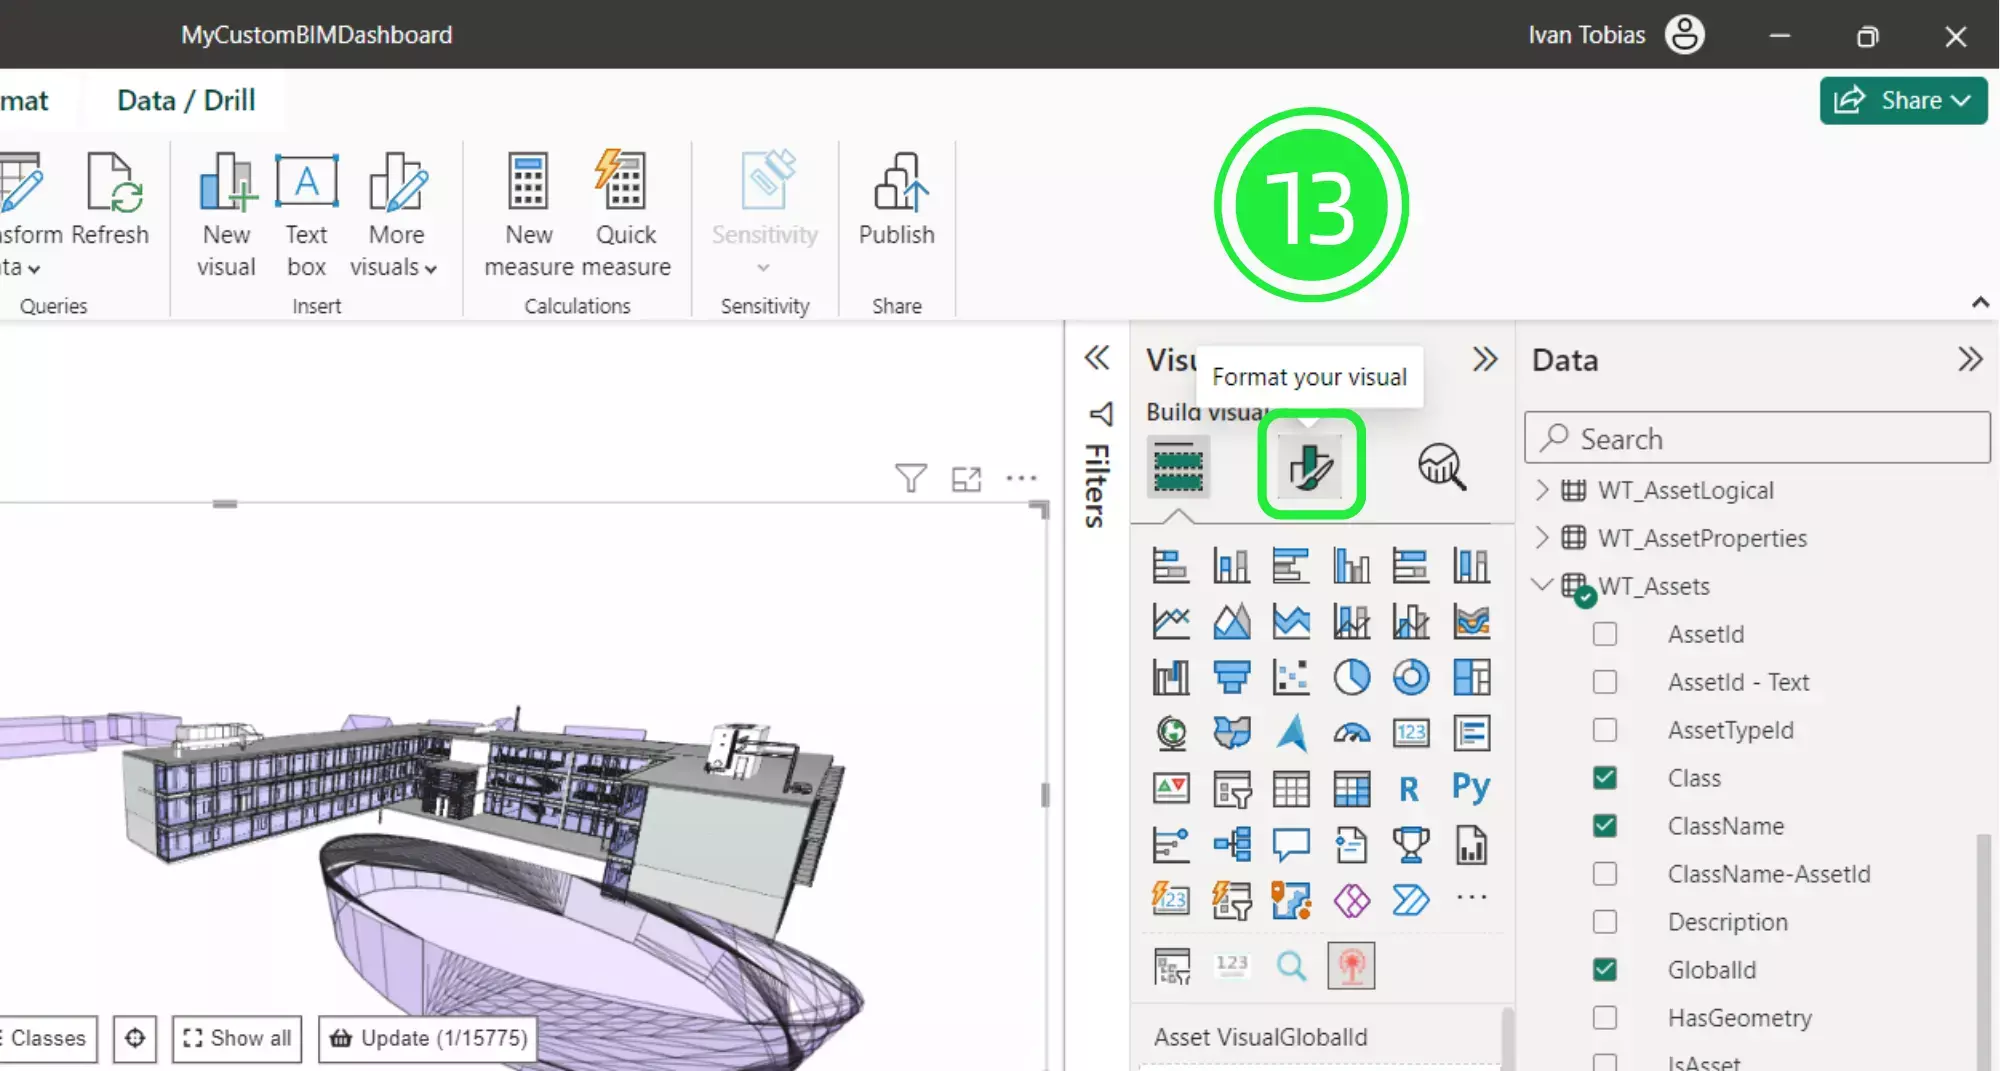
The second way the SeveUp Bim viewer works is an inversion of the first way. When you select an asset within the BIM viewer then all the other visuals within the dashboard will update to reflect the selection.
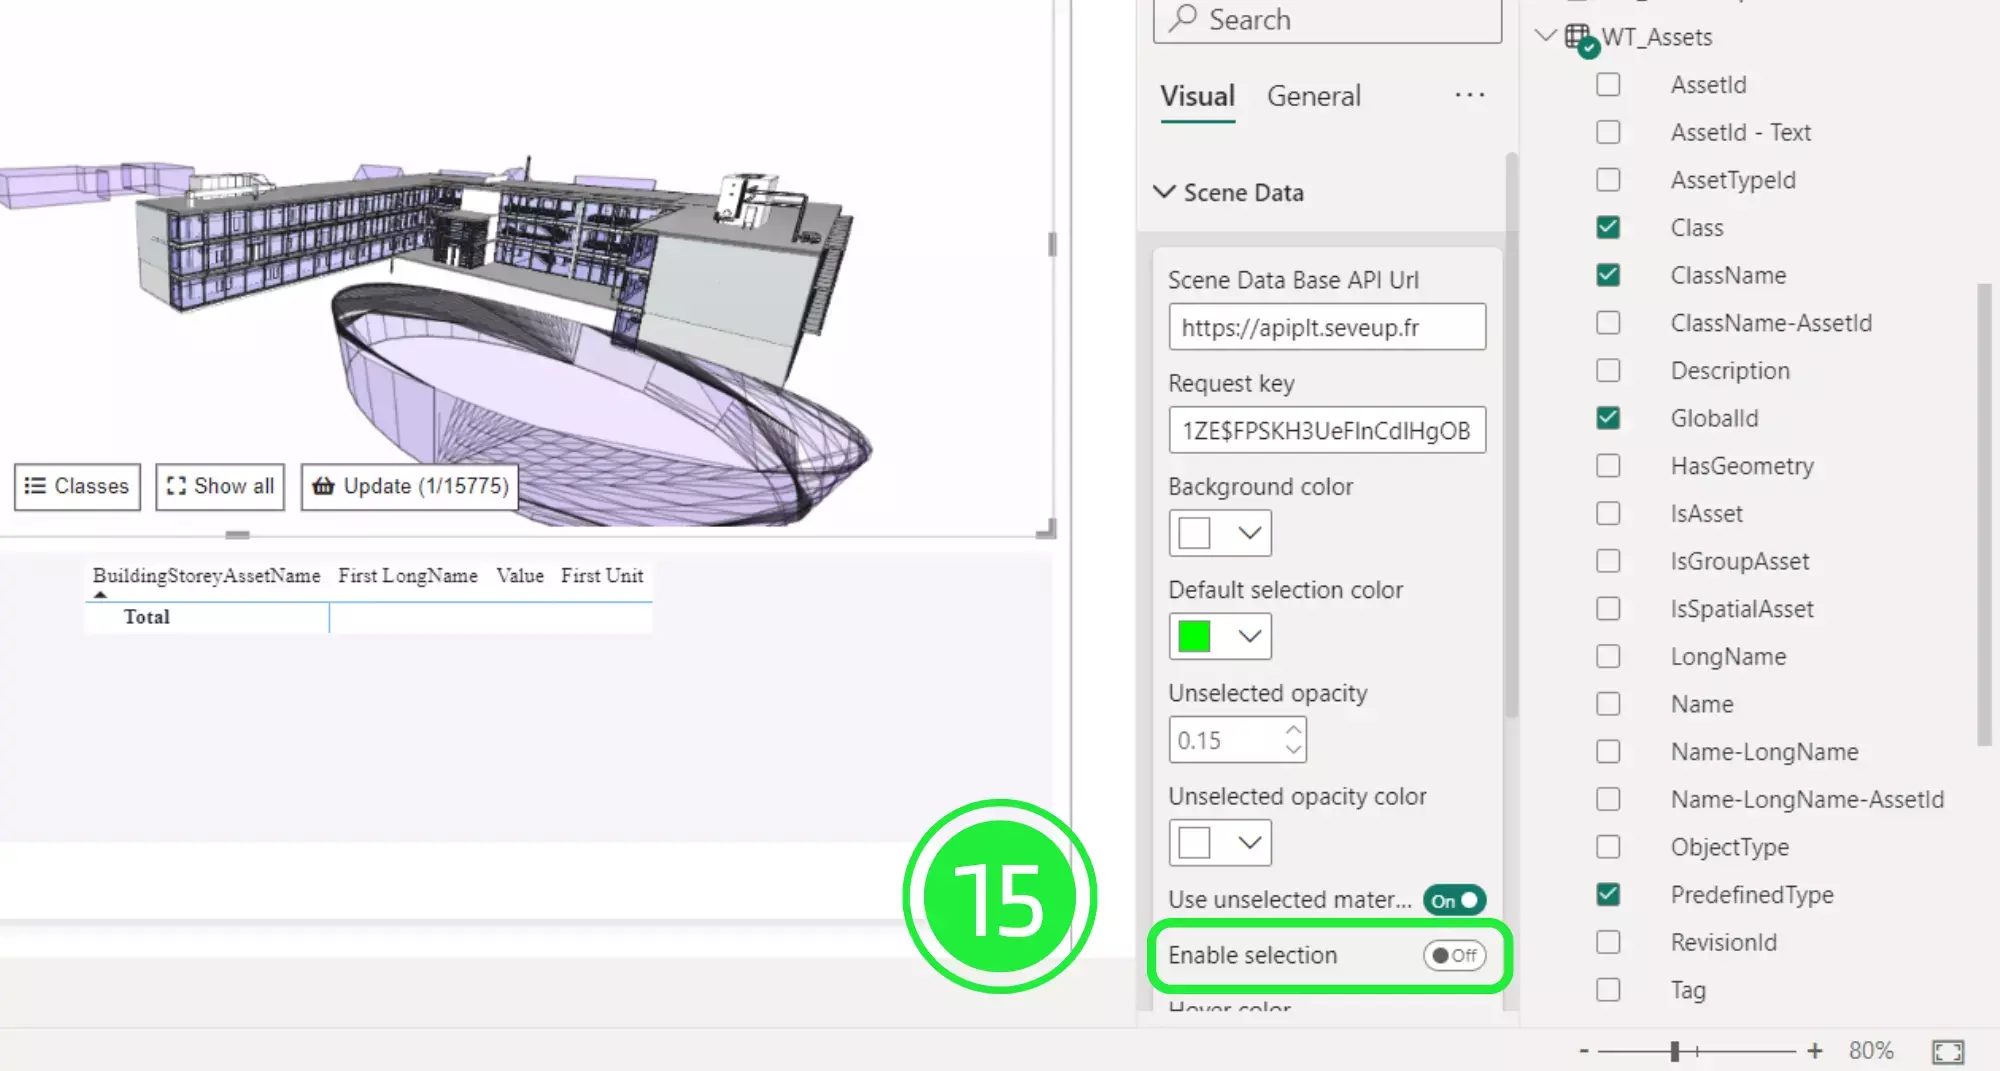
Make sure that the visual is set to enable this feature by going to the “Visualization” pane and choosing “Format Your Visual”.
Click on “Scene Data” to drop down the menu.
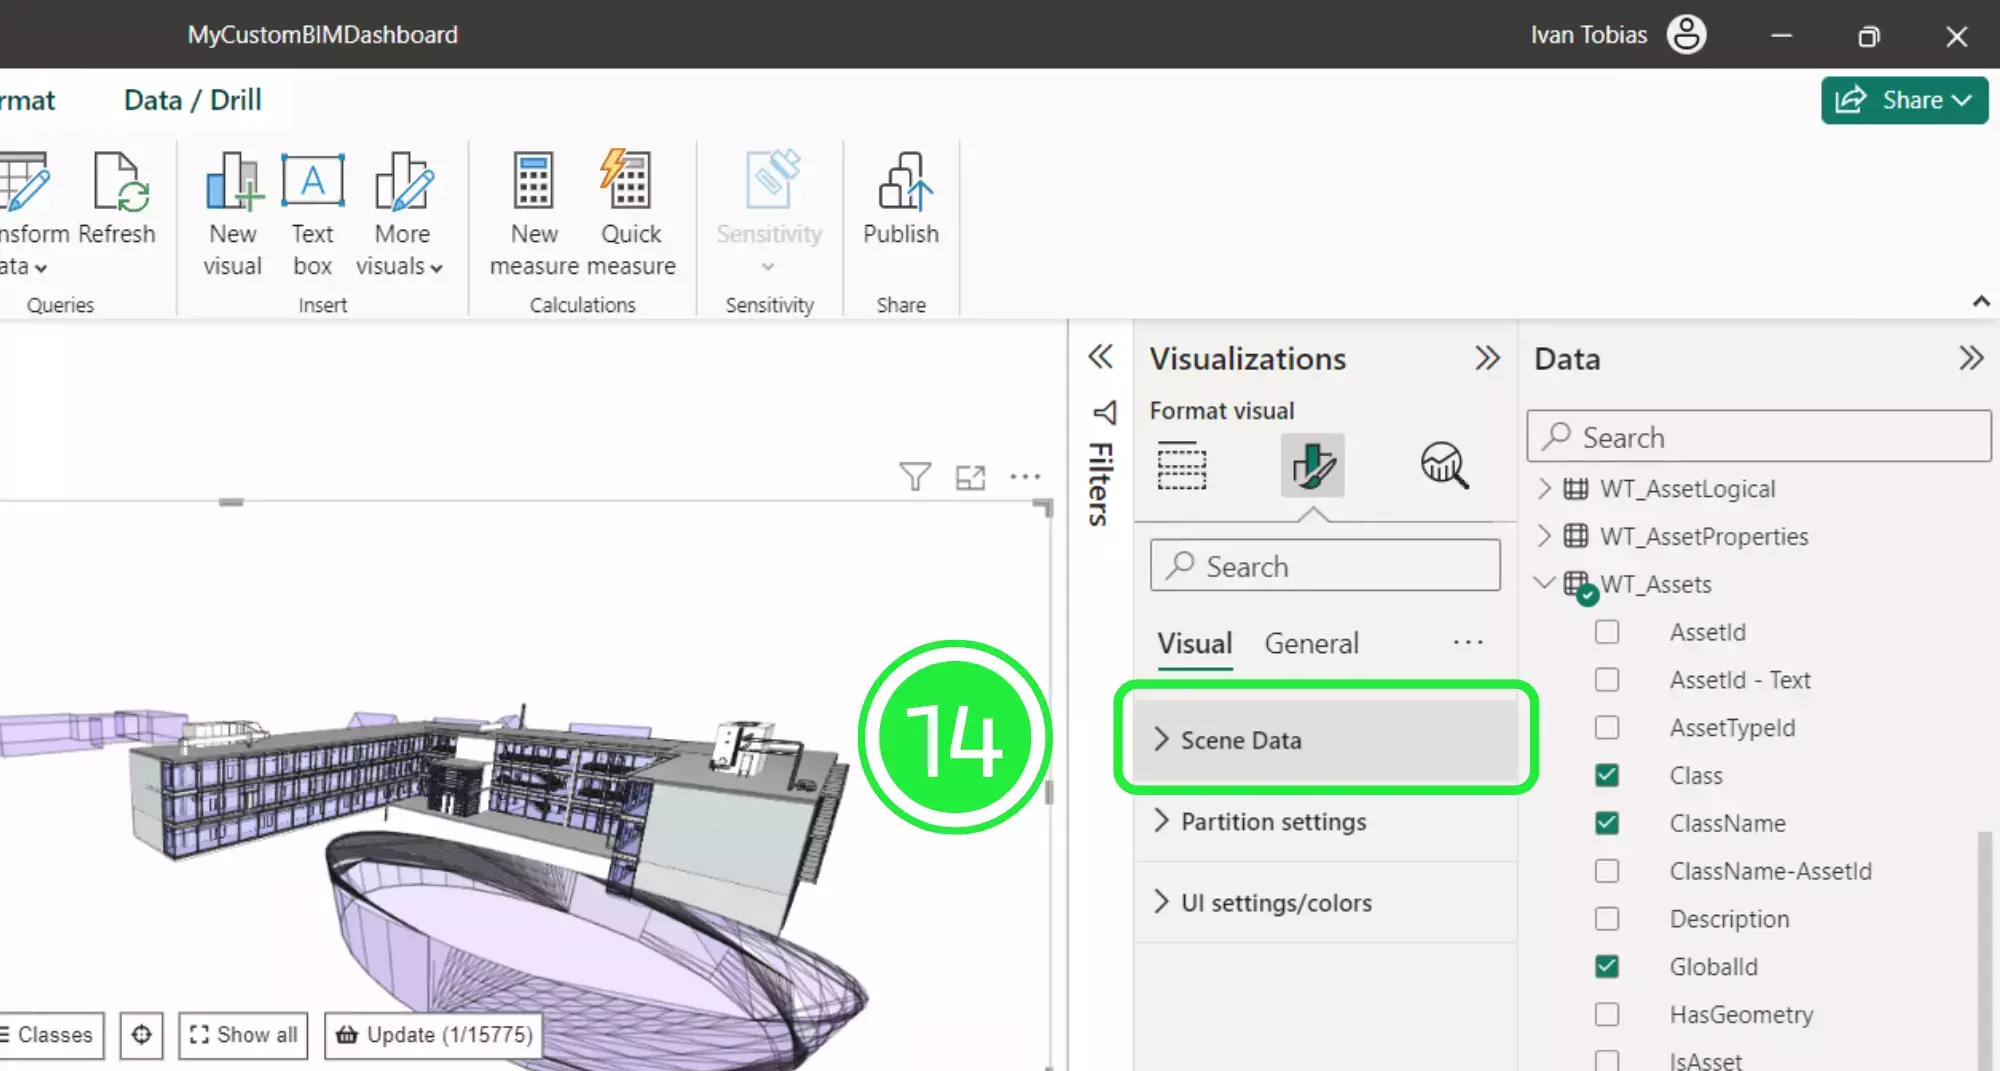
Enable the “Selection” tool by toggling the button to “on”.
The “Selection” tool will now appear in the 3D BIM Viewer.
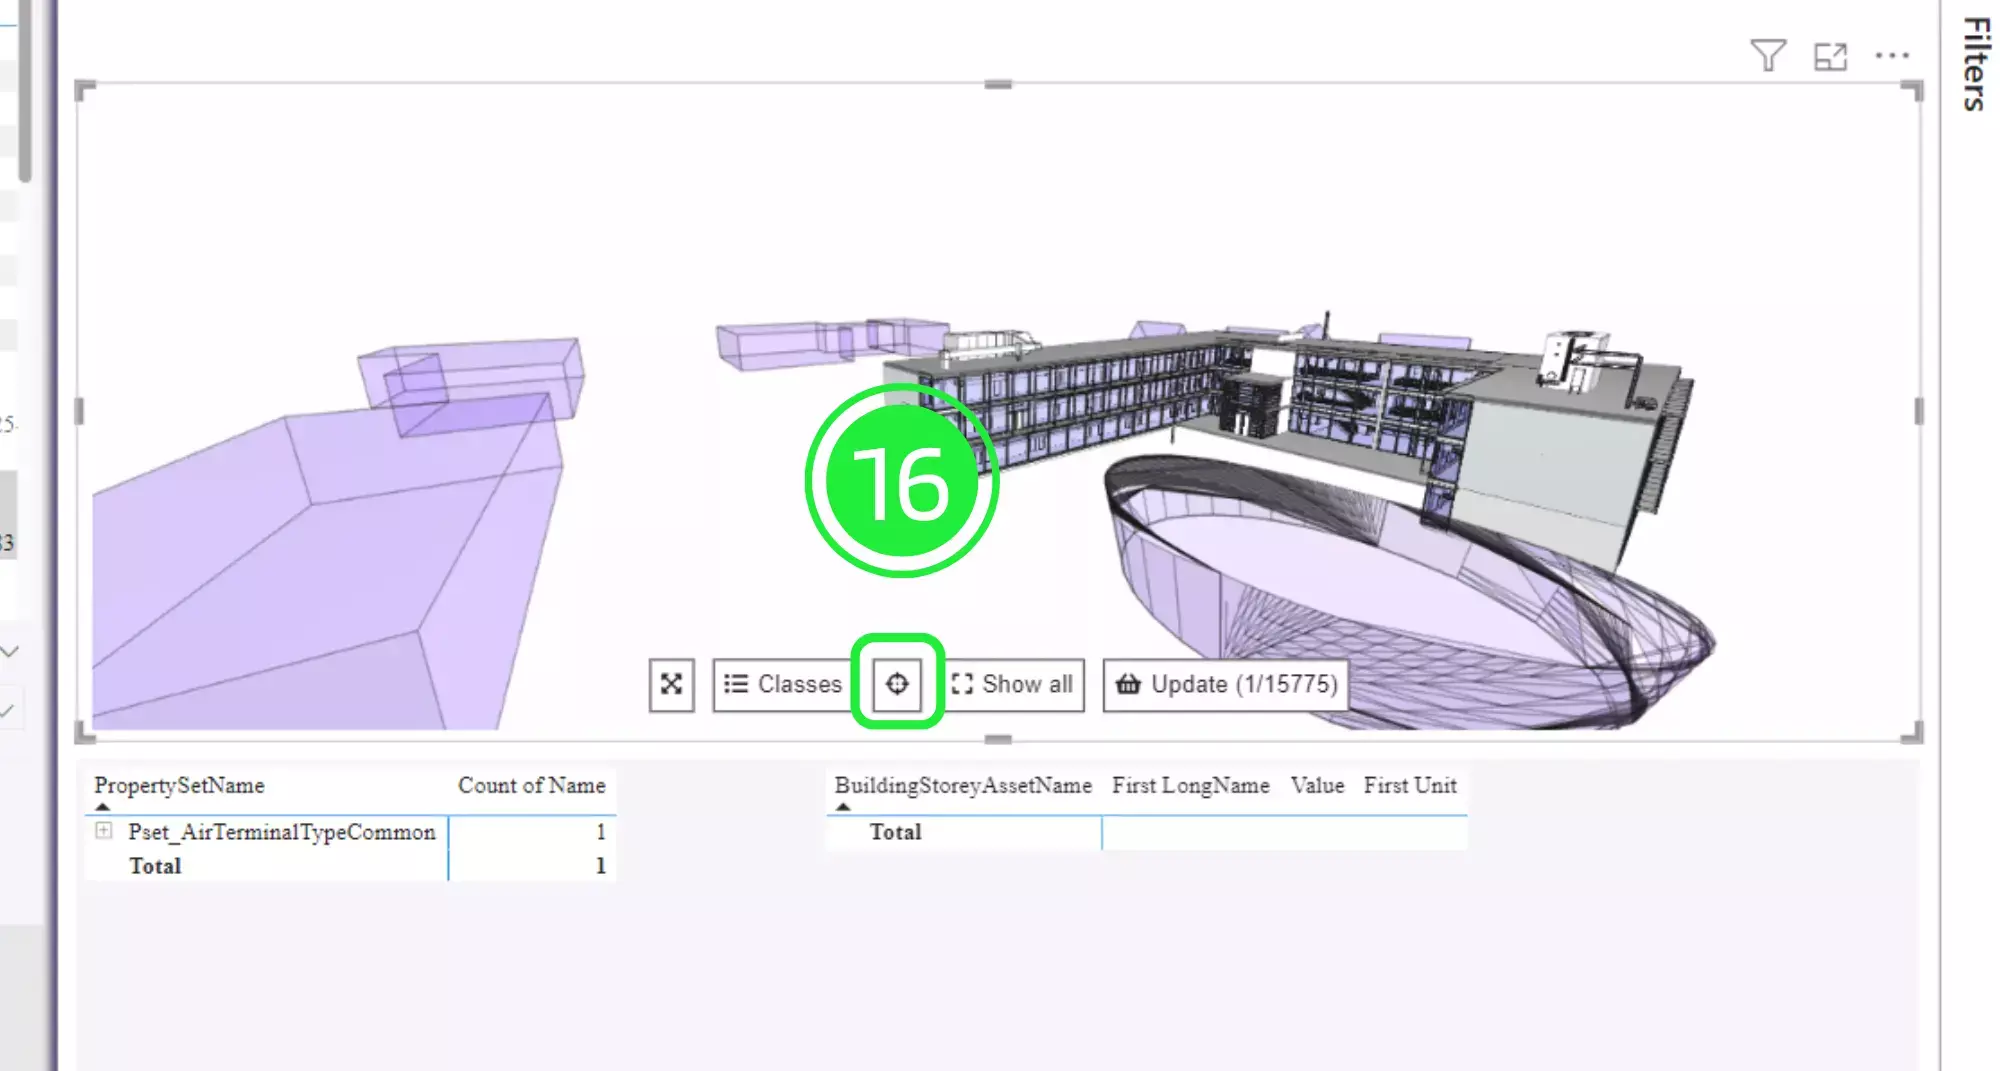
Now you can navigate to the asset you wish to select within your BIM model by using the SeveUp 3D BIM viewer customization. Then click on the “Selection” tool.
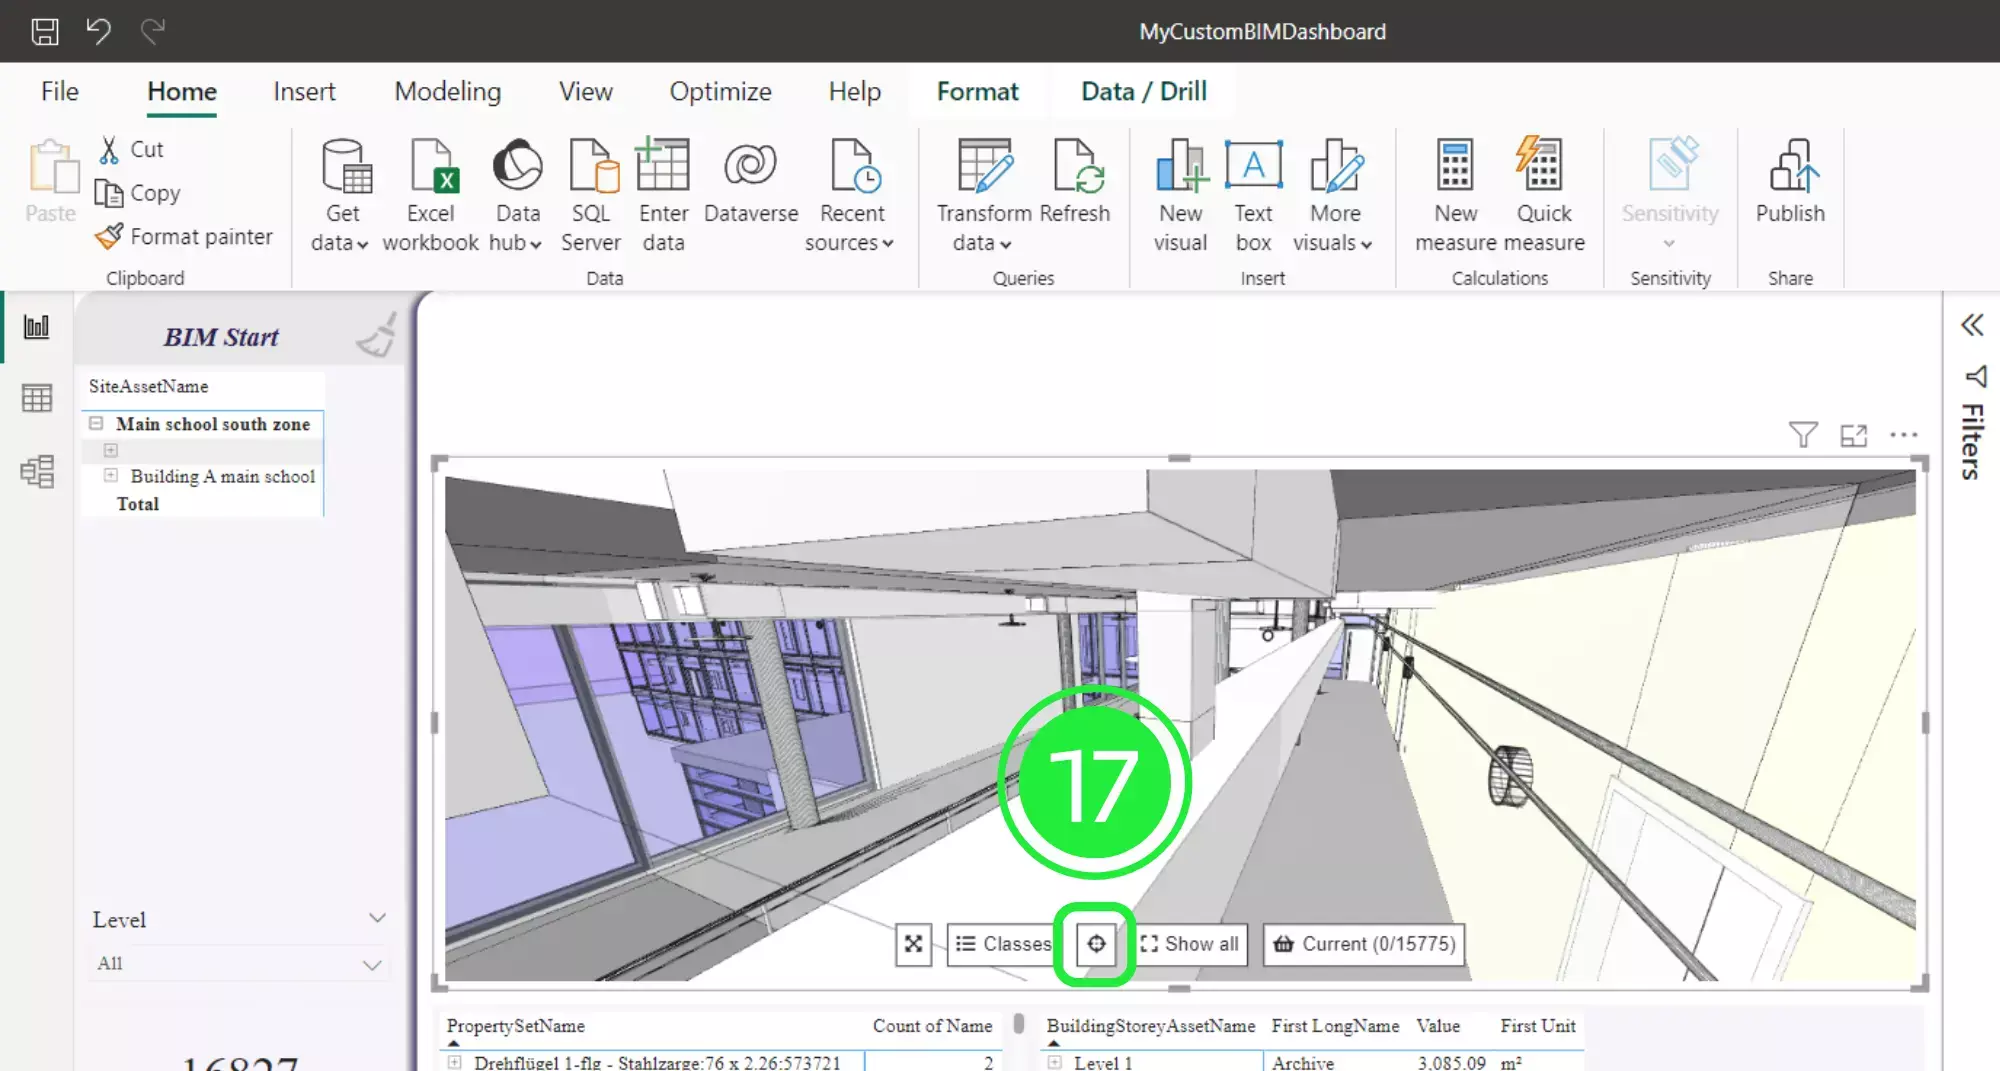
You’ll now notice that when you hover your cursor over any asset it will be highlighted. Click on your chosen asset in the BIM viewer.
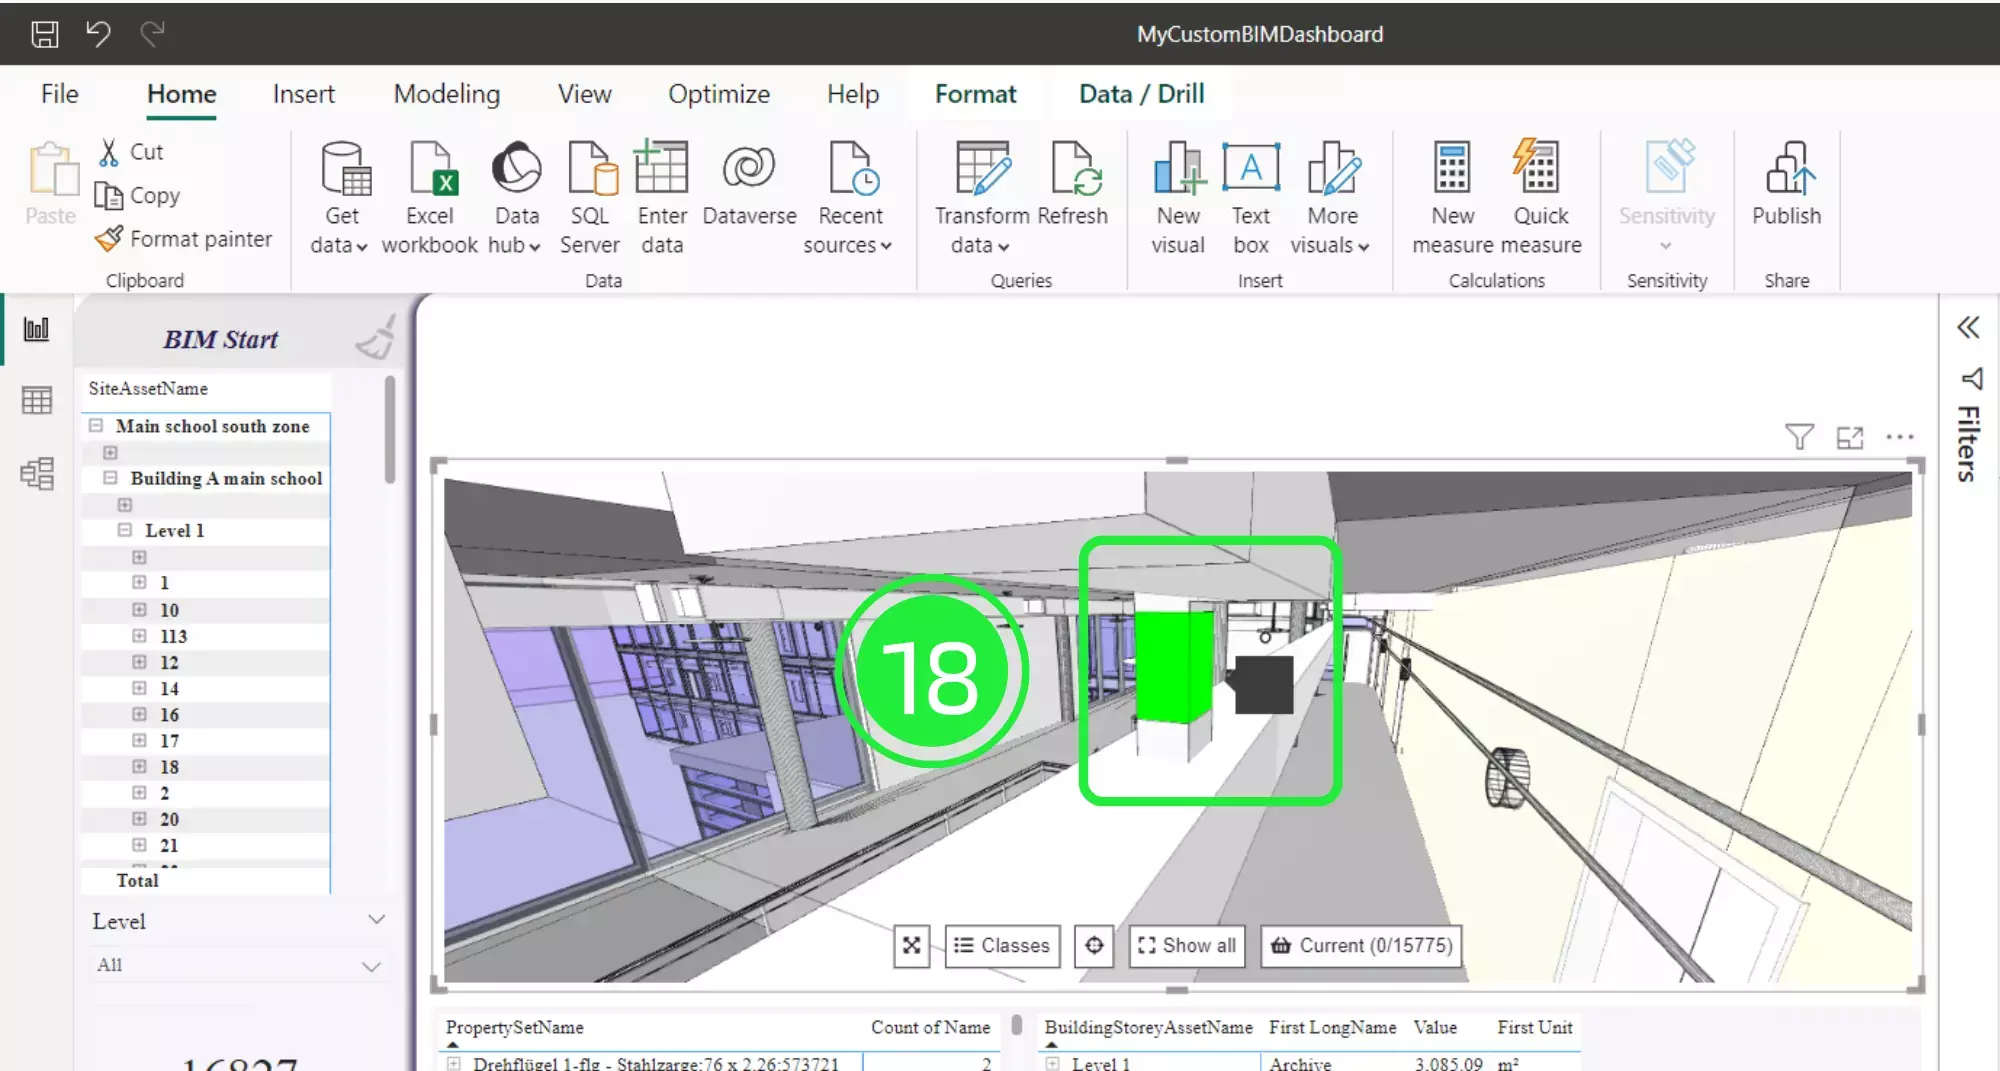
When you click on any of the assets within the 3D BIM viewer customization all of the other visuals that are added to the dashboard will change to reflect your selection.
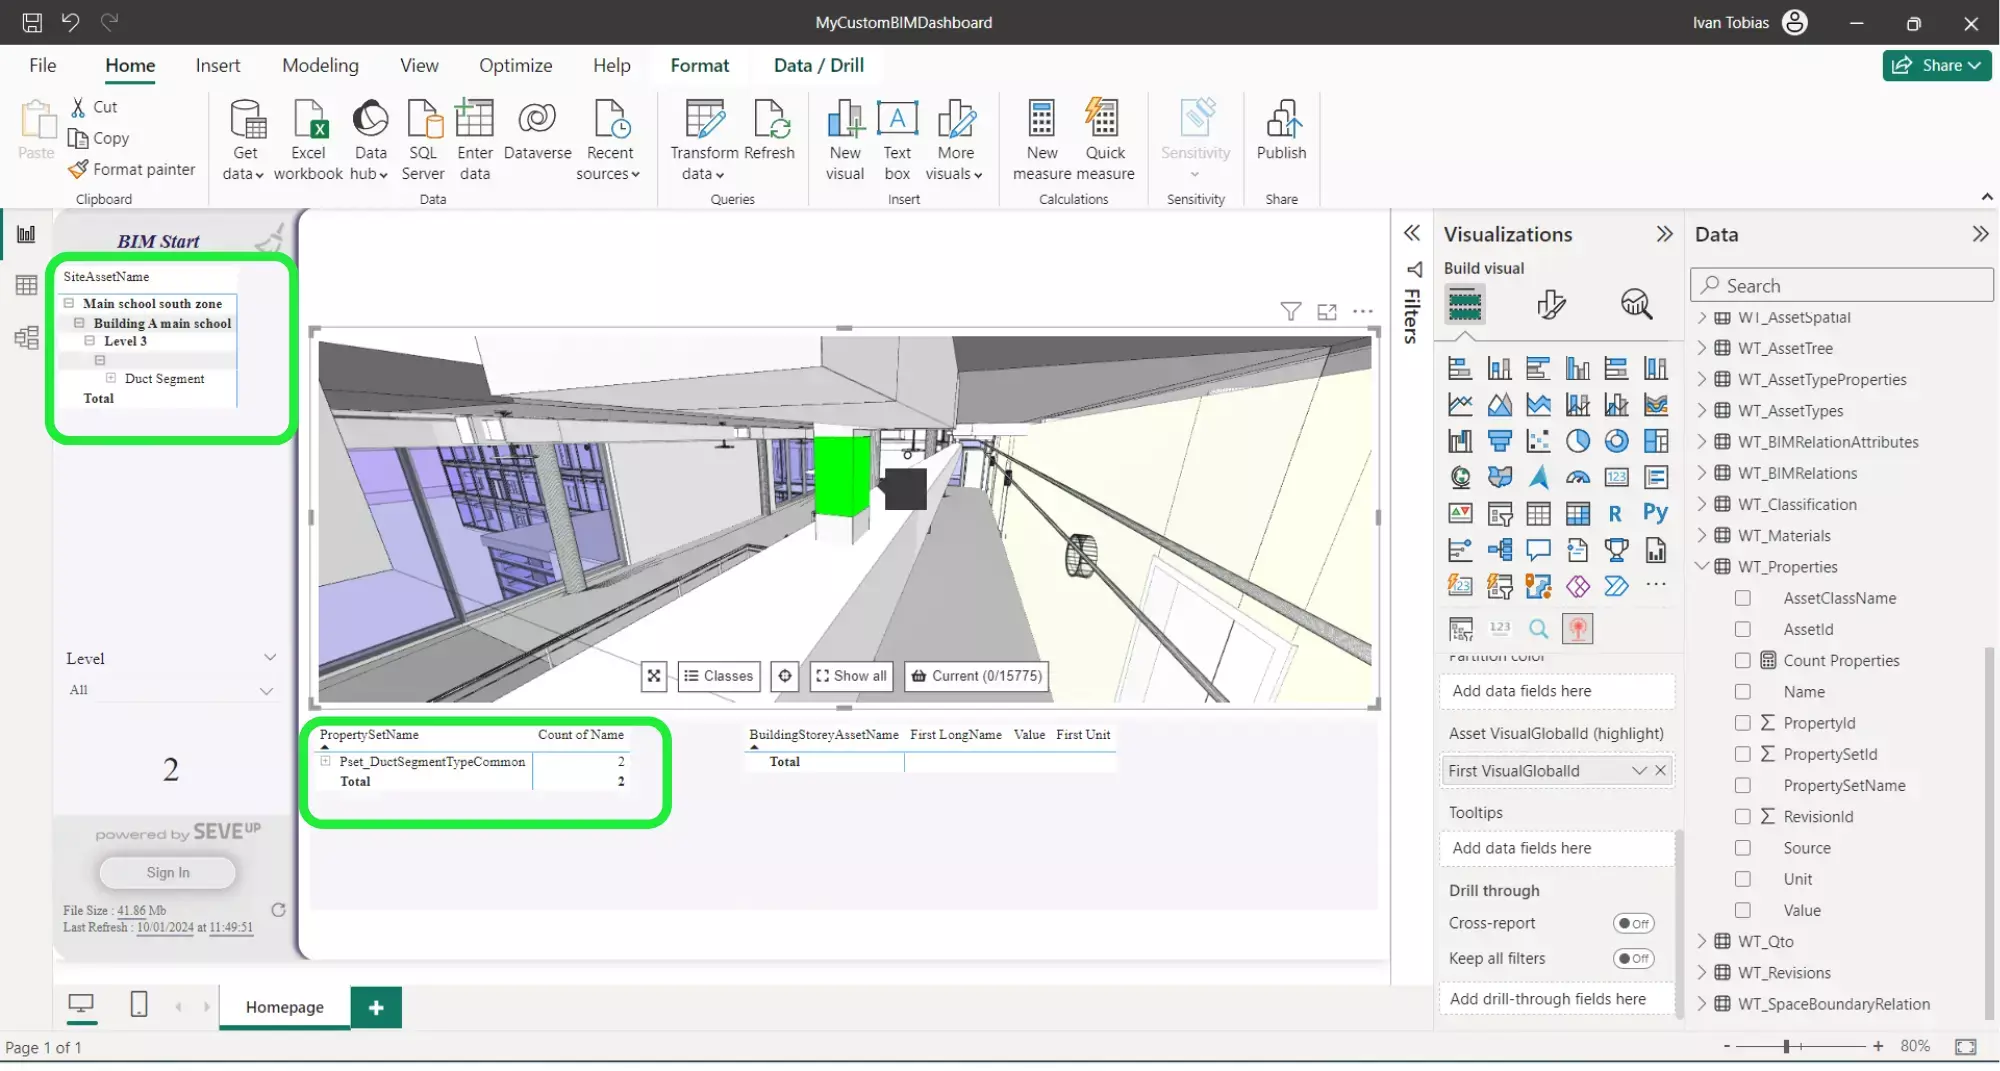
Another customisable feature is the Tooltip when you select an object. Whatever information you would prefer to have displayed when selecting an asset can easily be added.
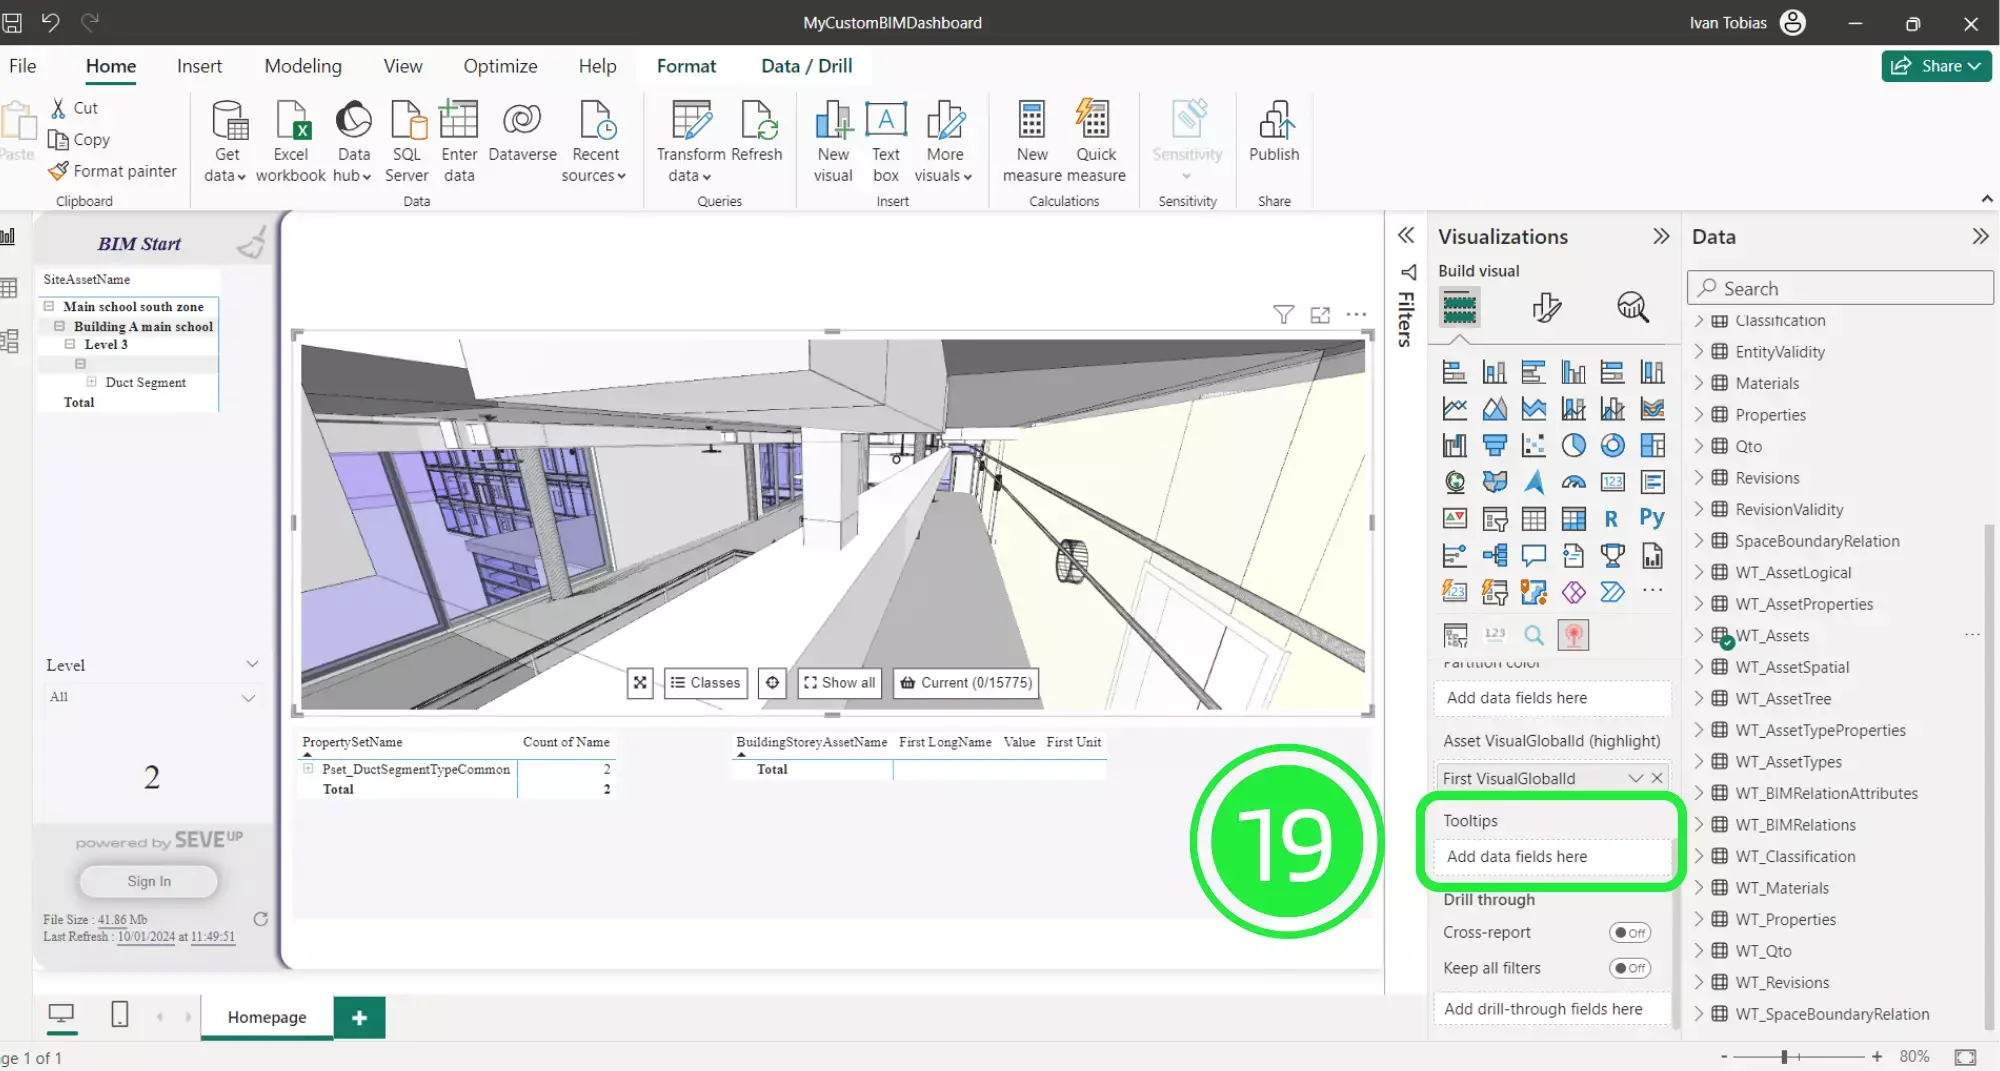
Under “Build Your Visual” in the “Visualisations” pane, scroll down until you come to “Tooltips”.
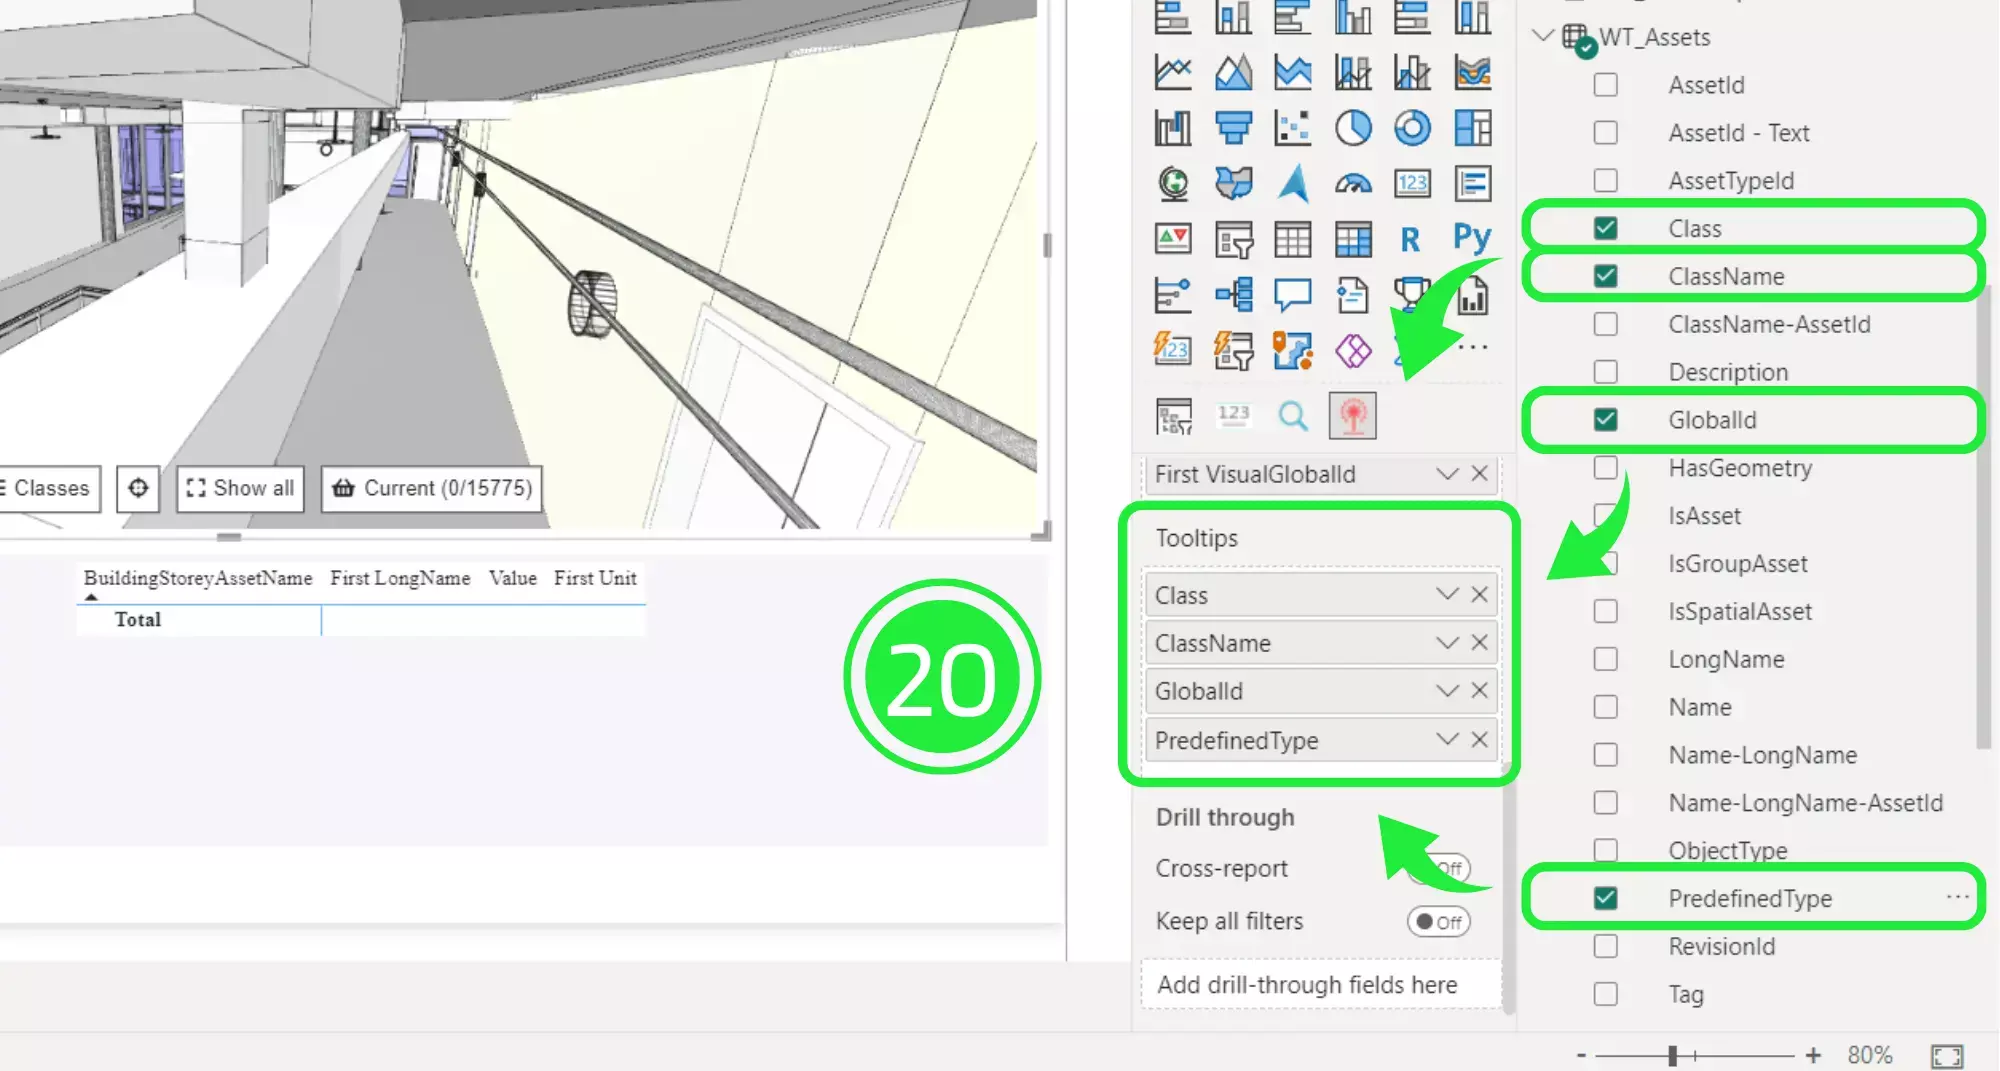
Under the “Data” pane scroll to “WT_Assets” and drop down the menu. Then drag and drop “Class”, “ClassName”, GlobalId” and “Predefined type” over to “Tooltips”. The order you arrange them will be the order that they will show on the “Tooltip”.
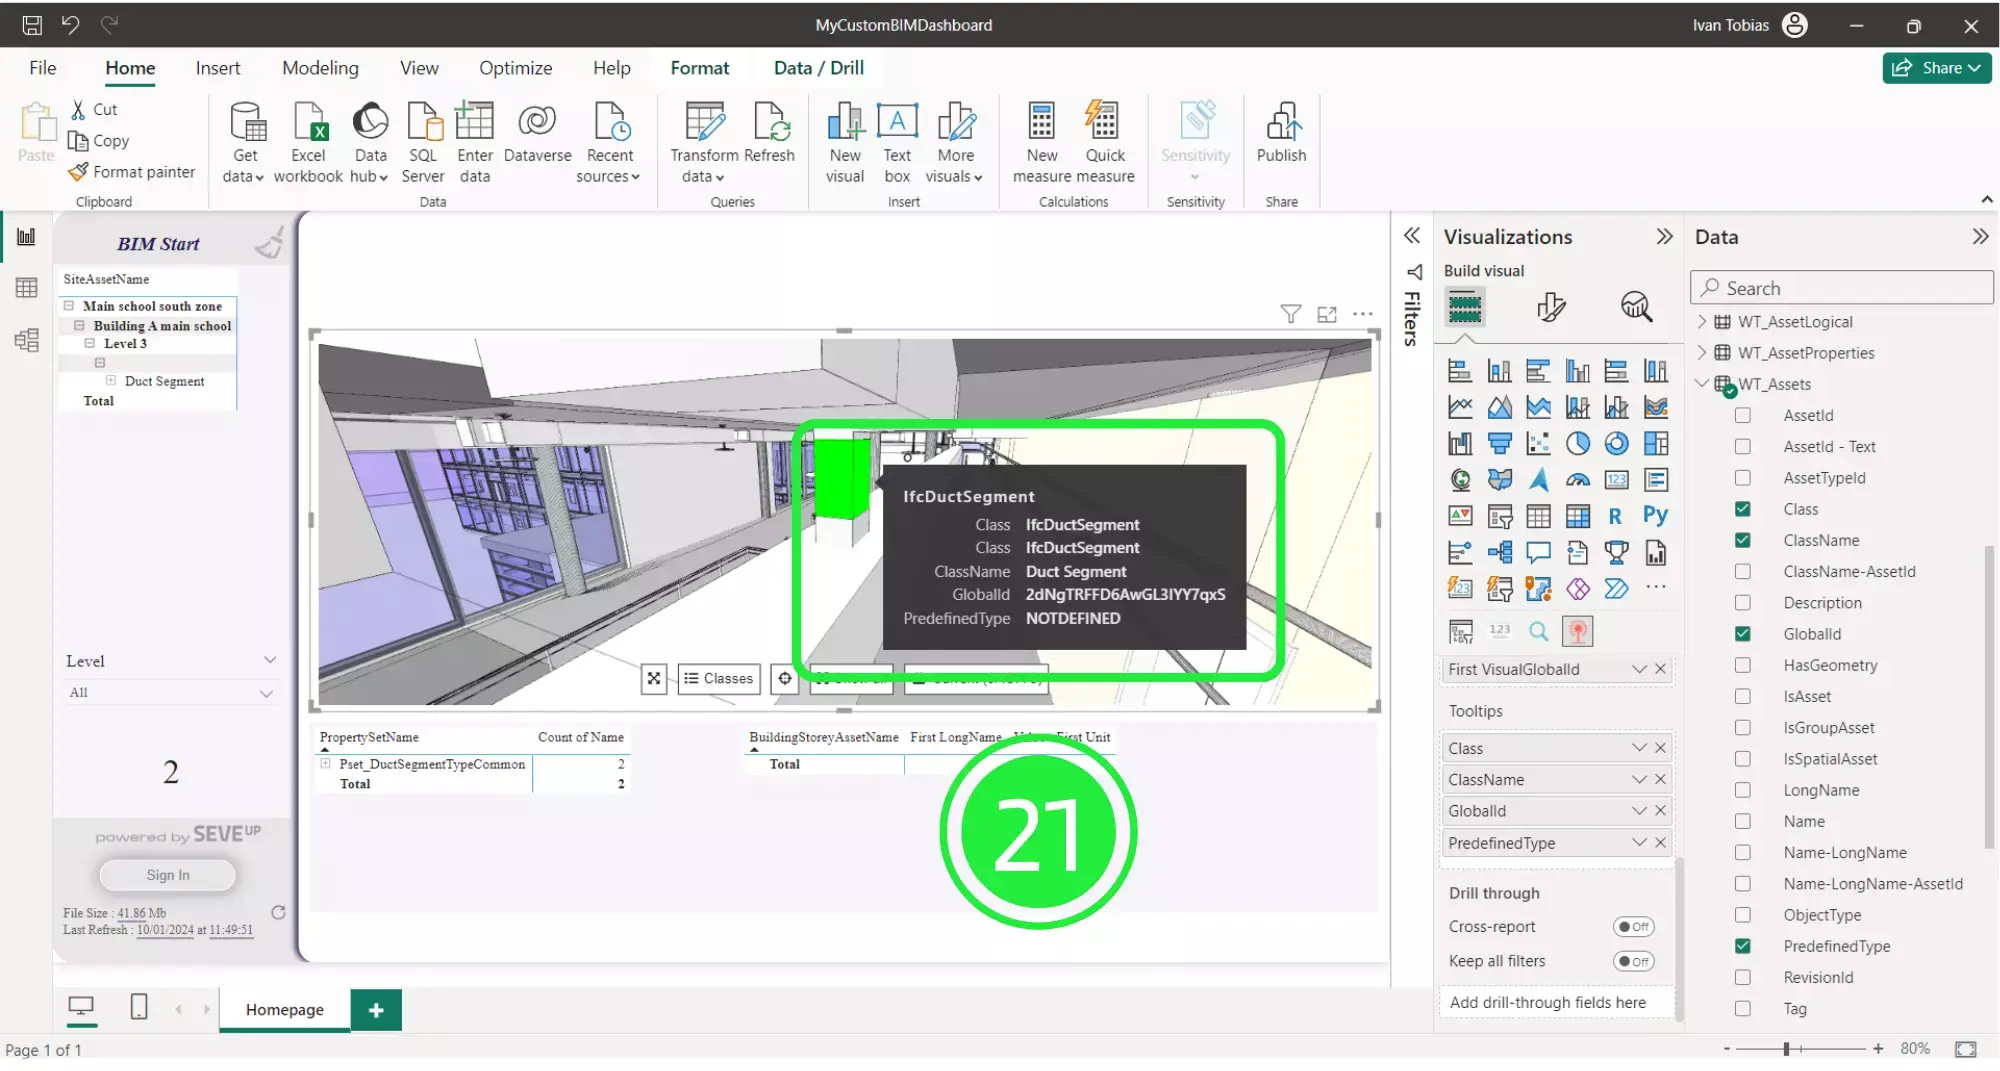
Now when you navigate to your desired asset and click on it the “tooltip” information that you selected will show next to the asset.
Want to get started with your very own BIM project? You’ll be surprised by just how easy it is. Create your own free account is SeveUp today and give it a try.


Want to get started with your very own BIM project? You’ll be surprised by just how easy it is. Create your own free account is SeveUp today and give it a try.

Unlock the power of your building data with SeveUp. Tailored dashboards, seamless integration
🎓 Free BIM Checker Training Learn how to automate your BIM model checks and get certified. Register for Free Click
Learn More🎓 Free BIM Checker Training Learn how to automate your BIM model checks and get certified. Register for Free Click
Learn More🎓 Free BIM Checker Training Learn how to automate your BIM model checks and get certified. Register for Free Choose
Learn More