Trusted by companies
all over the world:
Welcome to SeveUp’s comprehensive guide on organising your measures in Power BI. This tutorial is designed to provide a clear, step-by-step approach to creating and managing measure tables in Power BI, ensuring that your Building Information Modeling (BIM) data is systematically organised and readily accessible.
By following this guide, you will not only improve your data handling capabilities but also streamline your analytical processes, allowing for more effective data-driven decision-making.
Join us as we delve into the intricacies of measure tables, and empower your BIM data management with precision and ease.
Learn how to automate your BIM model checks and get certified.
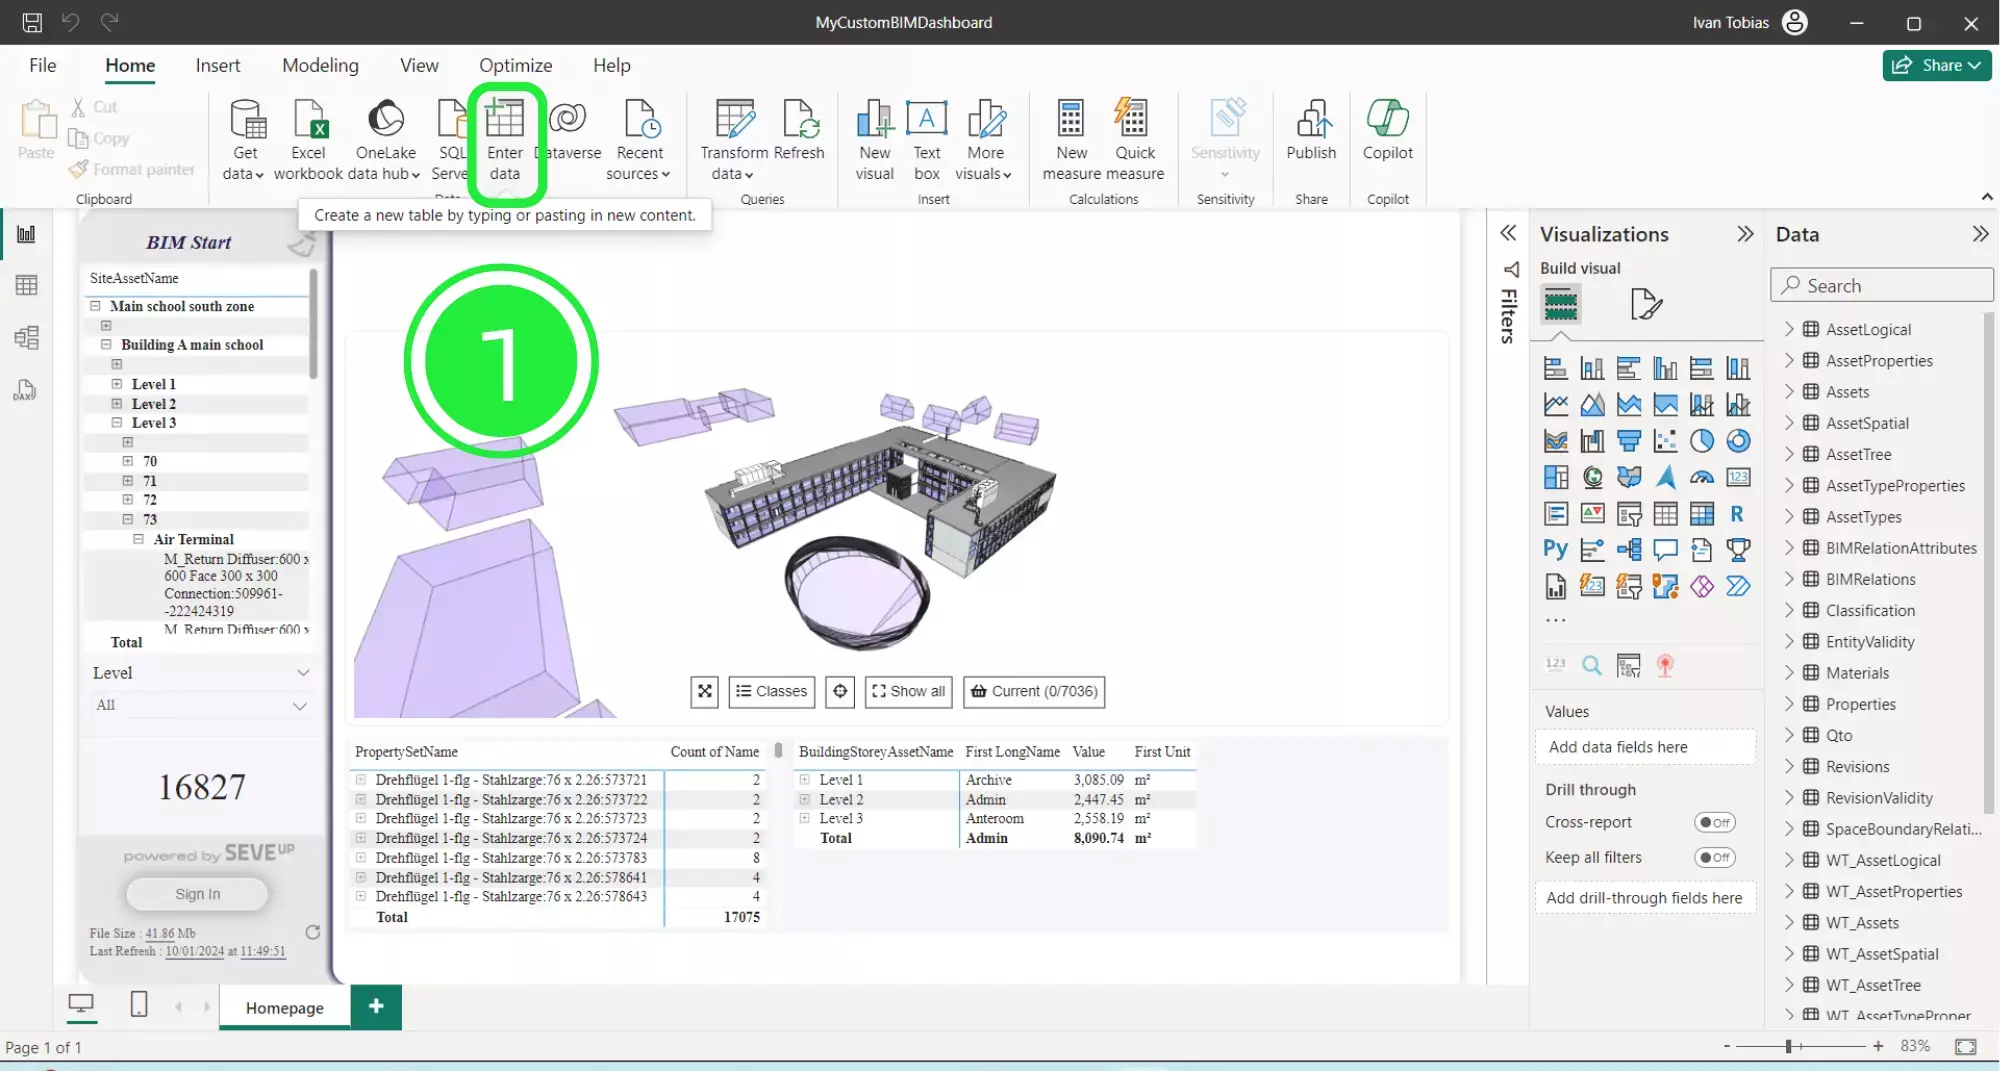
Firstly, open up the SeveUp IFC Viewer dashboard in Microsoft Power BI. Click on “Enter Data” in the top menu.
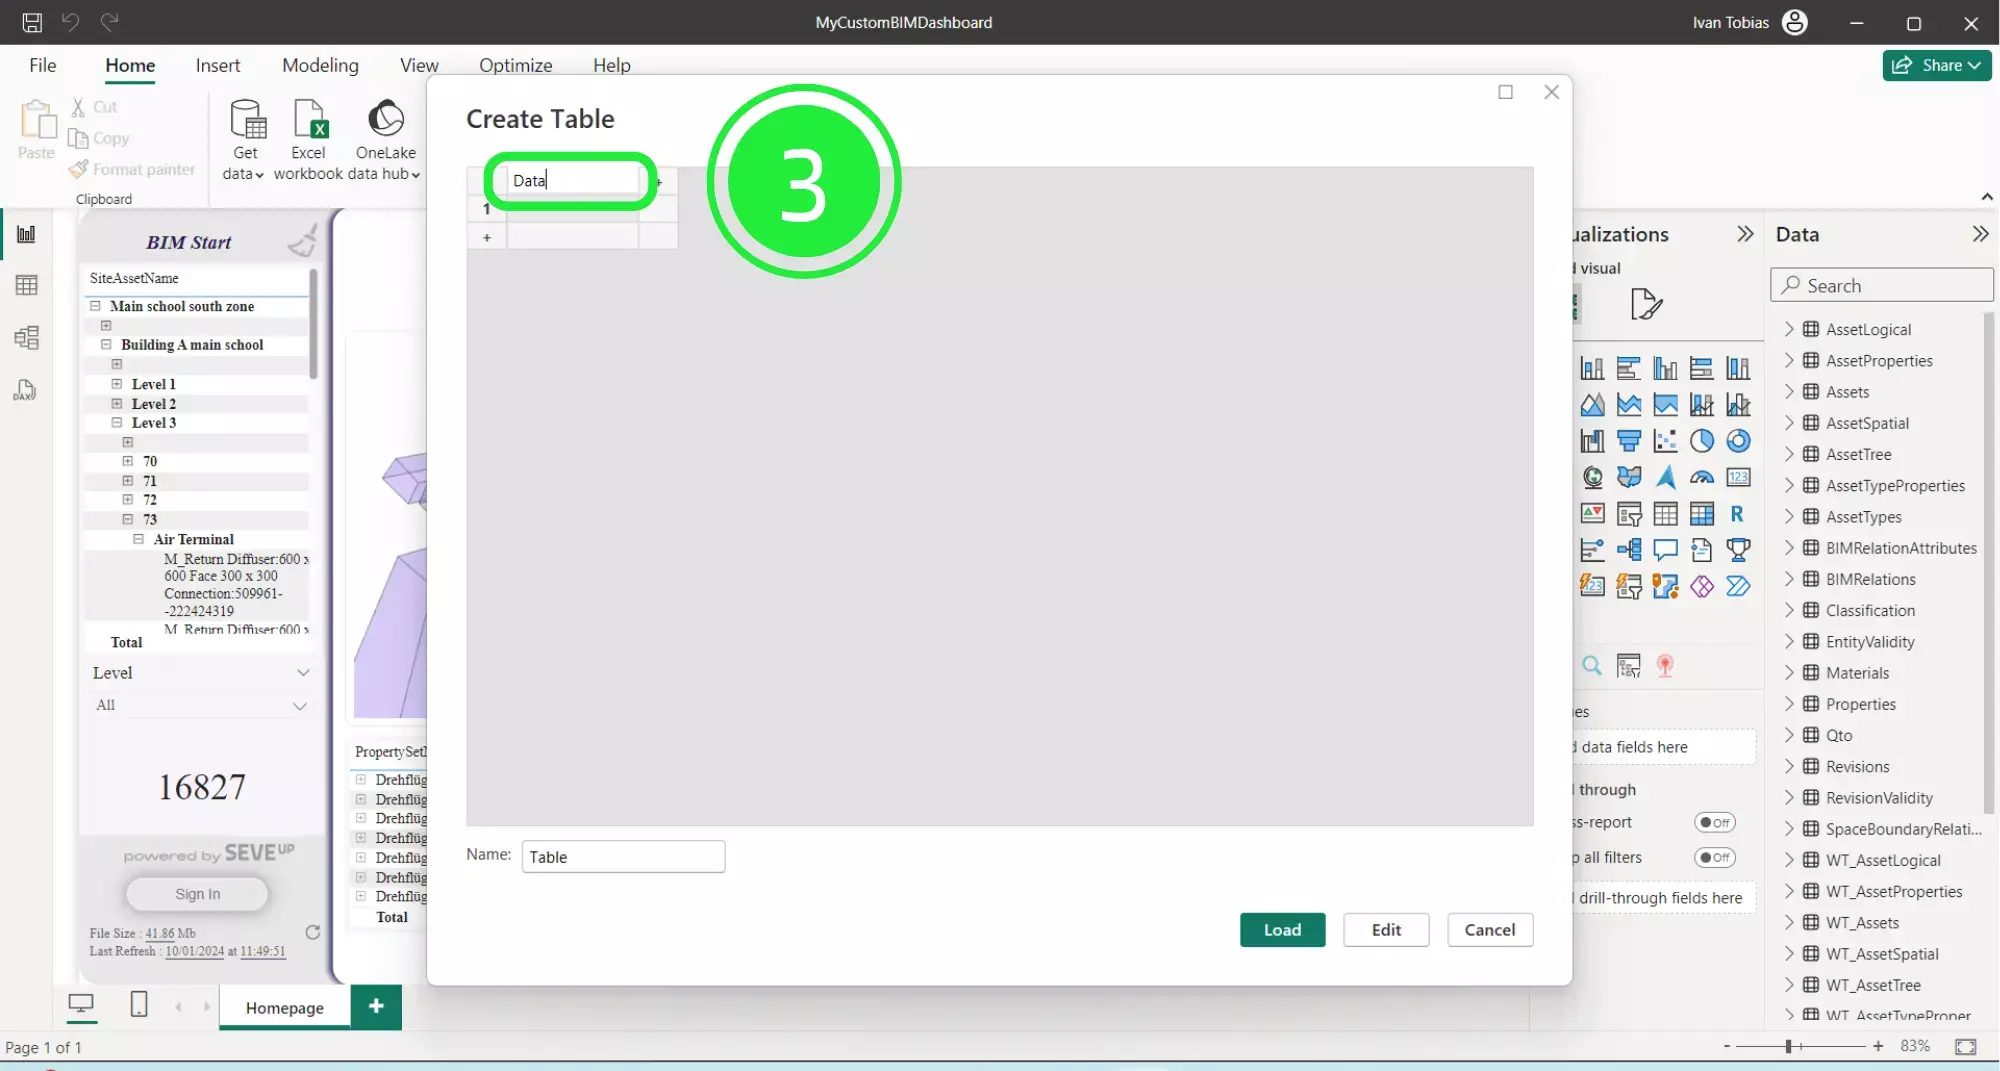
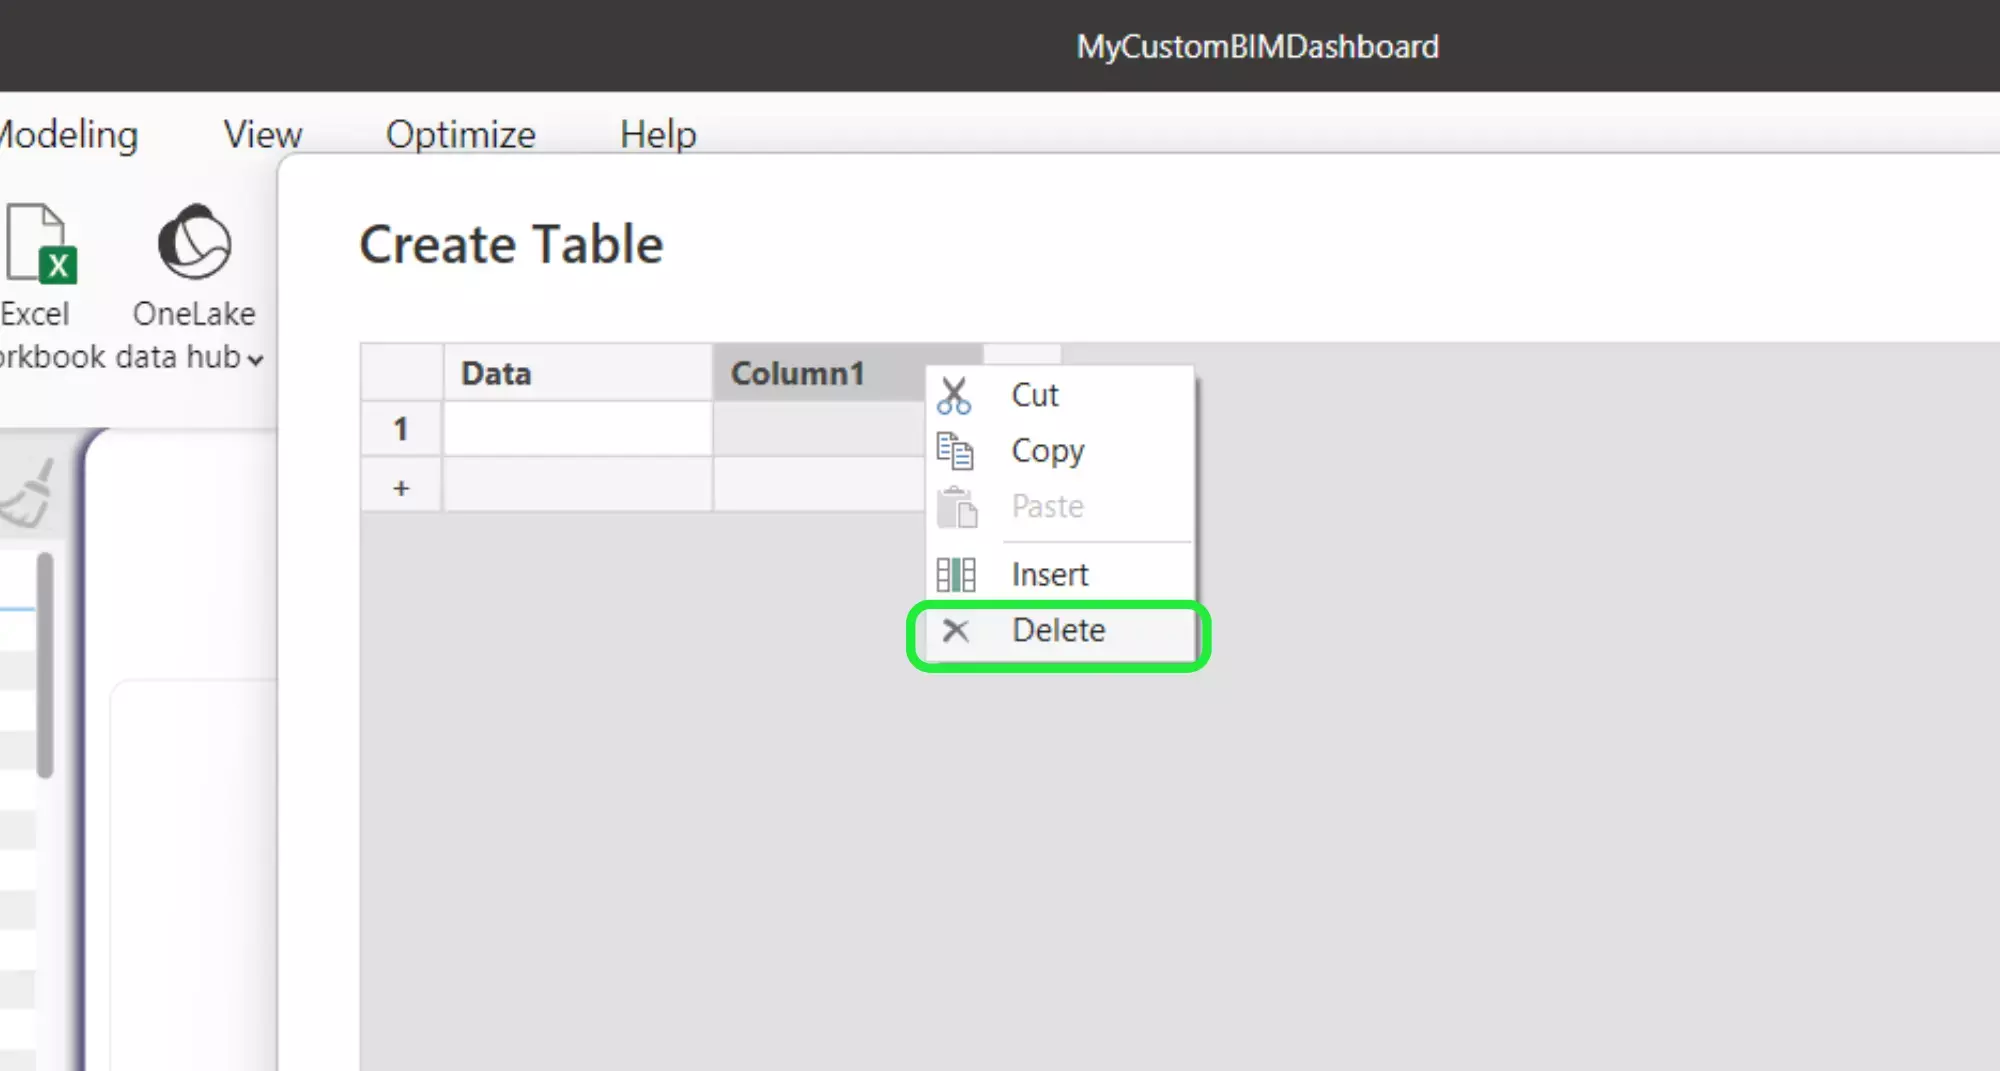
Next, a pop-up will appear for creating a table. Click on “Column1” to rename it.

Then, type in “Data” into the name for column 1.
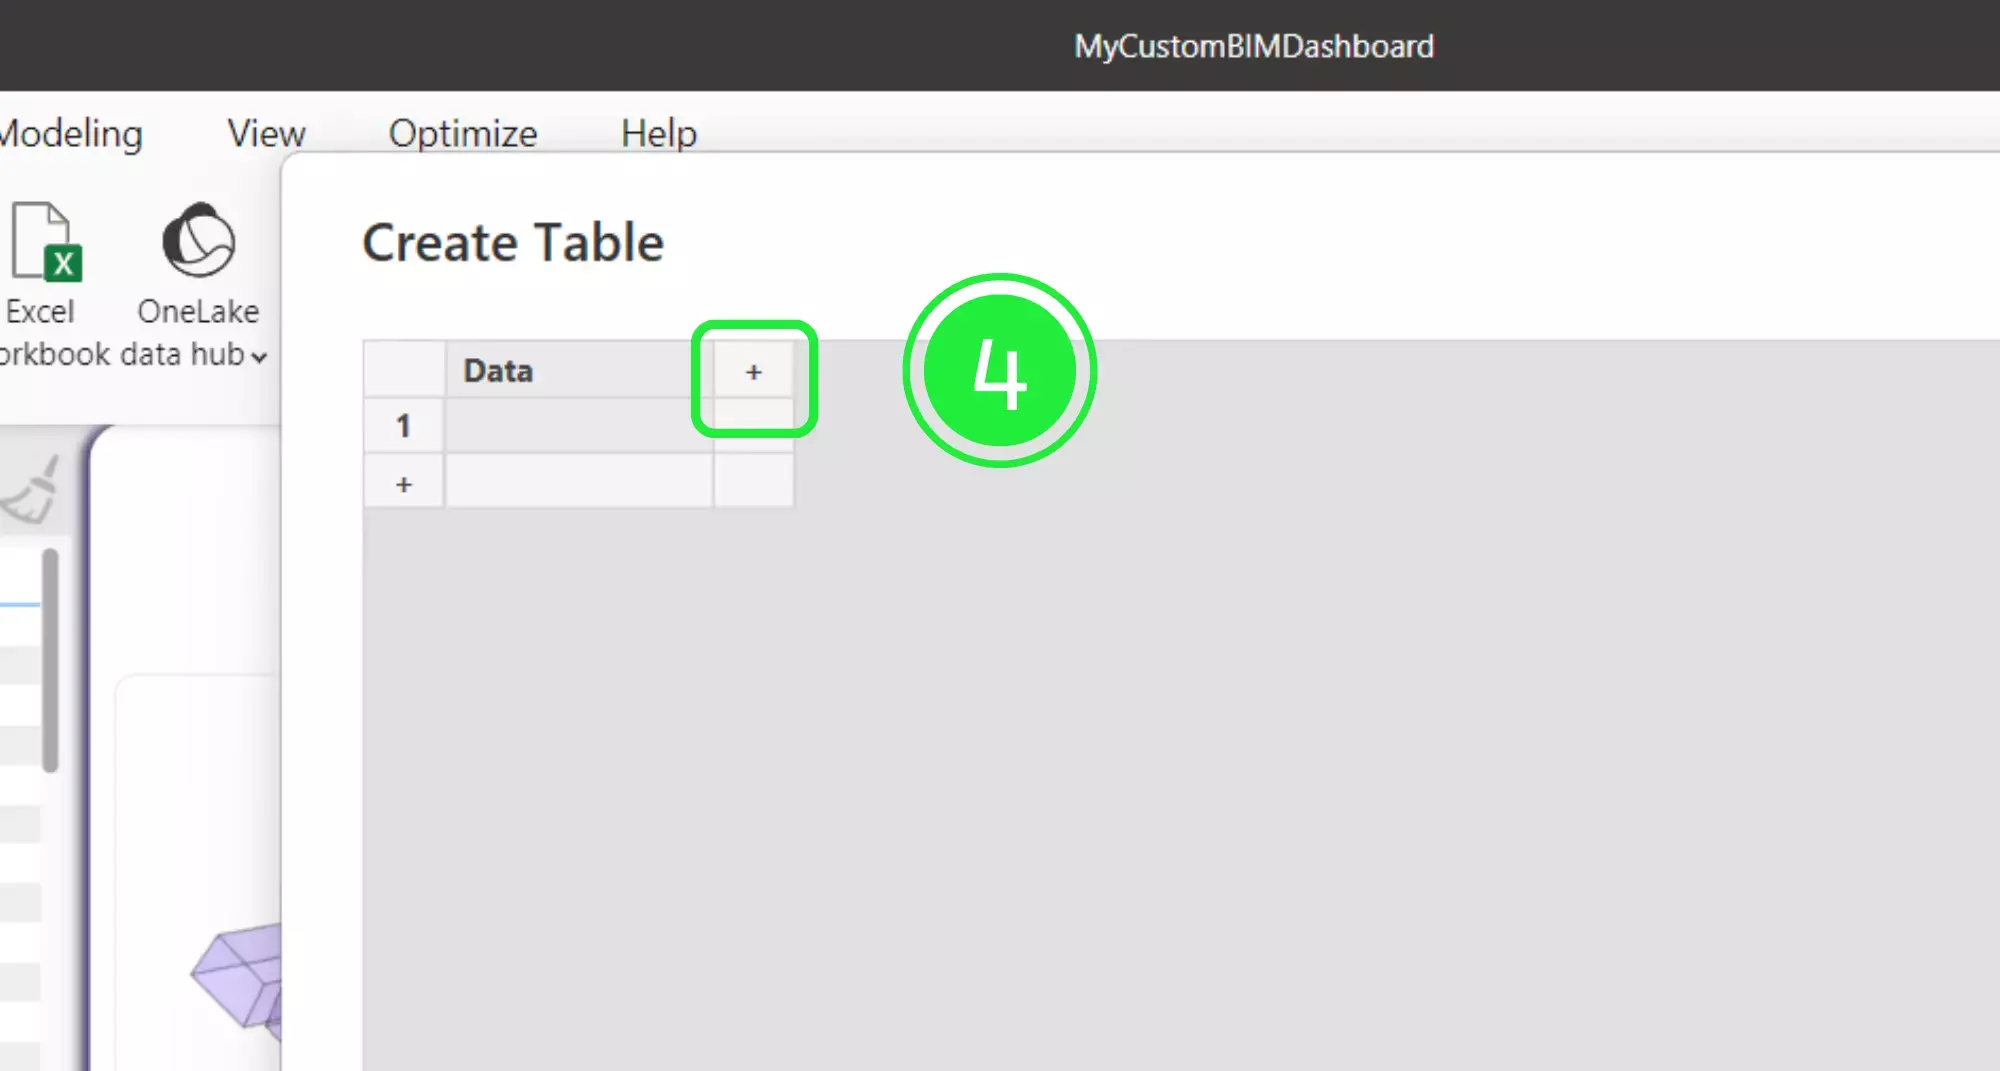
Moreover, if you want to add more columns or rows, you simply have to click on the small “+” sign to the side or below.
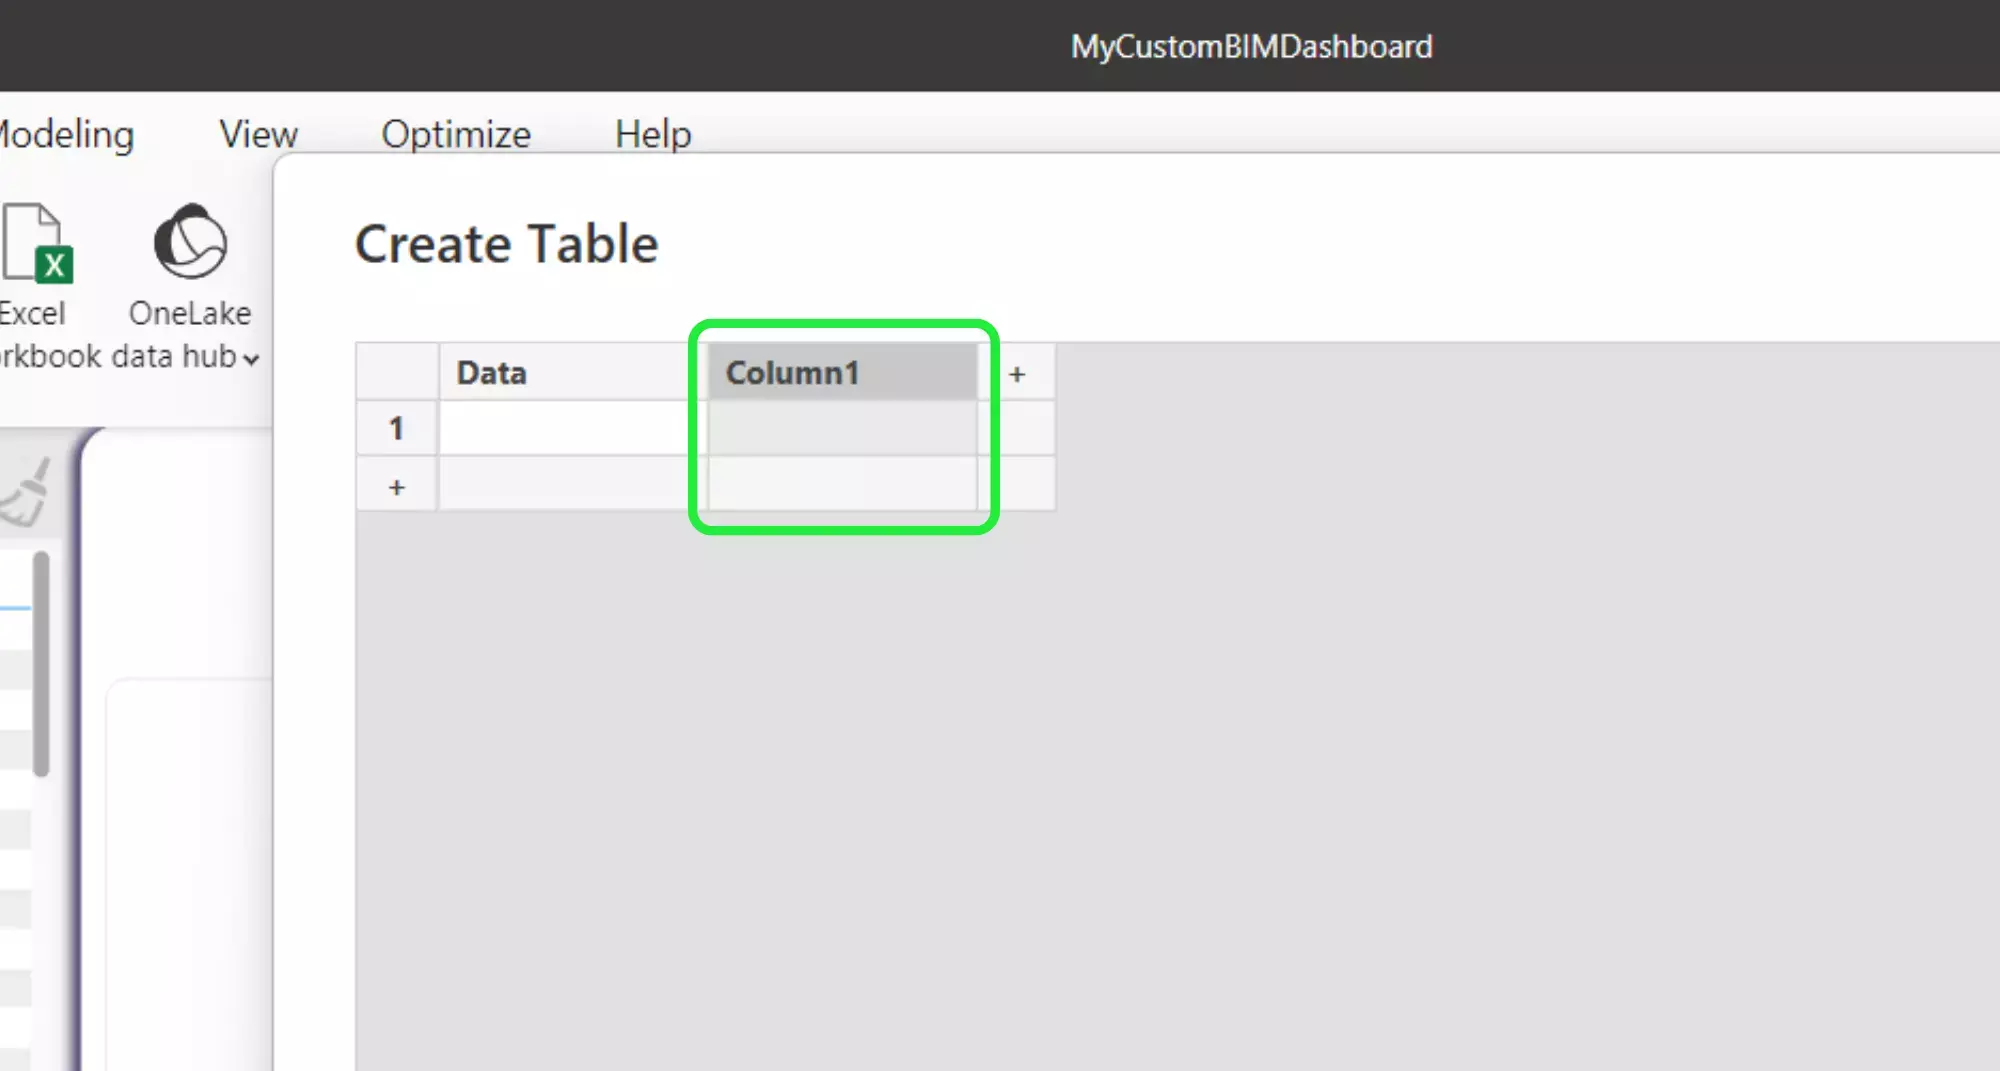
Furthermore, a new column will be added like so. You can rename the column in the same way as before.
In addition, to delete the column or row, right-click on it and select “Delete”.
You can change the name of your table in the bottom left corner of the pop-up.
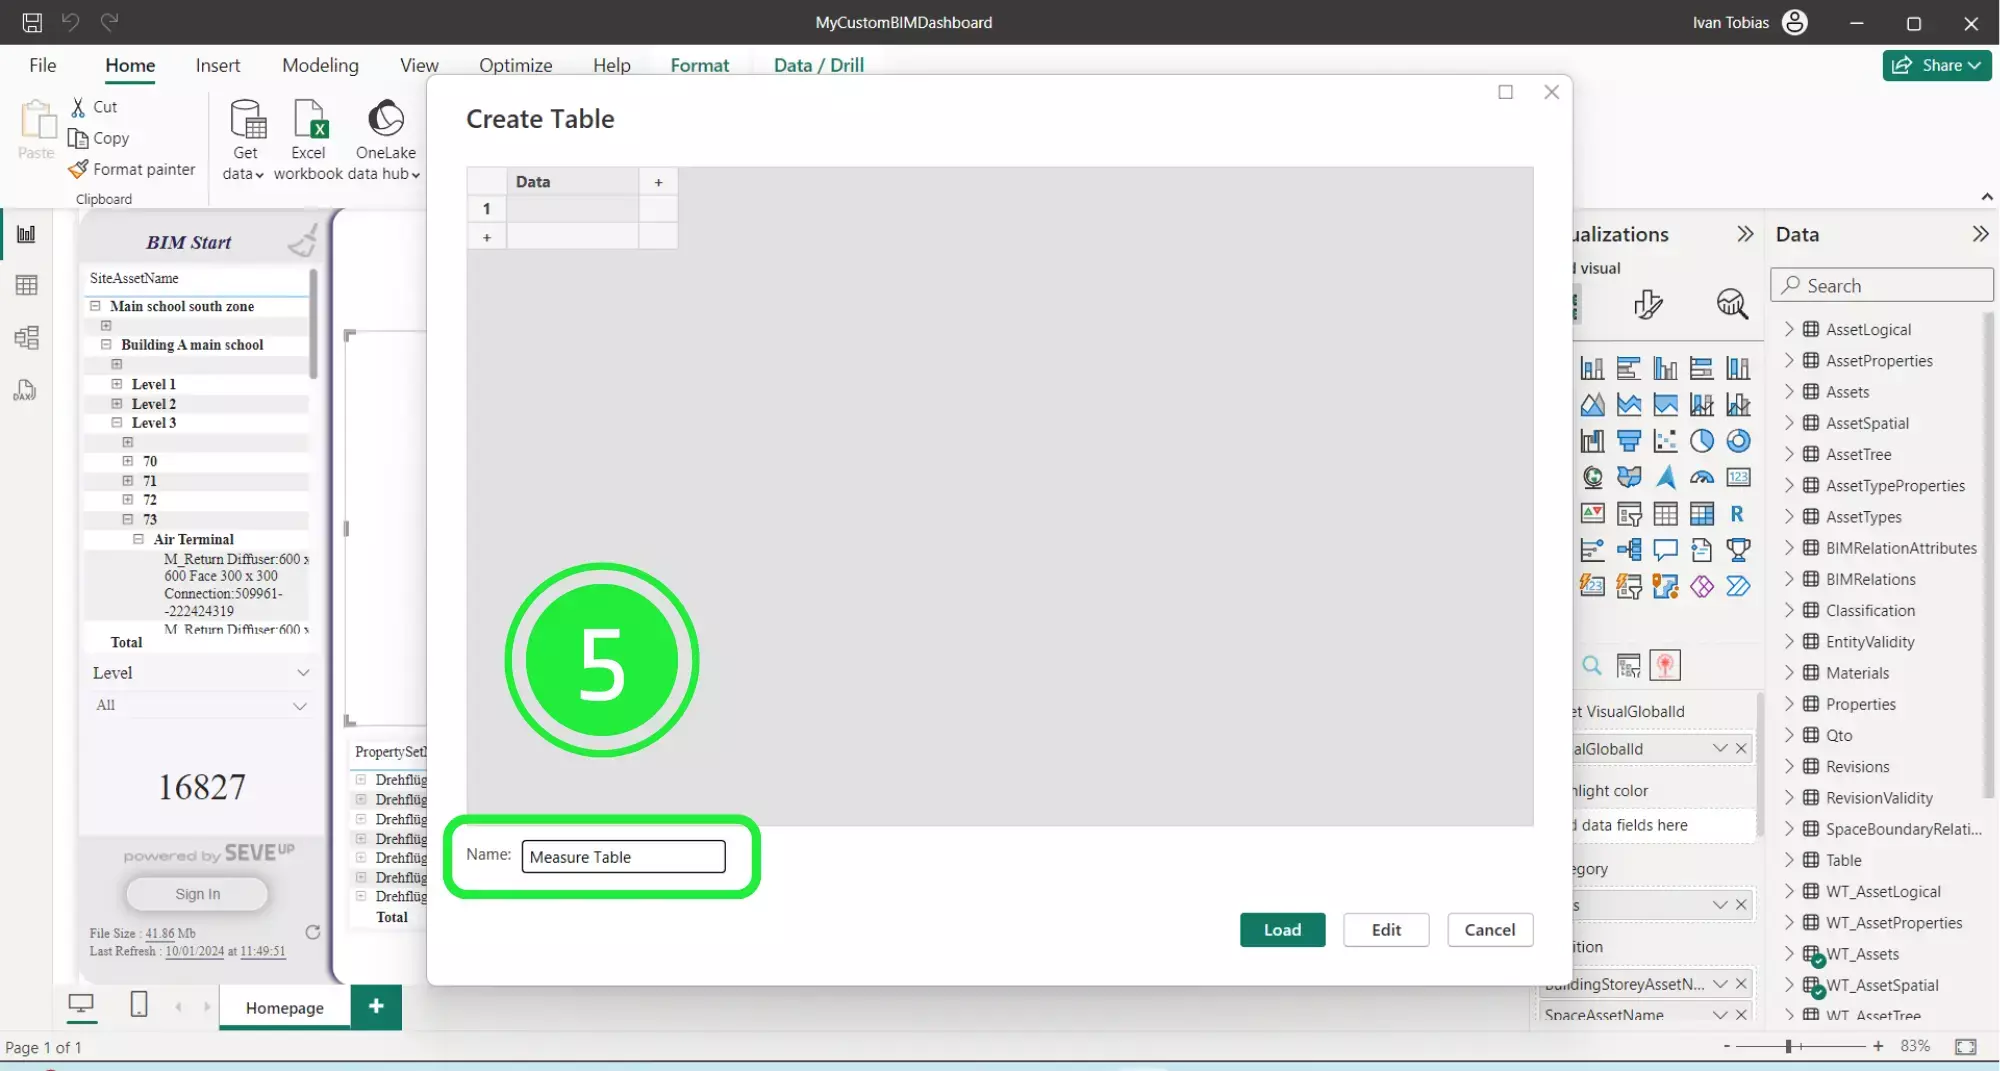
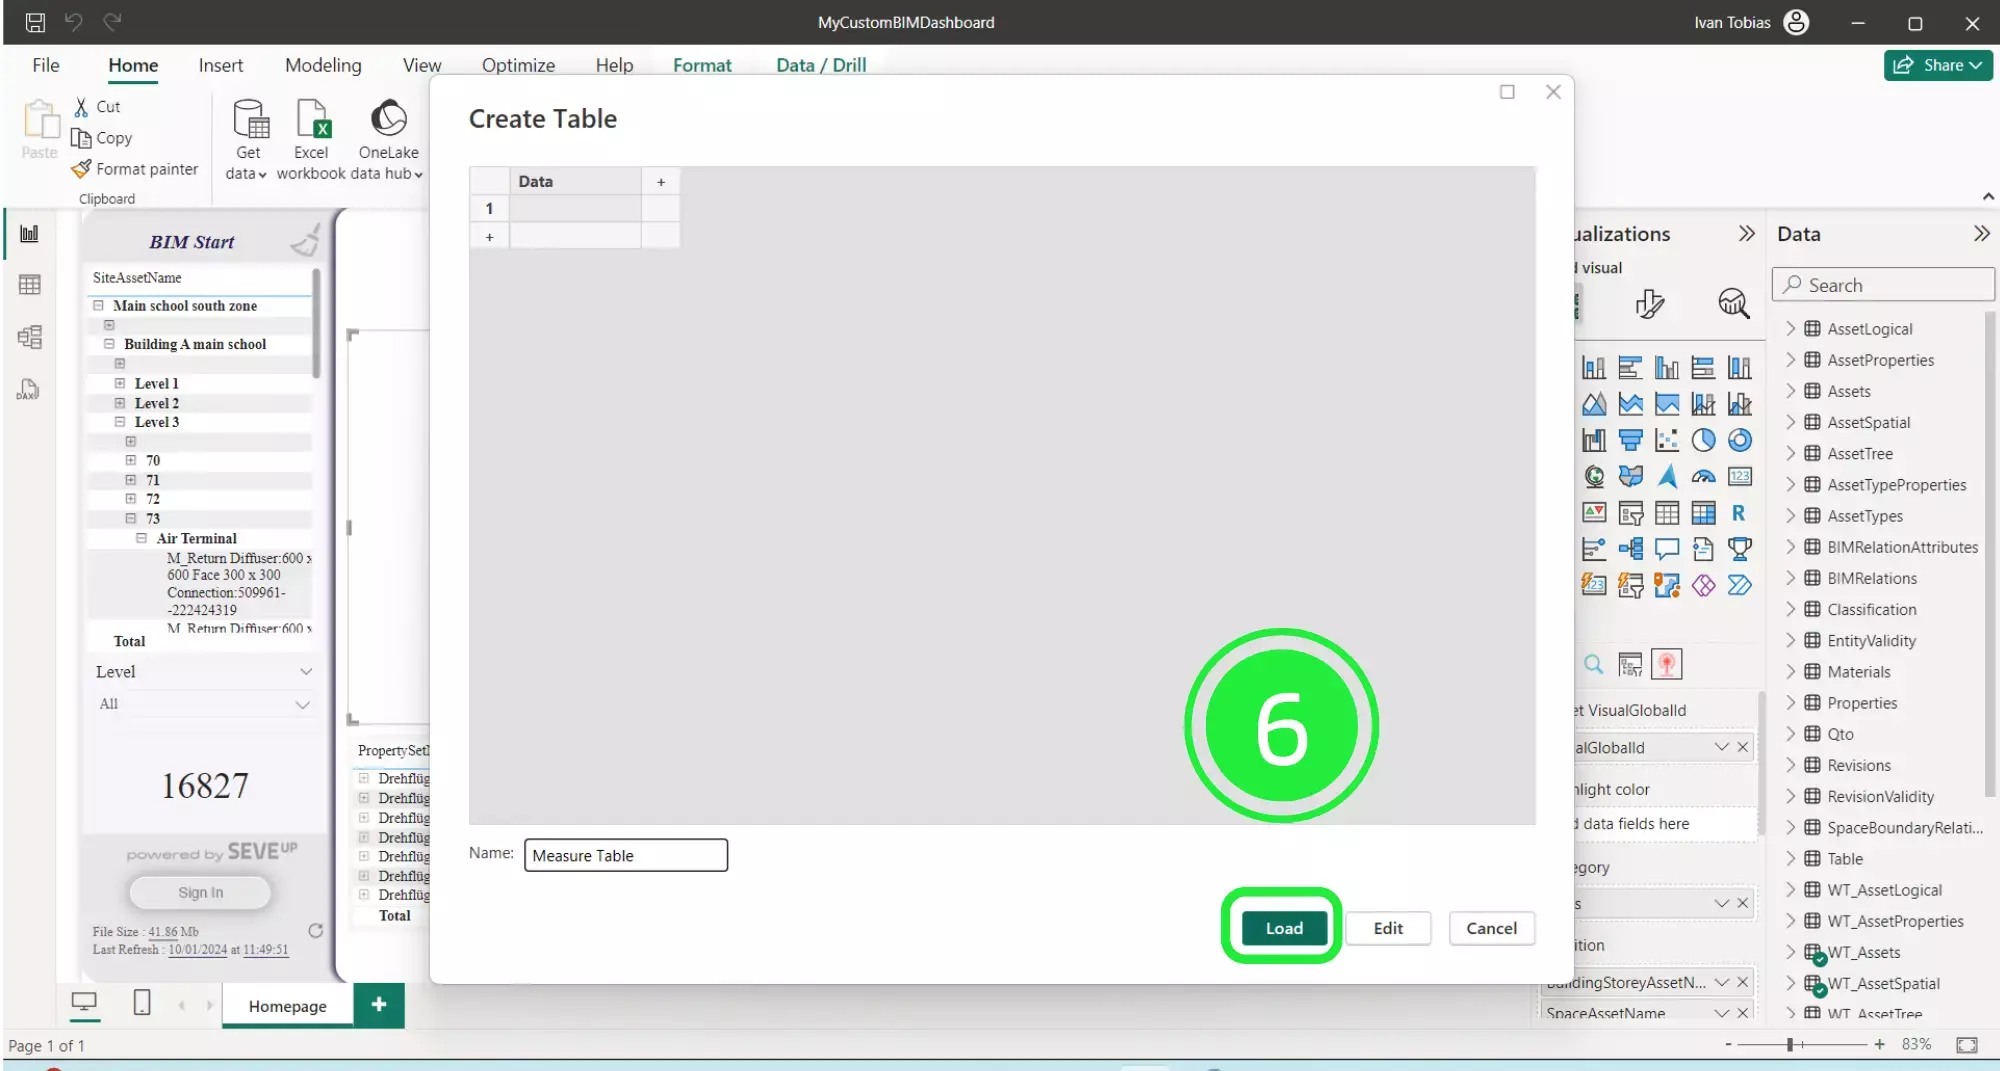
Click on “Load” at the bottom right to load the new table into the dashboard.
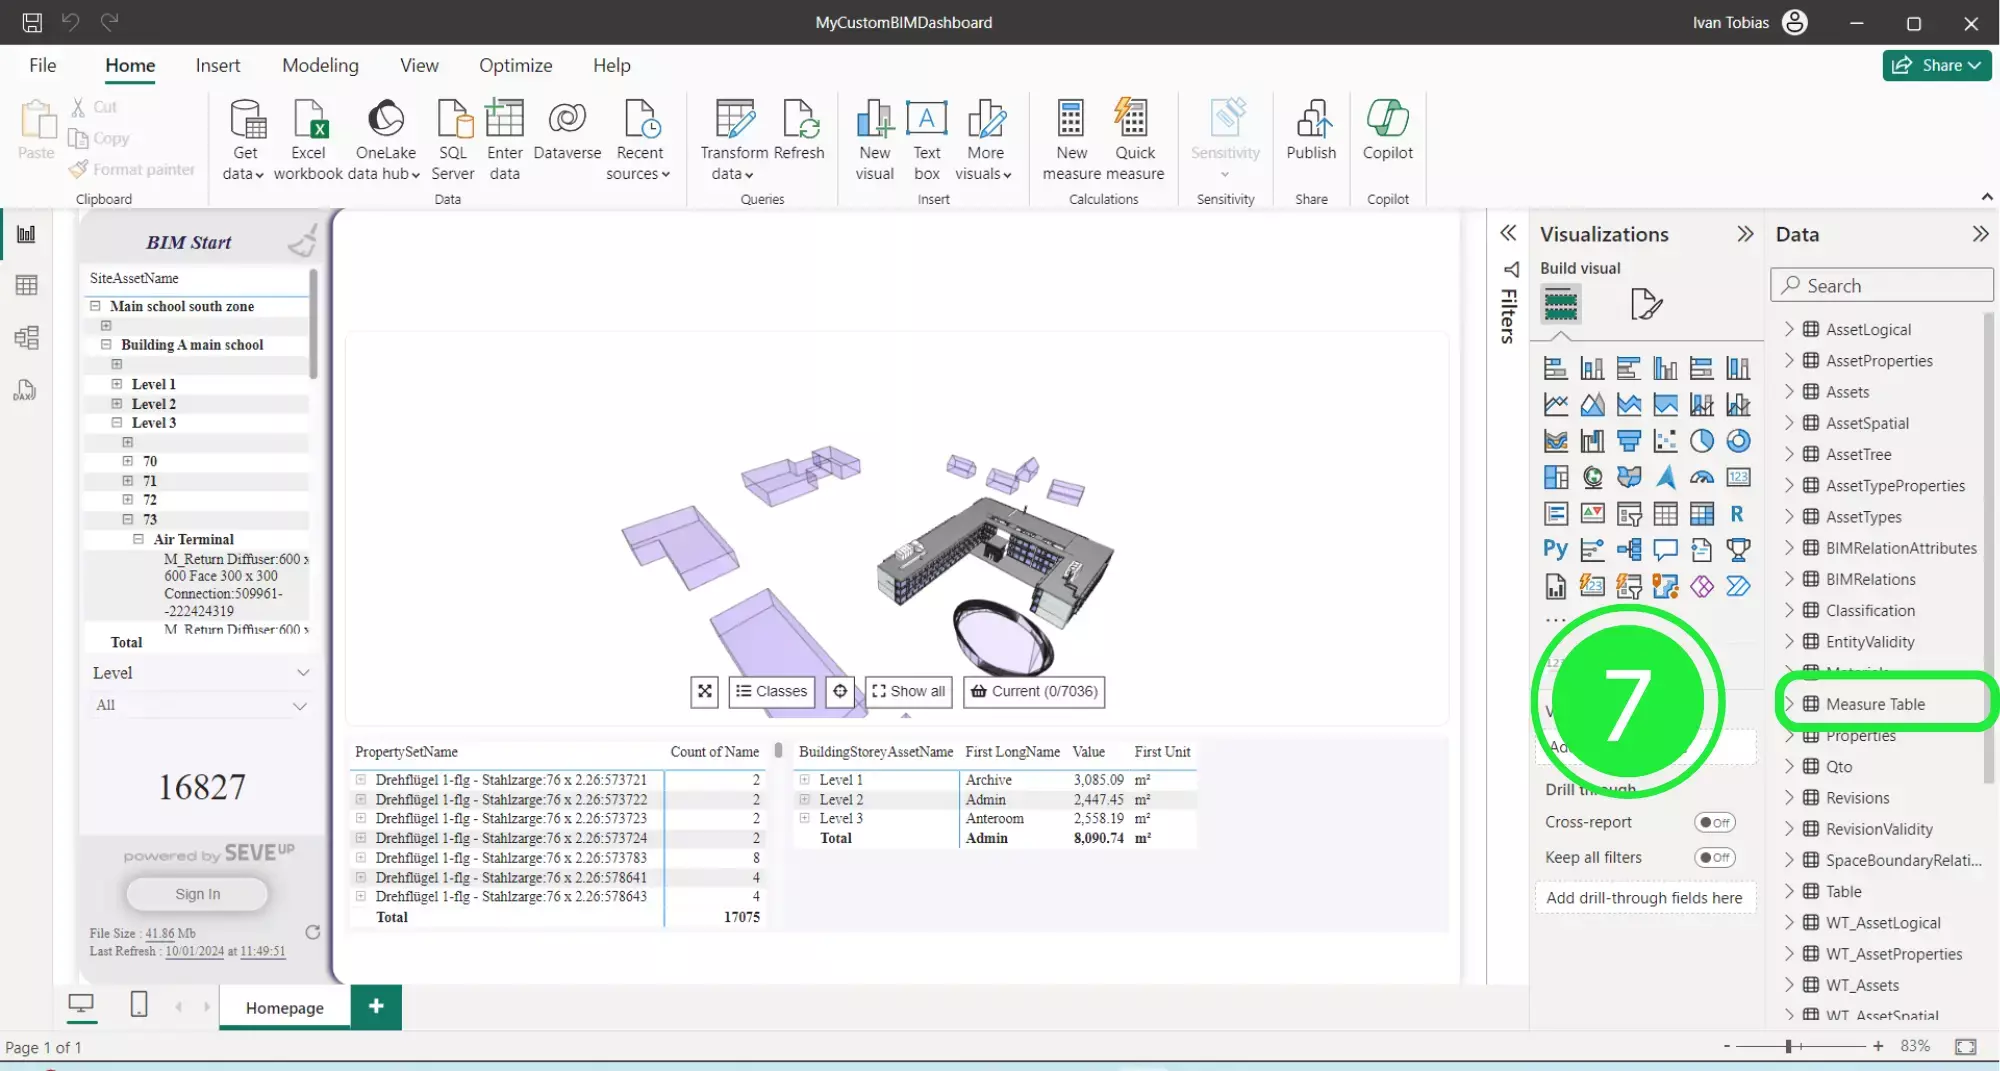
Once you create the table it will appear in the “Data” pane on the right-hand side.
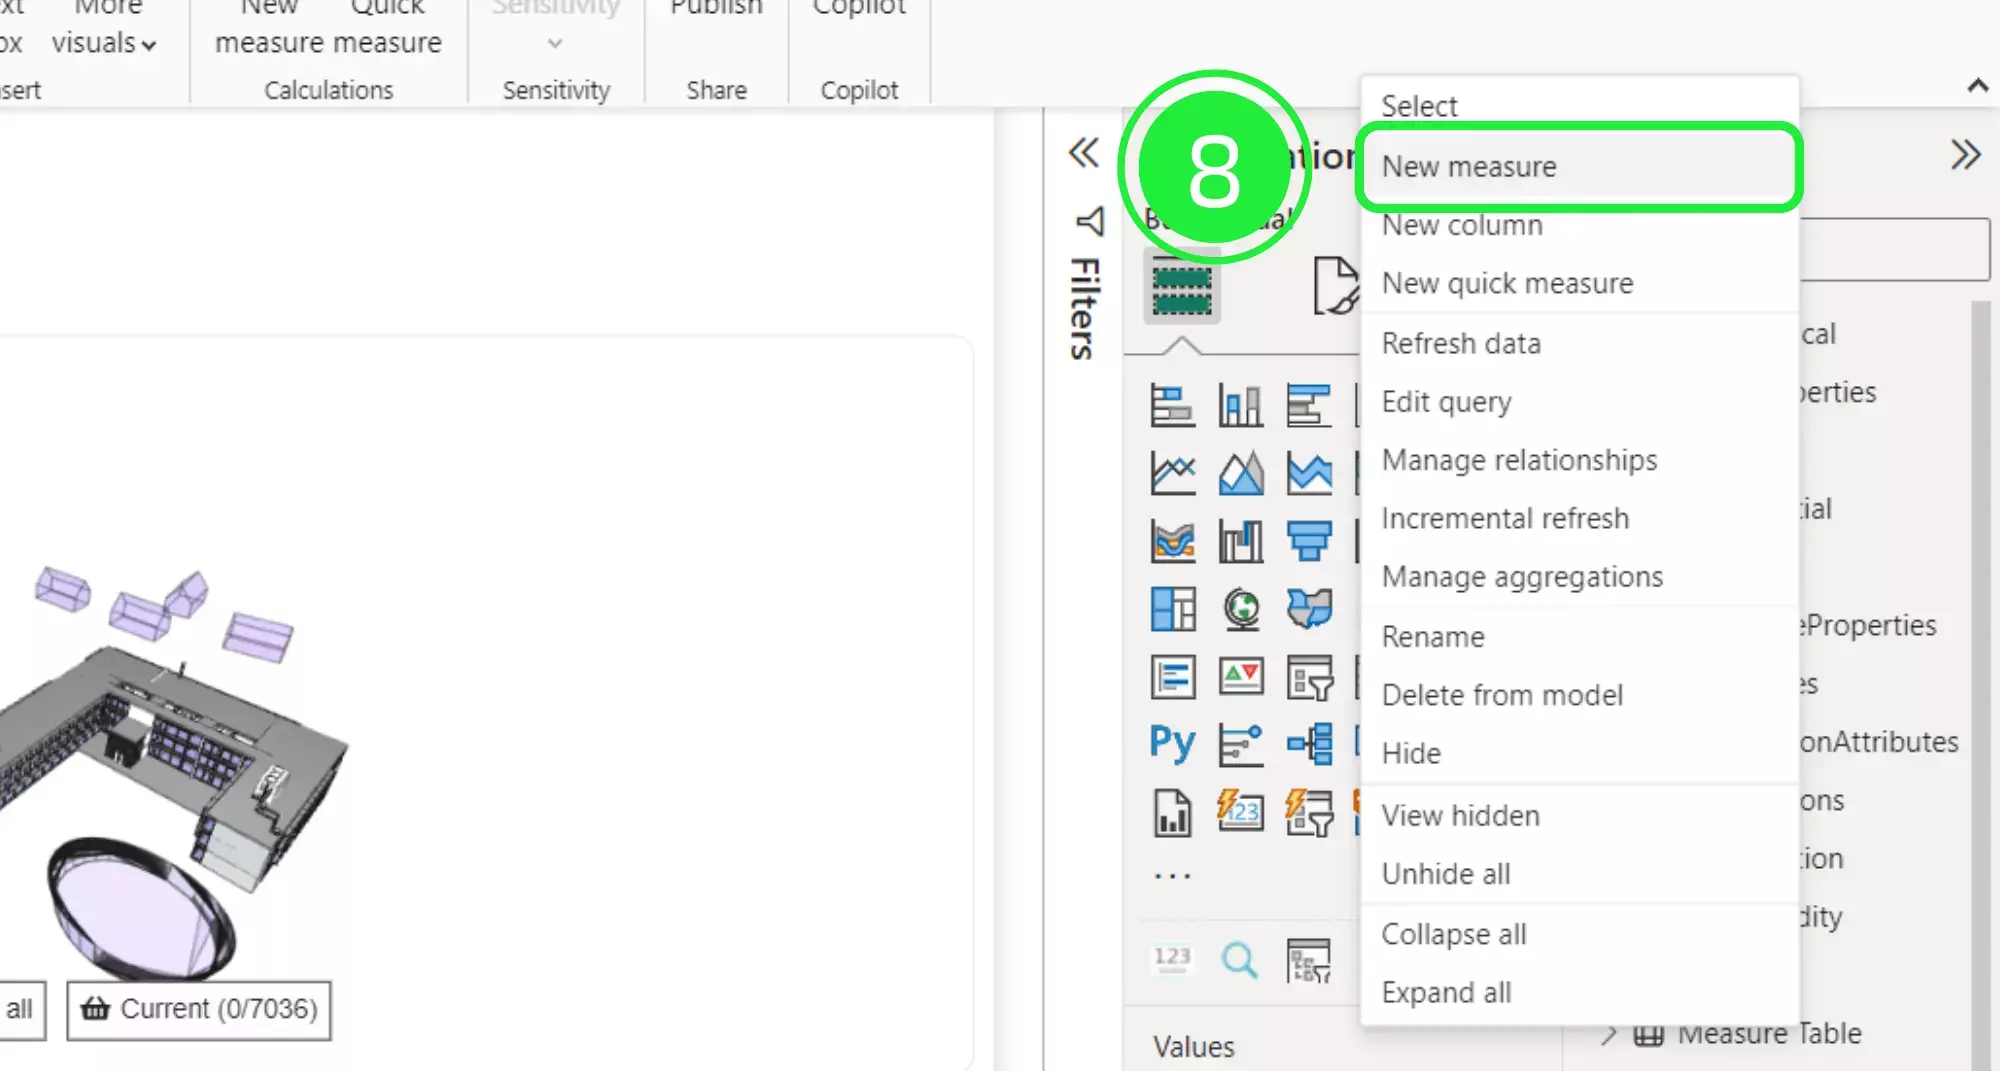
Right-click on it to add a new measure to the table.
Select “New Measure” from the list.
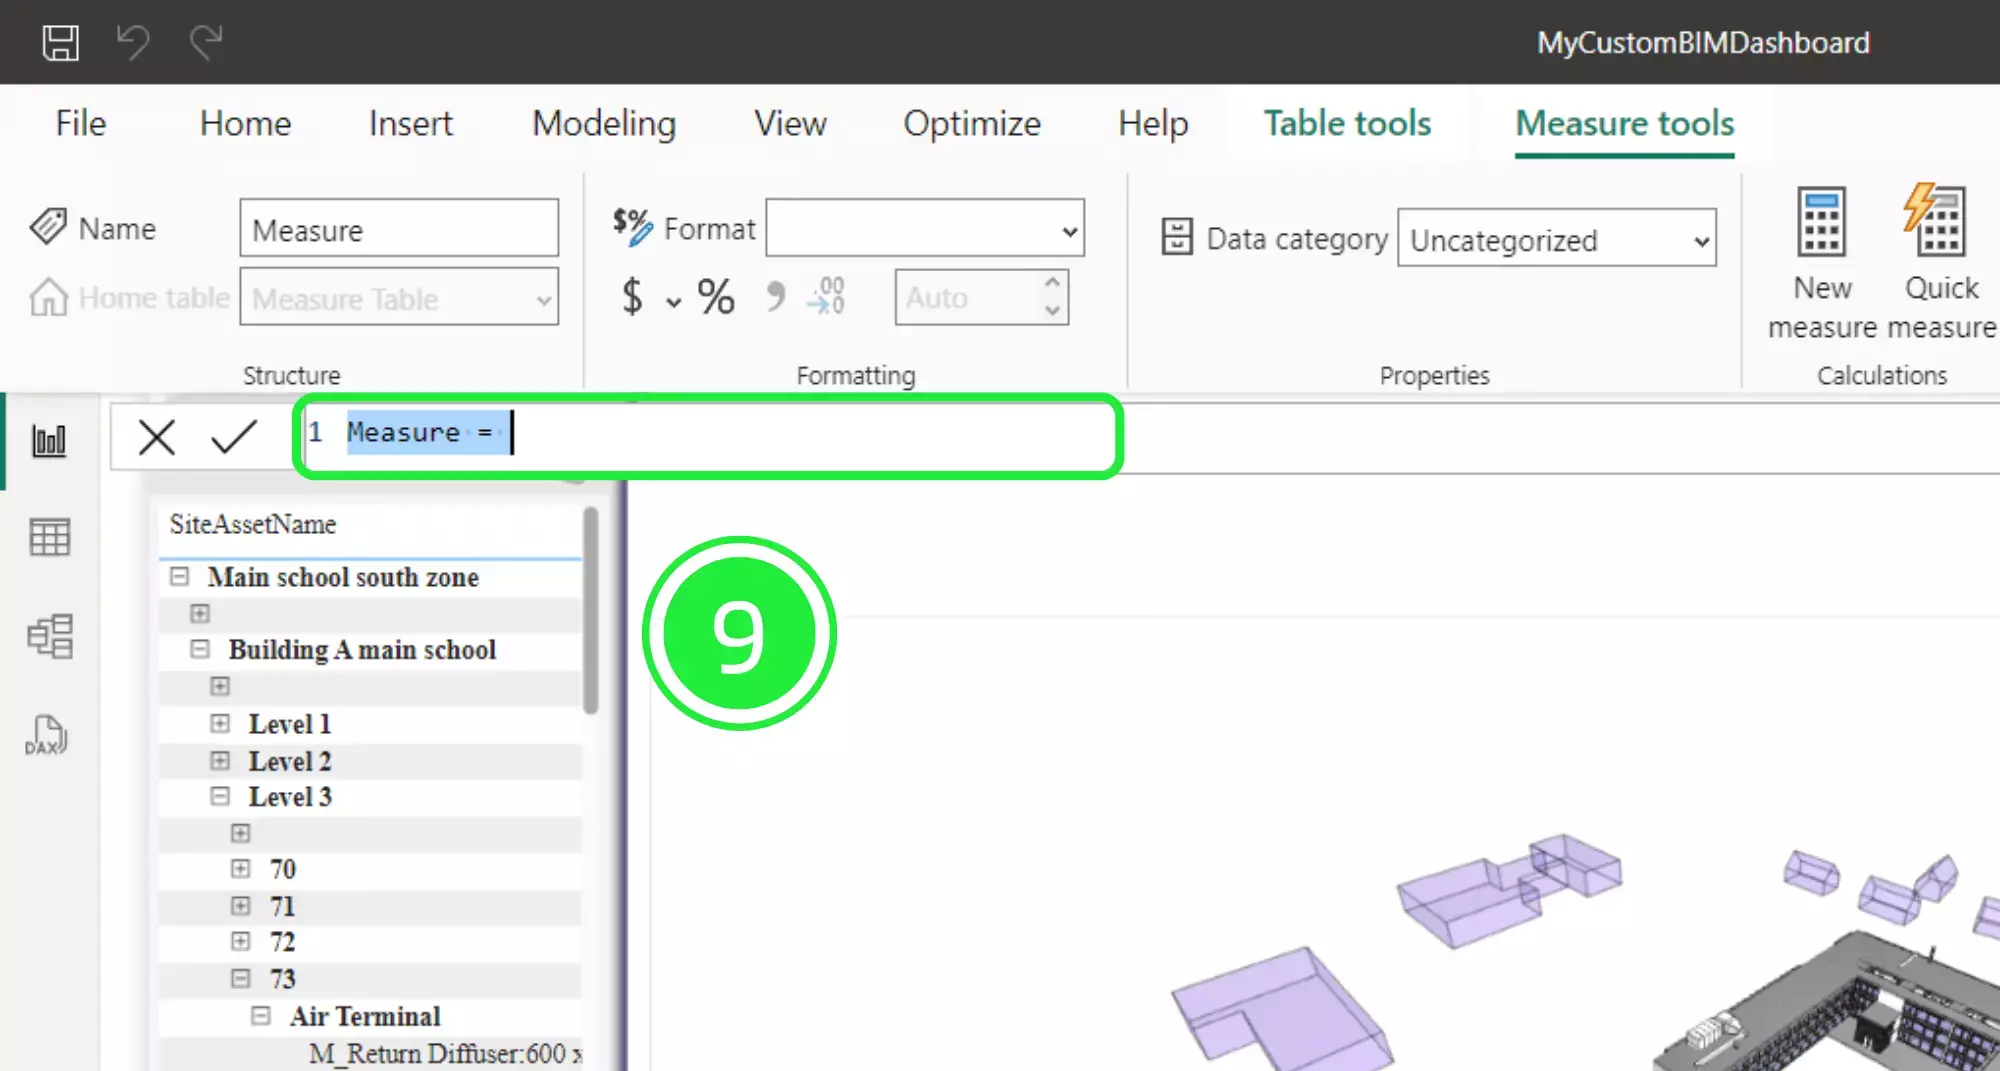
A pop-up will appear at the top of the dashboard for entering the calculation needed to get the final calculation.
You can enter an addition, a subtraction, or any other calculation needed to calculate the measure.
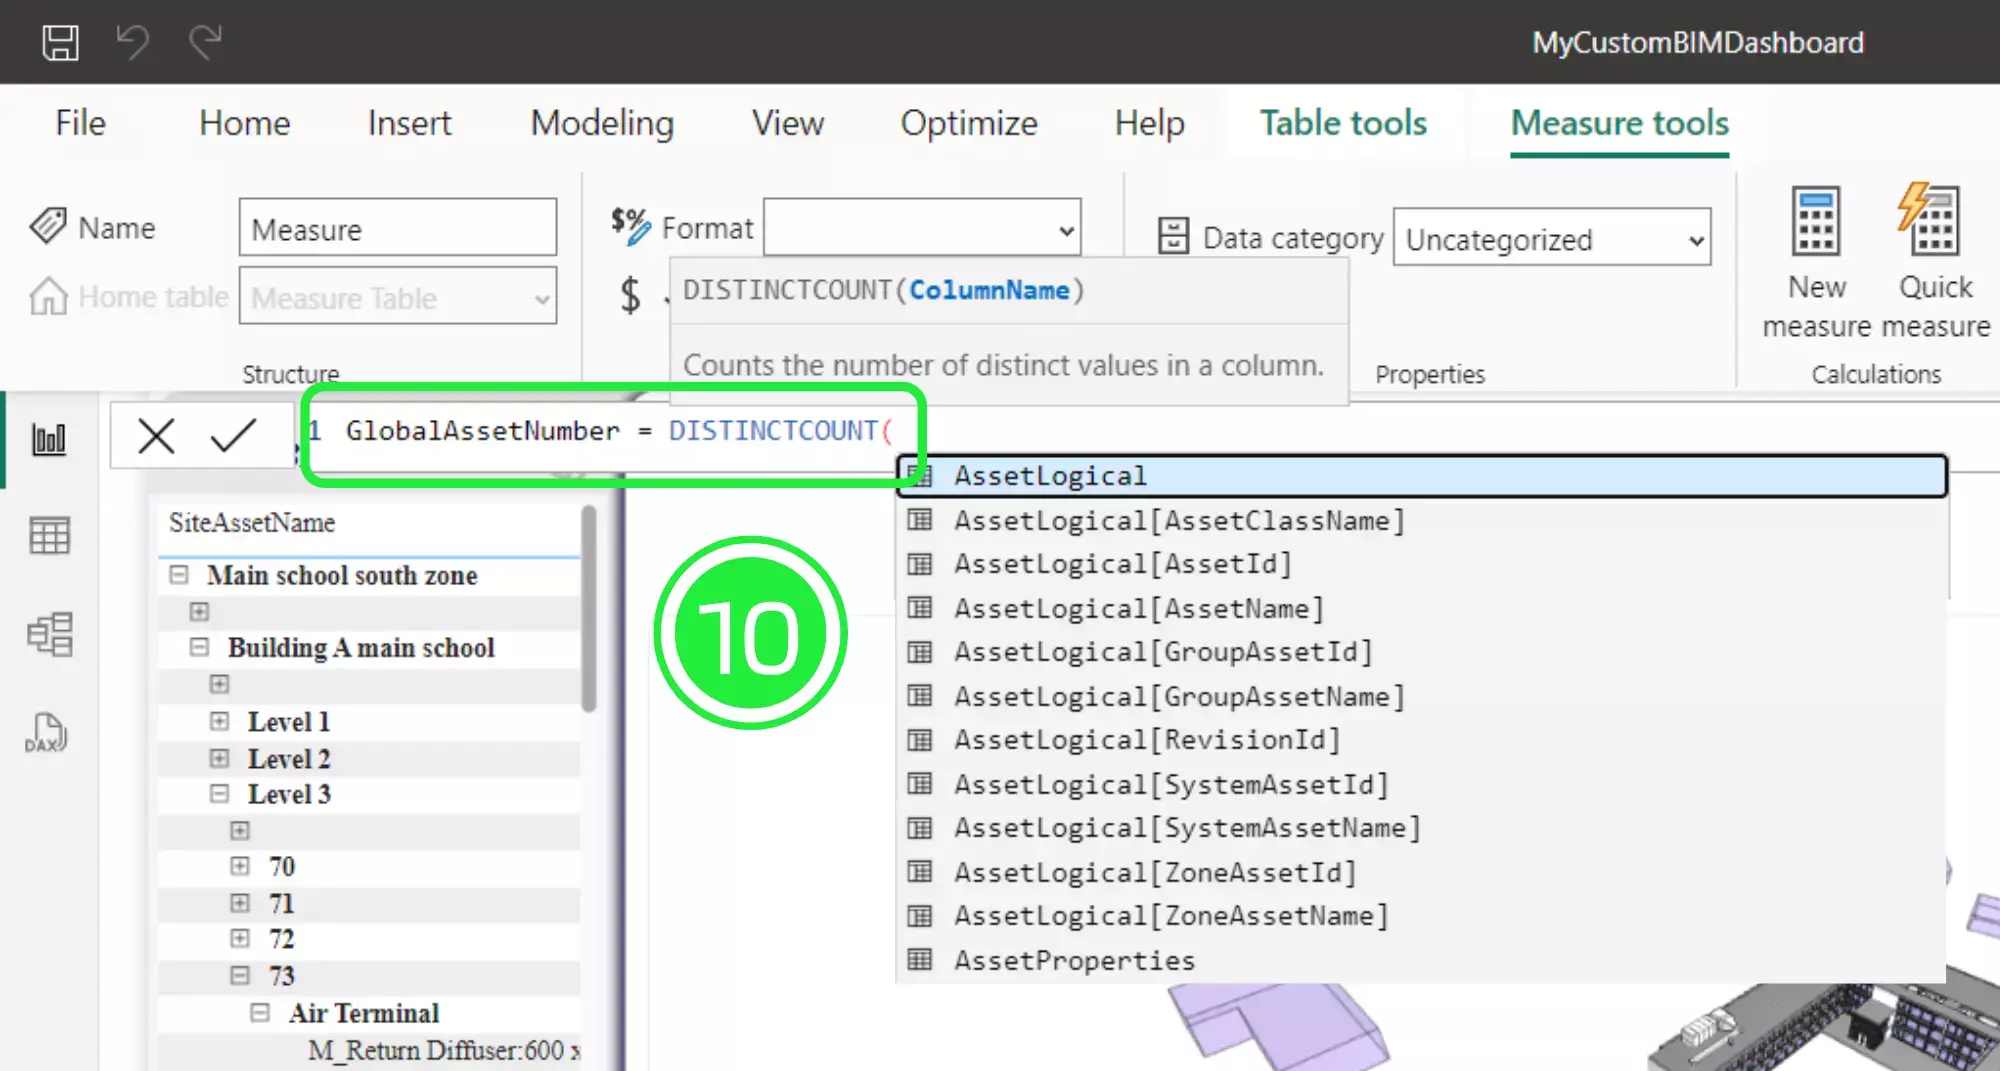
For this measure we will enter “GlobalAssetNumber = DISTINCTCOUNT(WT-Assets[AssetId]. Once the first “(“ is entered a list will pop-up for you to choose from. You can either continue typing or scroll to choose from the list.
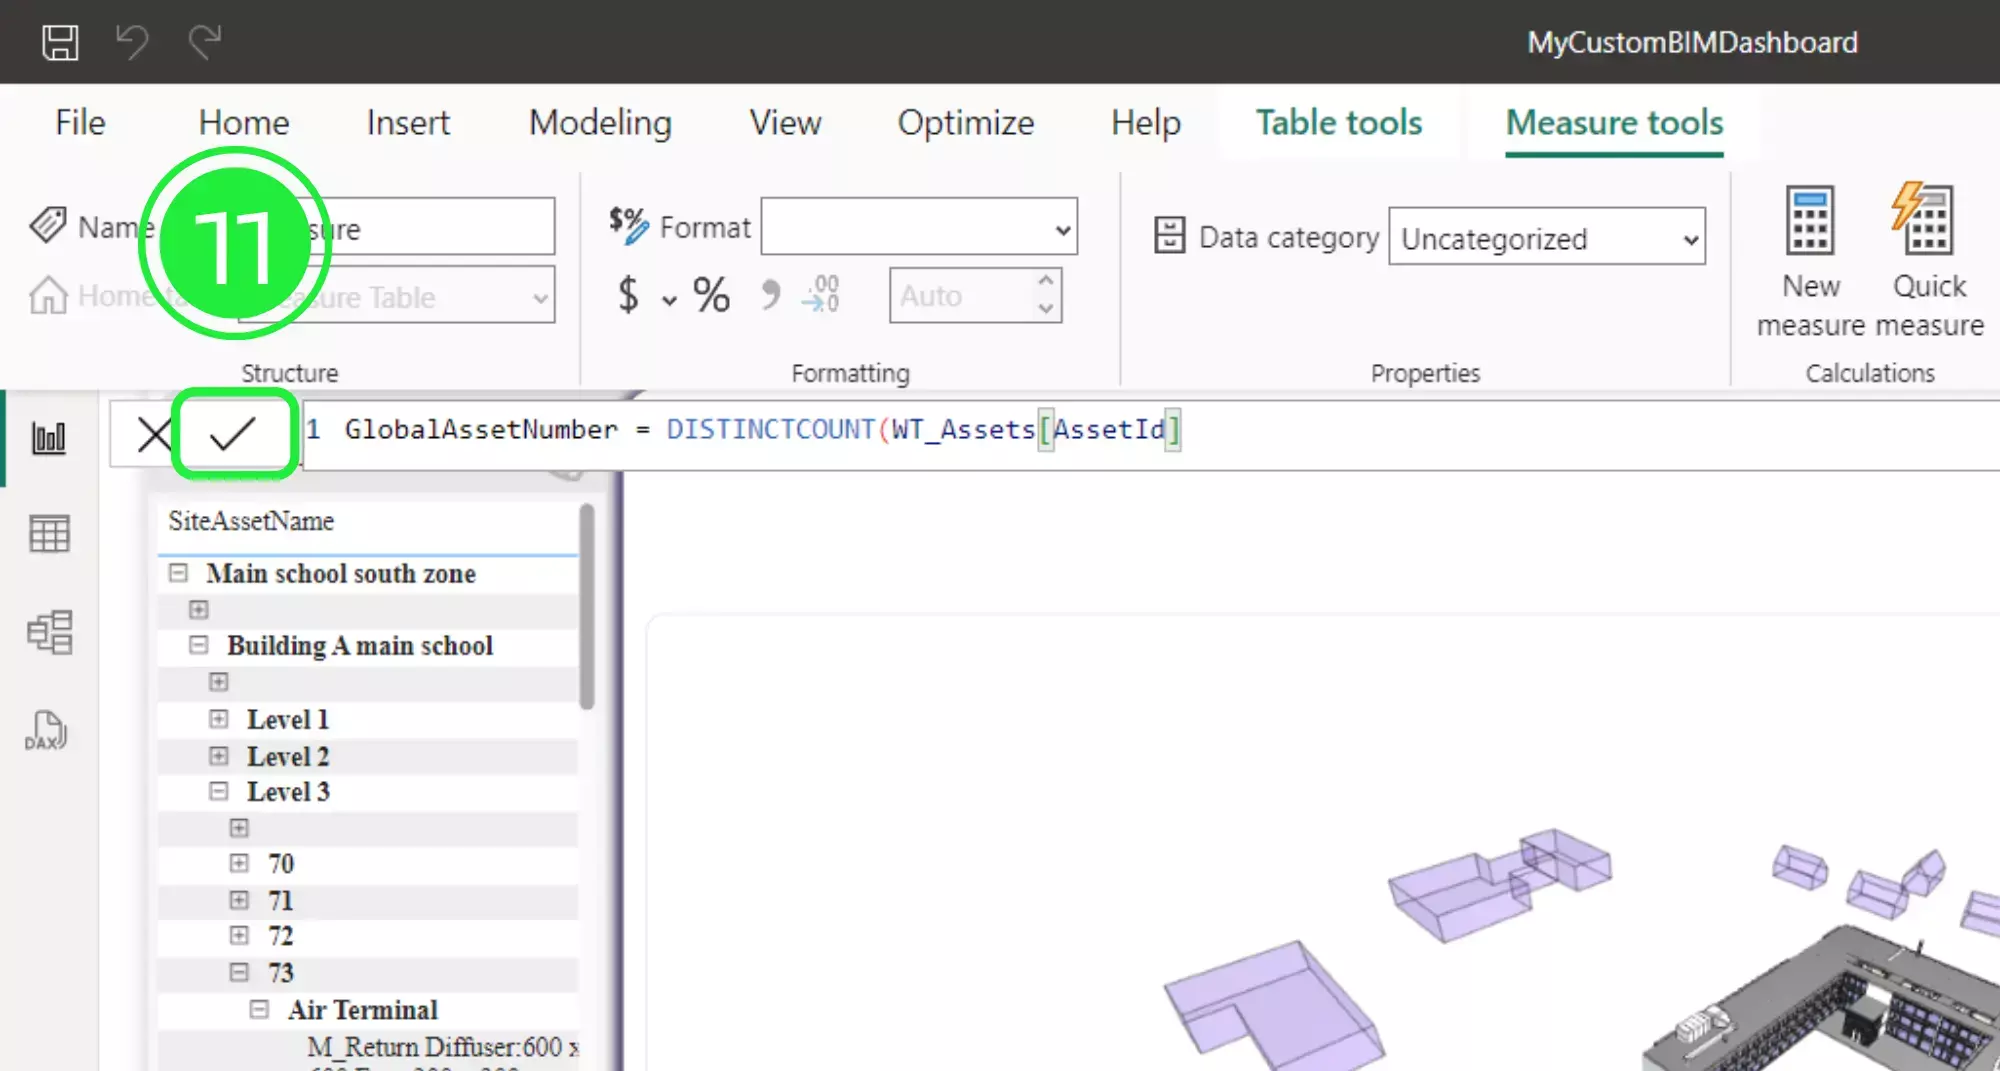
Click on the “✓” to confirm your calculation.
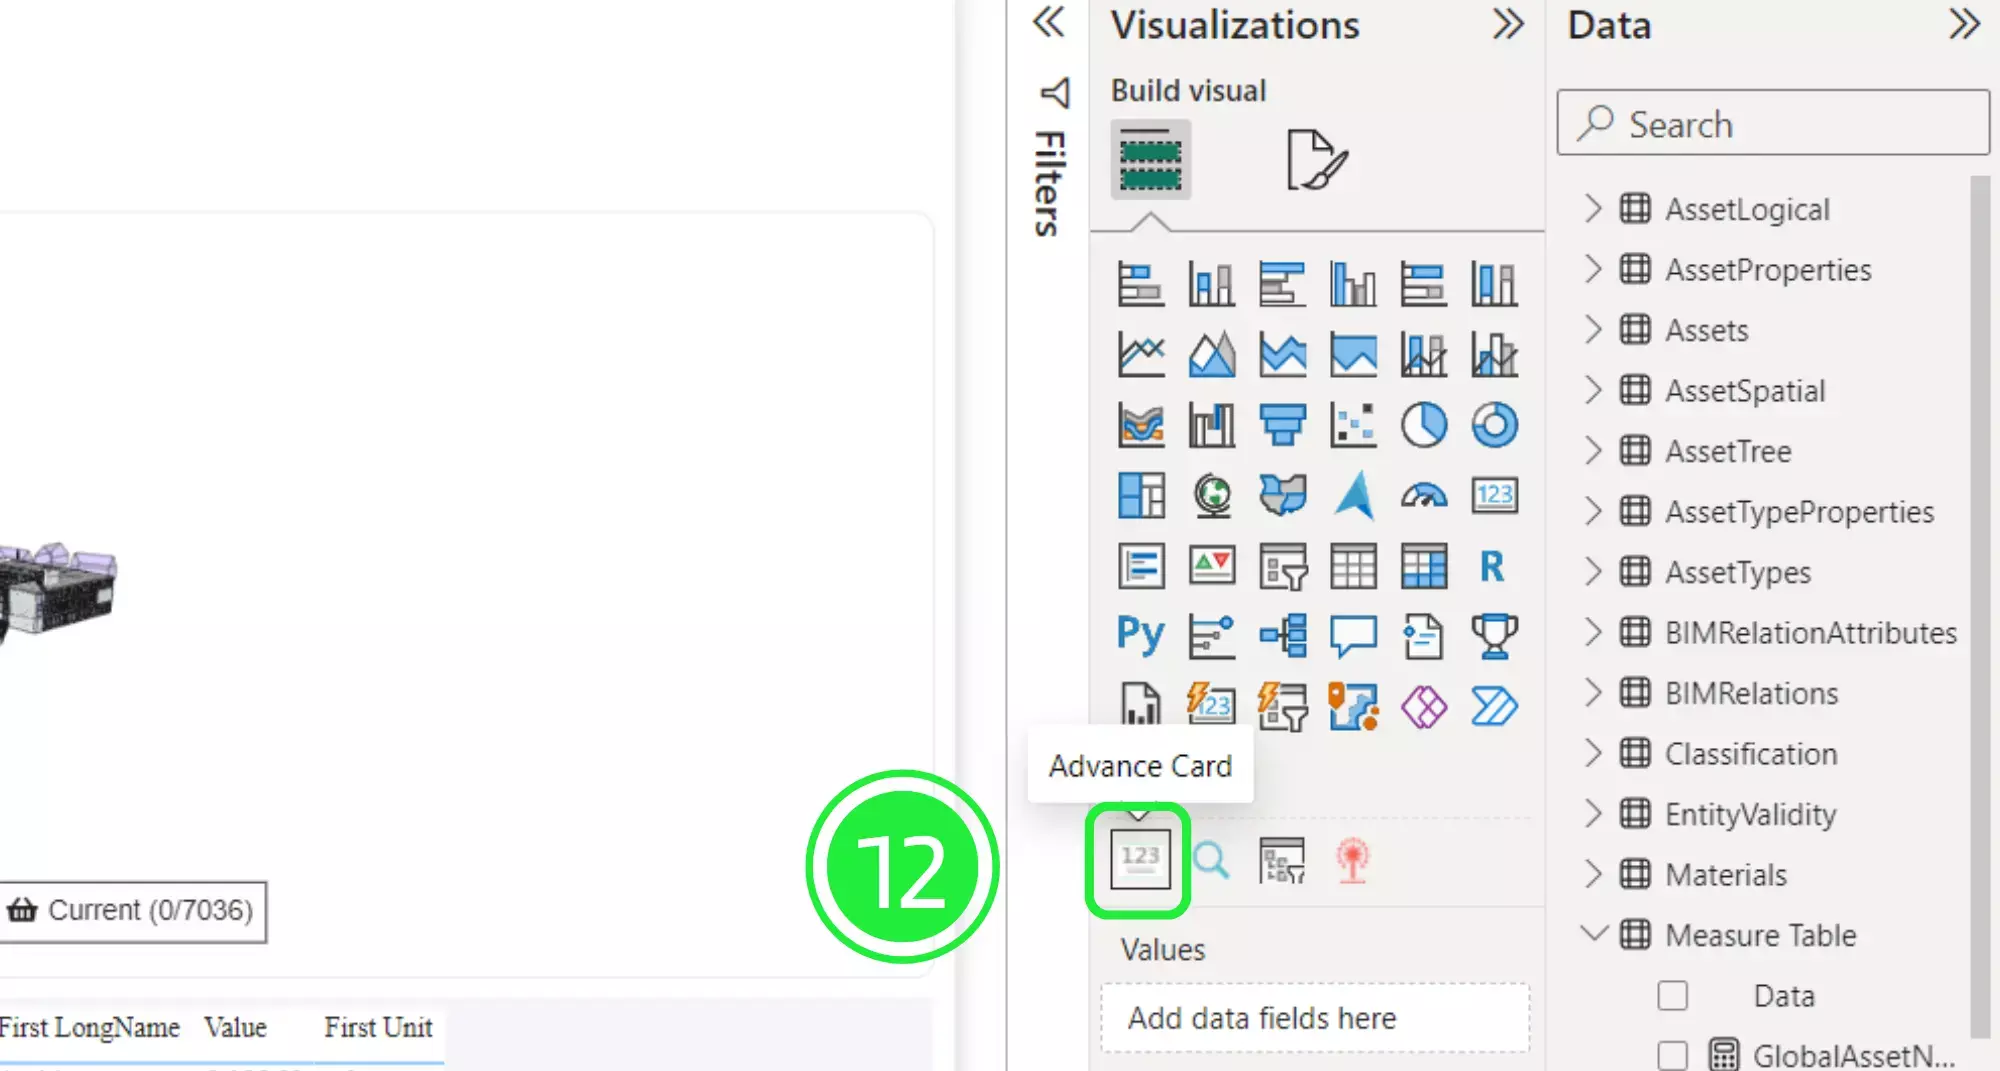
Once it’s loaded you can add a visual to show the measure on your dashboard. Go to the Visualisations pane on the right and click on “Advance Card”.
Move and resize the visual on your dashboard.
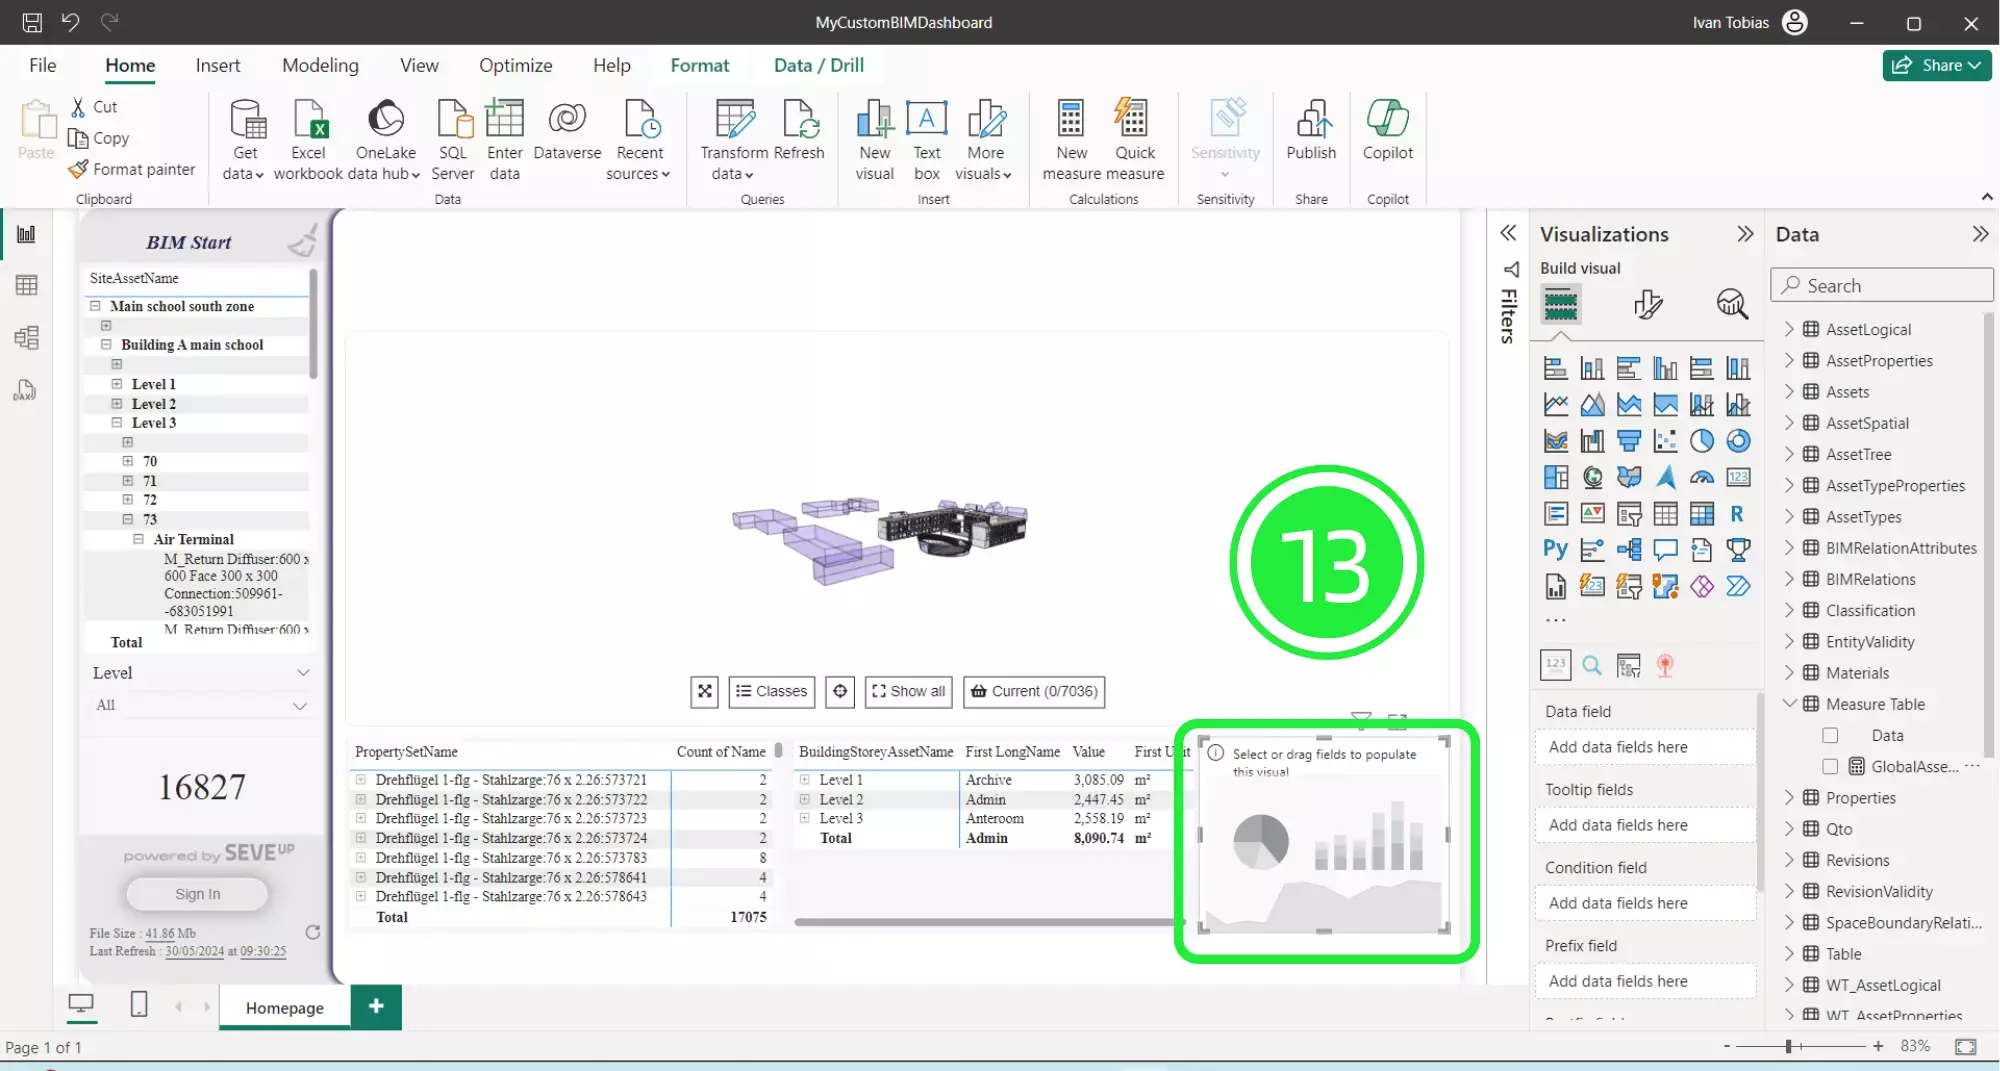
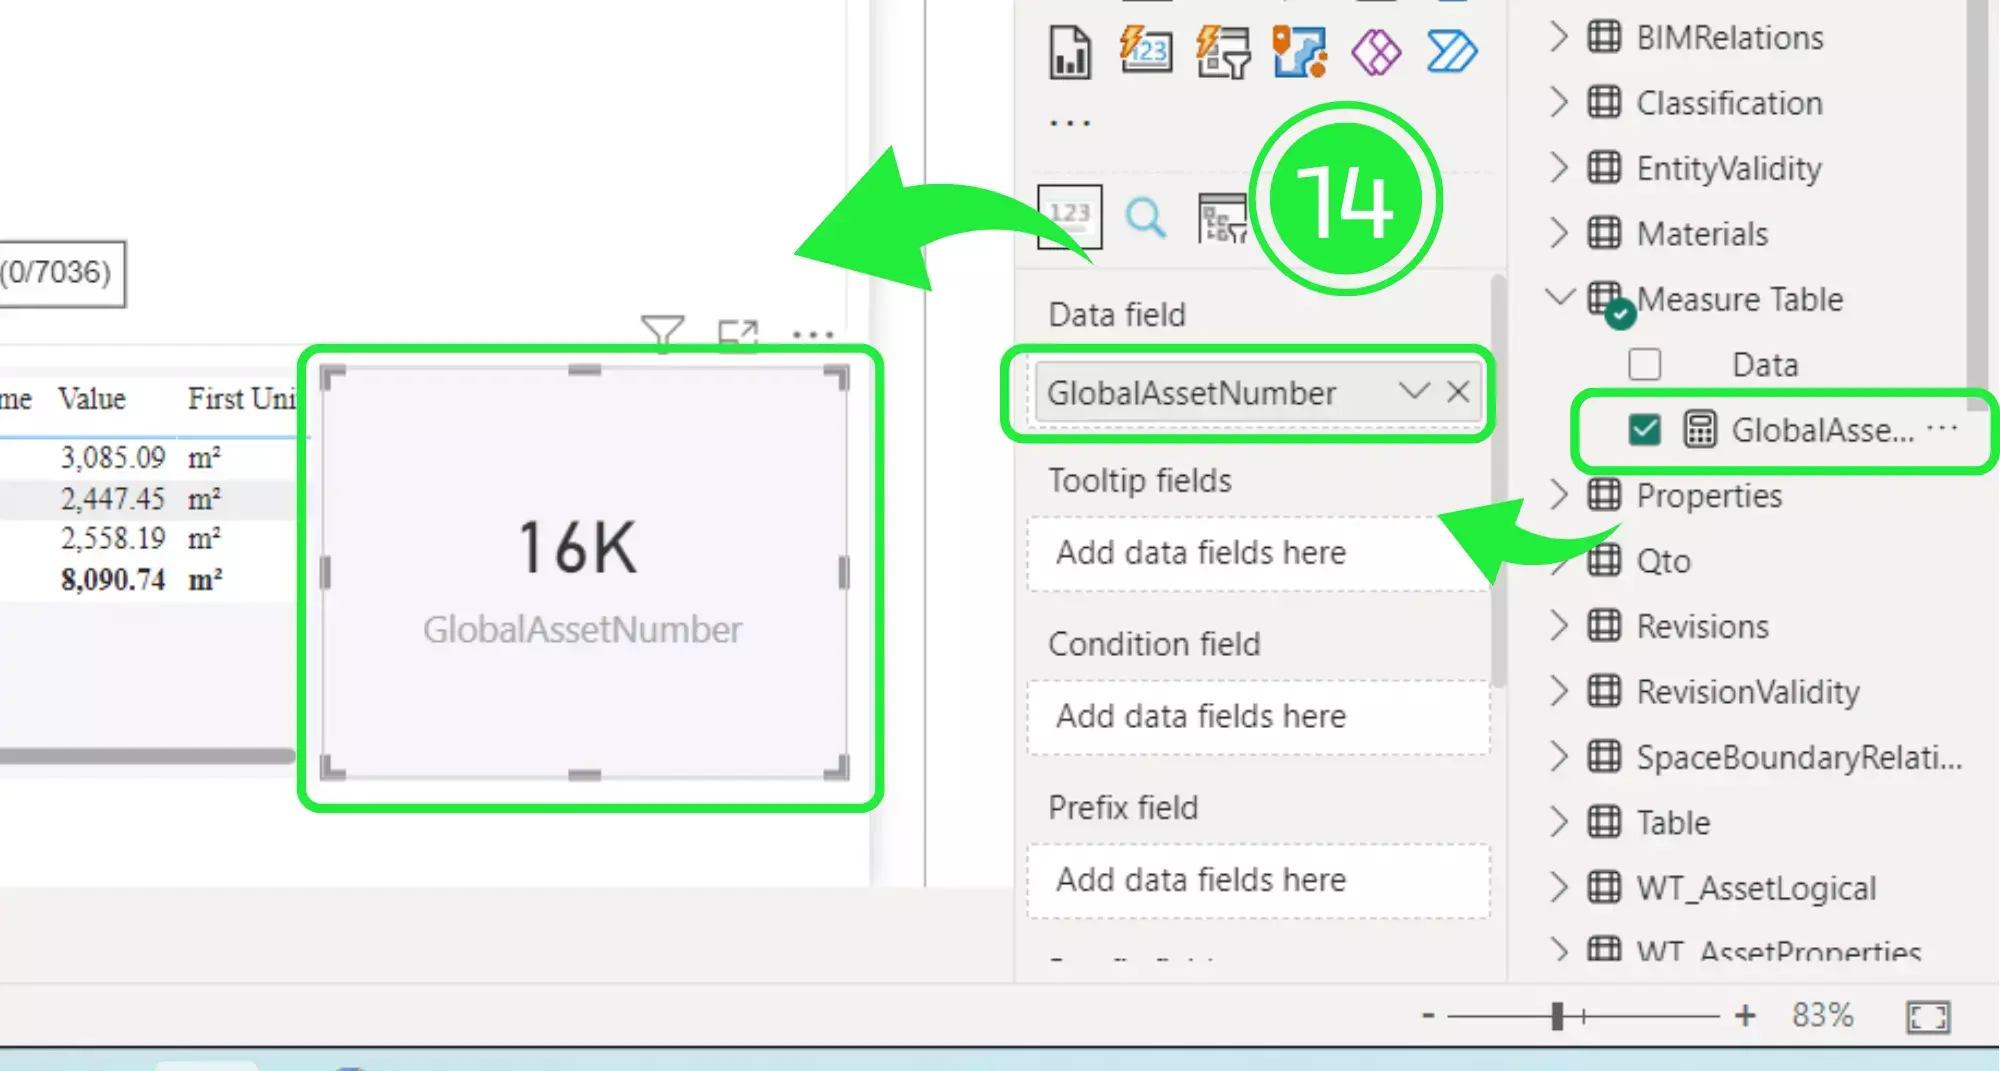
Drag and drop your new measure into the Data field under Visualisations. You will see that the measure amount is now showing in your card visual.
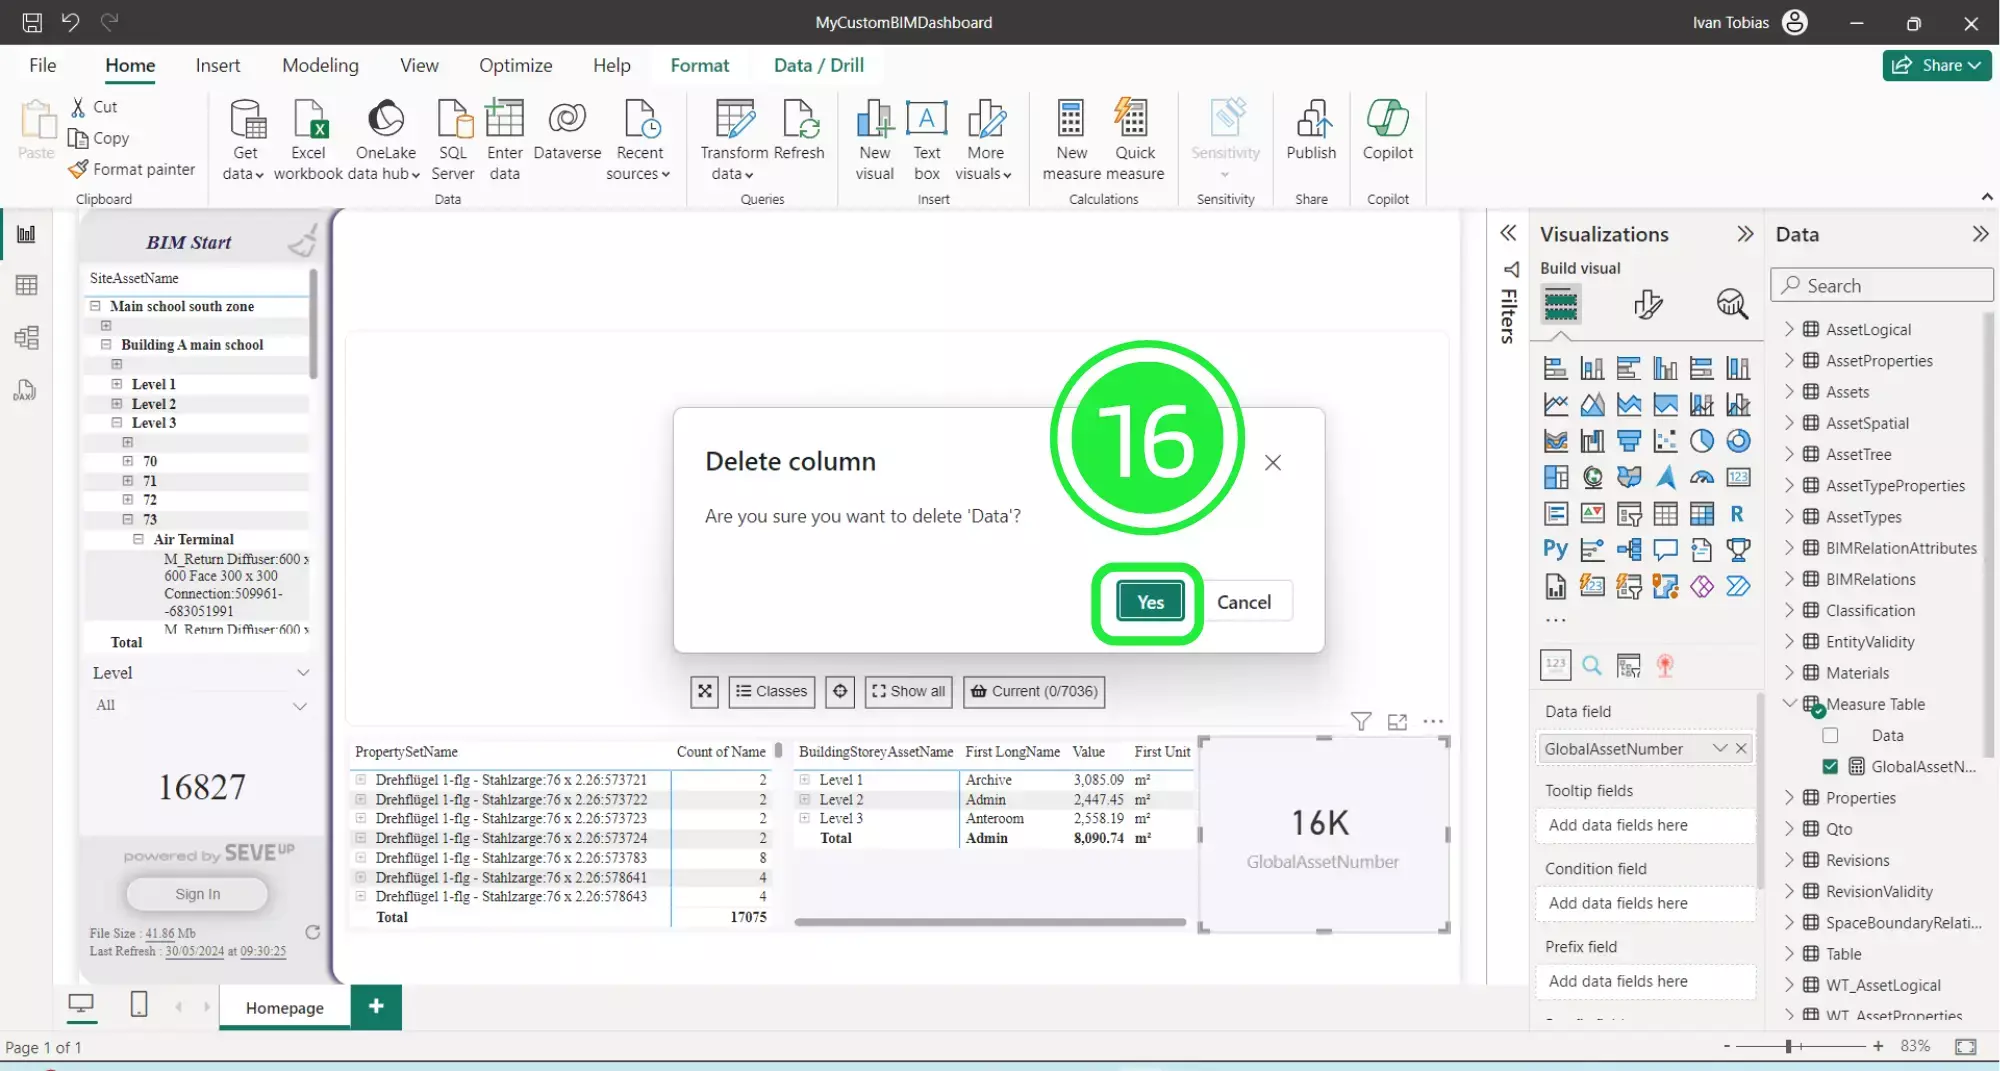
You can delete the first column you created by right-clicking on it and choosing “Delete from model”.
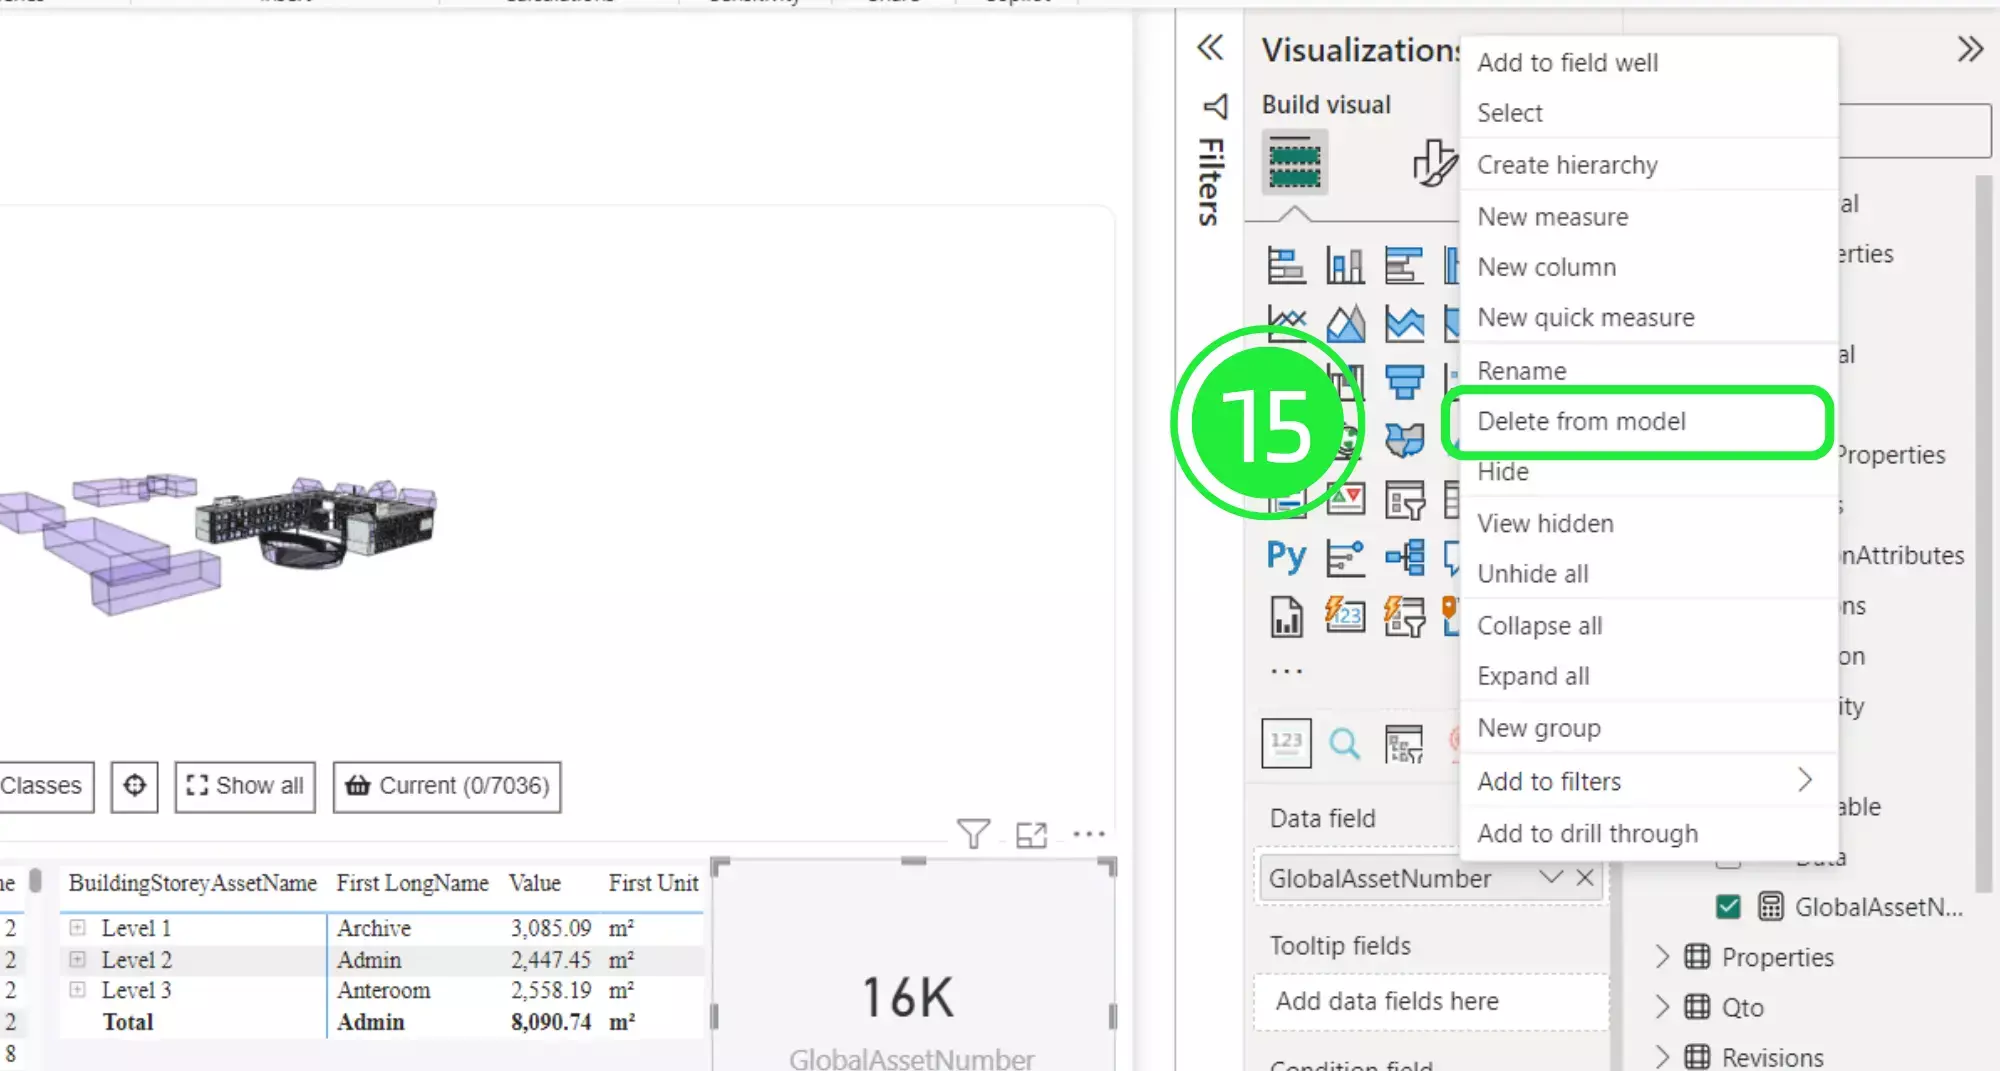
Finally, confirm the deletion by clicking on “Yes”. This will delete the first column, leaving only the GlobalAssetNumber column.
By following this tutorial, you have taken a significant step towards enhancing the organisation and accessibility of your measures in Power BI. Creating and managing measure tables not only simplifies your data management but also contributes to more efficient and accurate data analysis. At SeveUp, we are committed to providing you with the tools and knowledge needed to optimise your Building Information Modeling (BIM) processes.
Next step : Want to get started with your very own BIM project? You’ll be surprised by just how easy it is. Create your own free account is SeveUp today and give it a try.
Learn how to automate your BIM model checks and get certified.


🎓 Free BIM Checker Training Learn how to automate your BIM model checks and get certified. Register for Free Click
Learn More🎓 Free BIM Checker Training Learn how to automate your BIM model checks and get certified. Register for Free Click
Learn More🎓 Free BIM Checker Training Learn how to automate your BIM model checks and get certified. Register for Free Choose
Learn More