Trusted by companies
all over the world:
This tutorial will guide you in exploring the powerful capabilities of Power BI in conjunction with the SeveUp App BIM dataset. Our tutorial focuses on a fundamental aspect of BIM analysis: optimizing the space area by level with SeveUp BIM data.
As professionals in the architecture, engineering, and construction industries, having a comprehensive understanding of the properties within our BIM models is essential for informed decision-making and efficient project management. With the seamless integration of SeveUp and Power BI, we have the tools to extract valuable insights from our BIM data with ease.
Whether you're a seasoned BIM practitioner or new to the world of data analysis, this tutorial is designed to equip you with the knowledge and skills to unlock the full potential of your BIM data and drive efficiency in your projects.
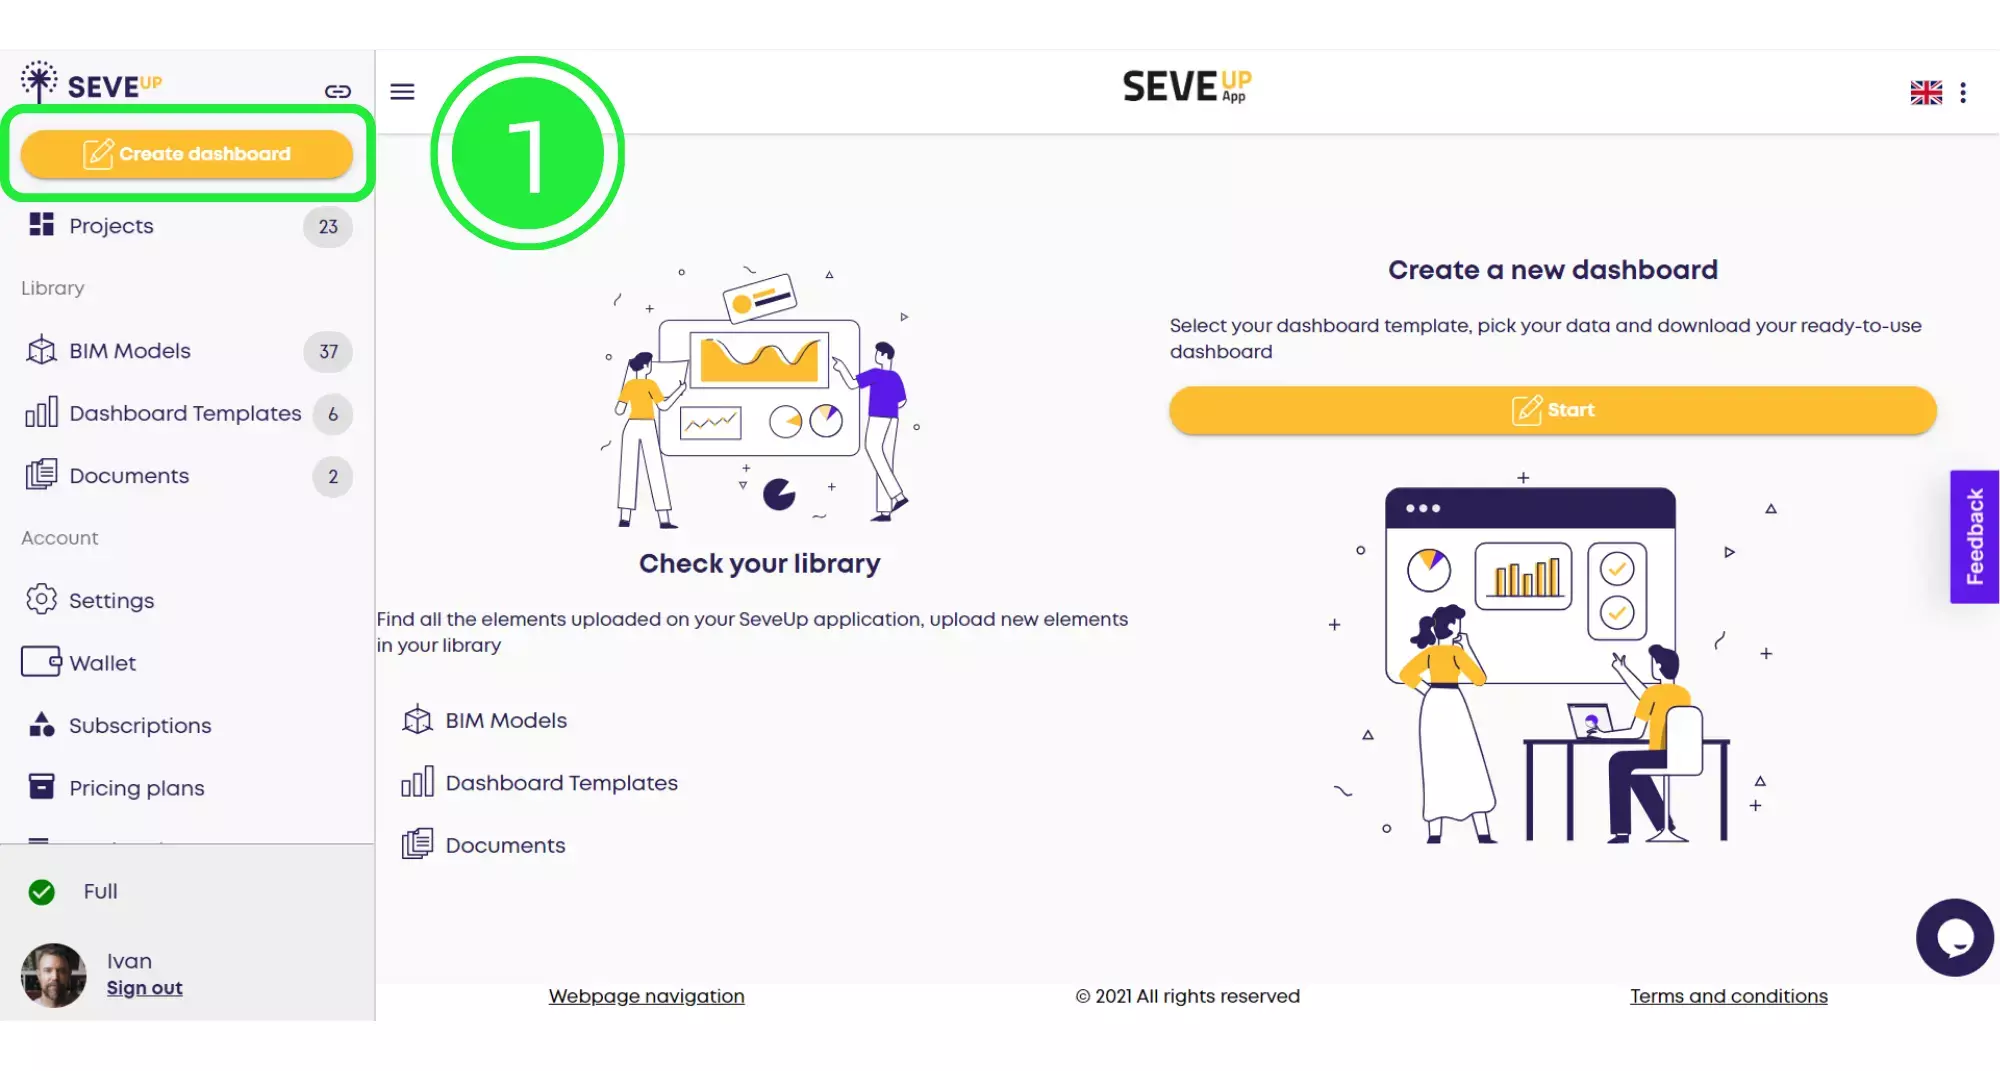
At this end of the tutorial you will know how to condense space Area Optimization by Level with SeveUp BIM Data. Start off by logging in to your SeveUp App account and then click on the “Create Dashboard” button.
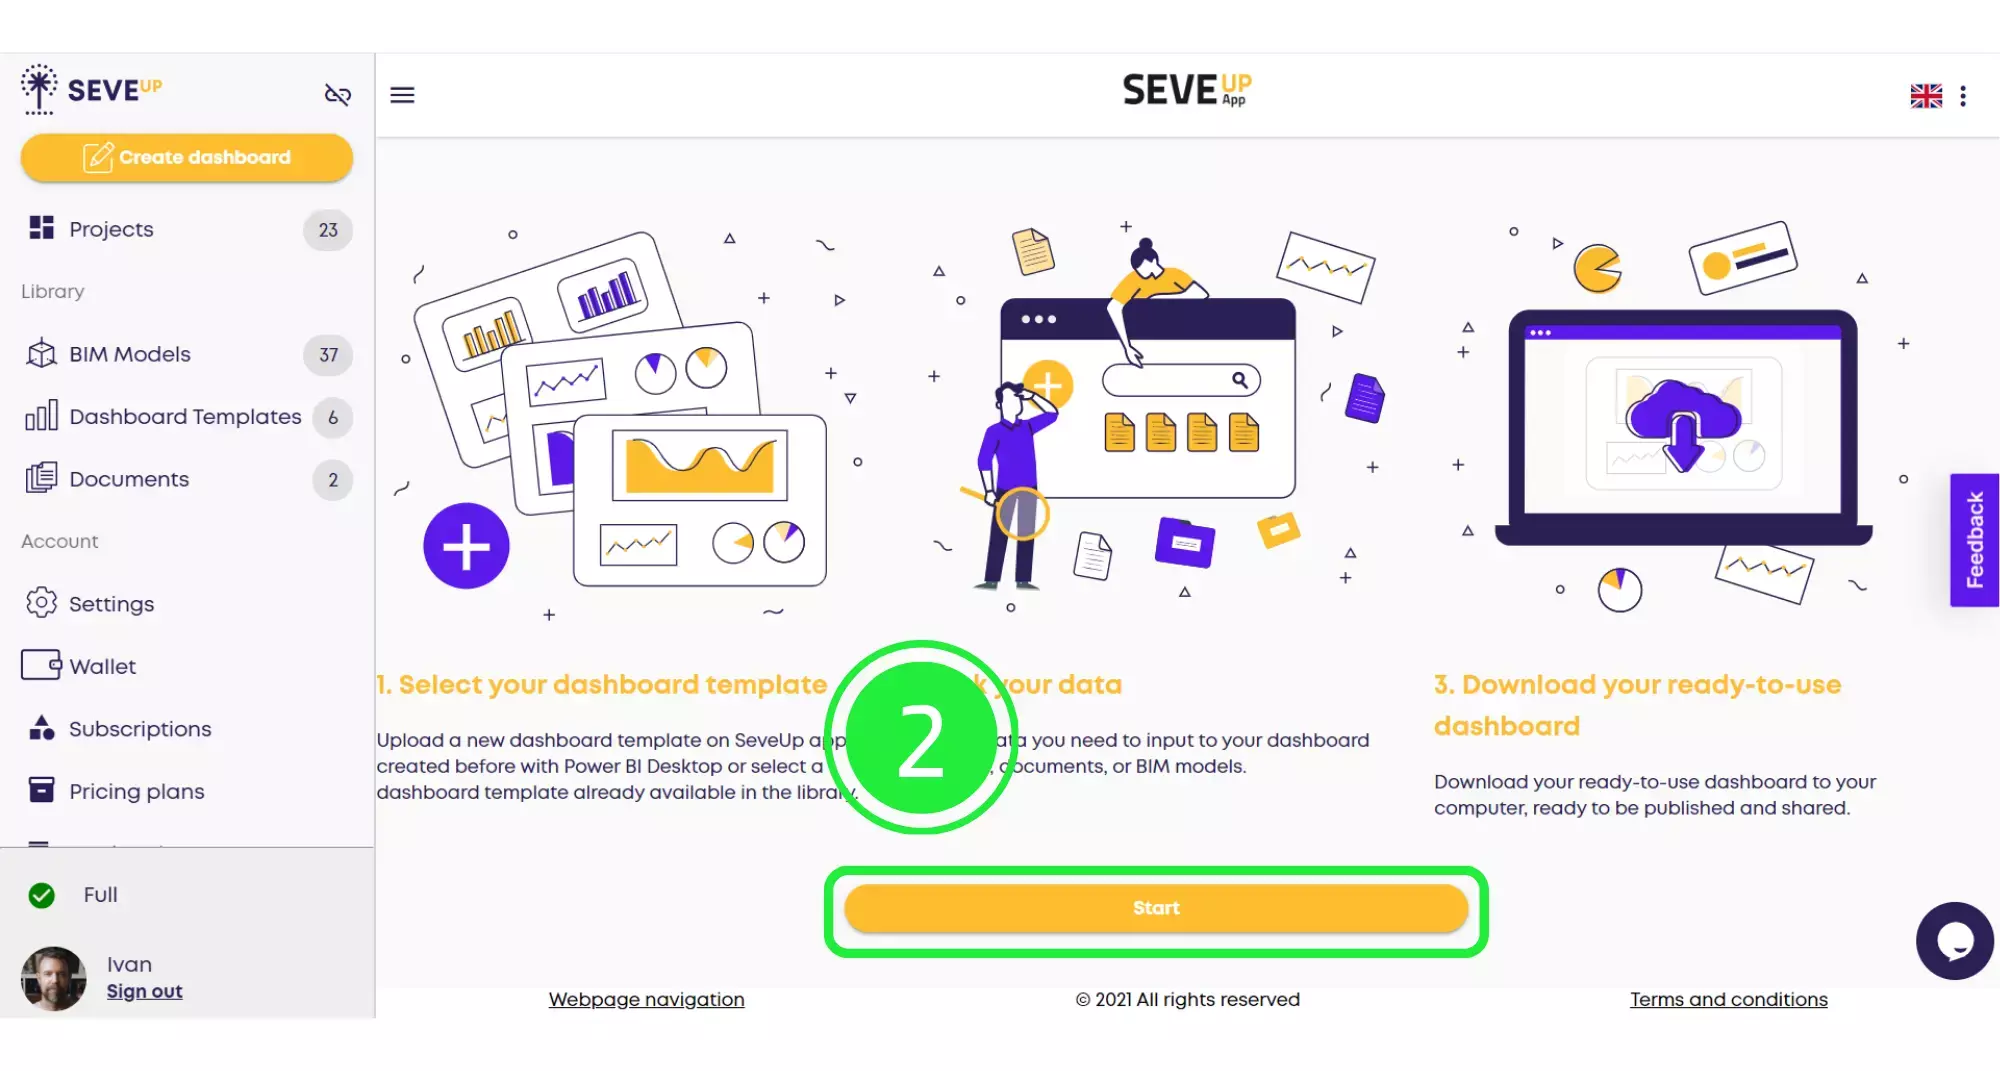
In the centre of the tutorial page you’ll find the “Start” button. Click on that to start creating your new dashboard.
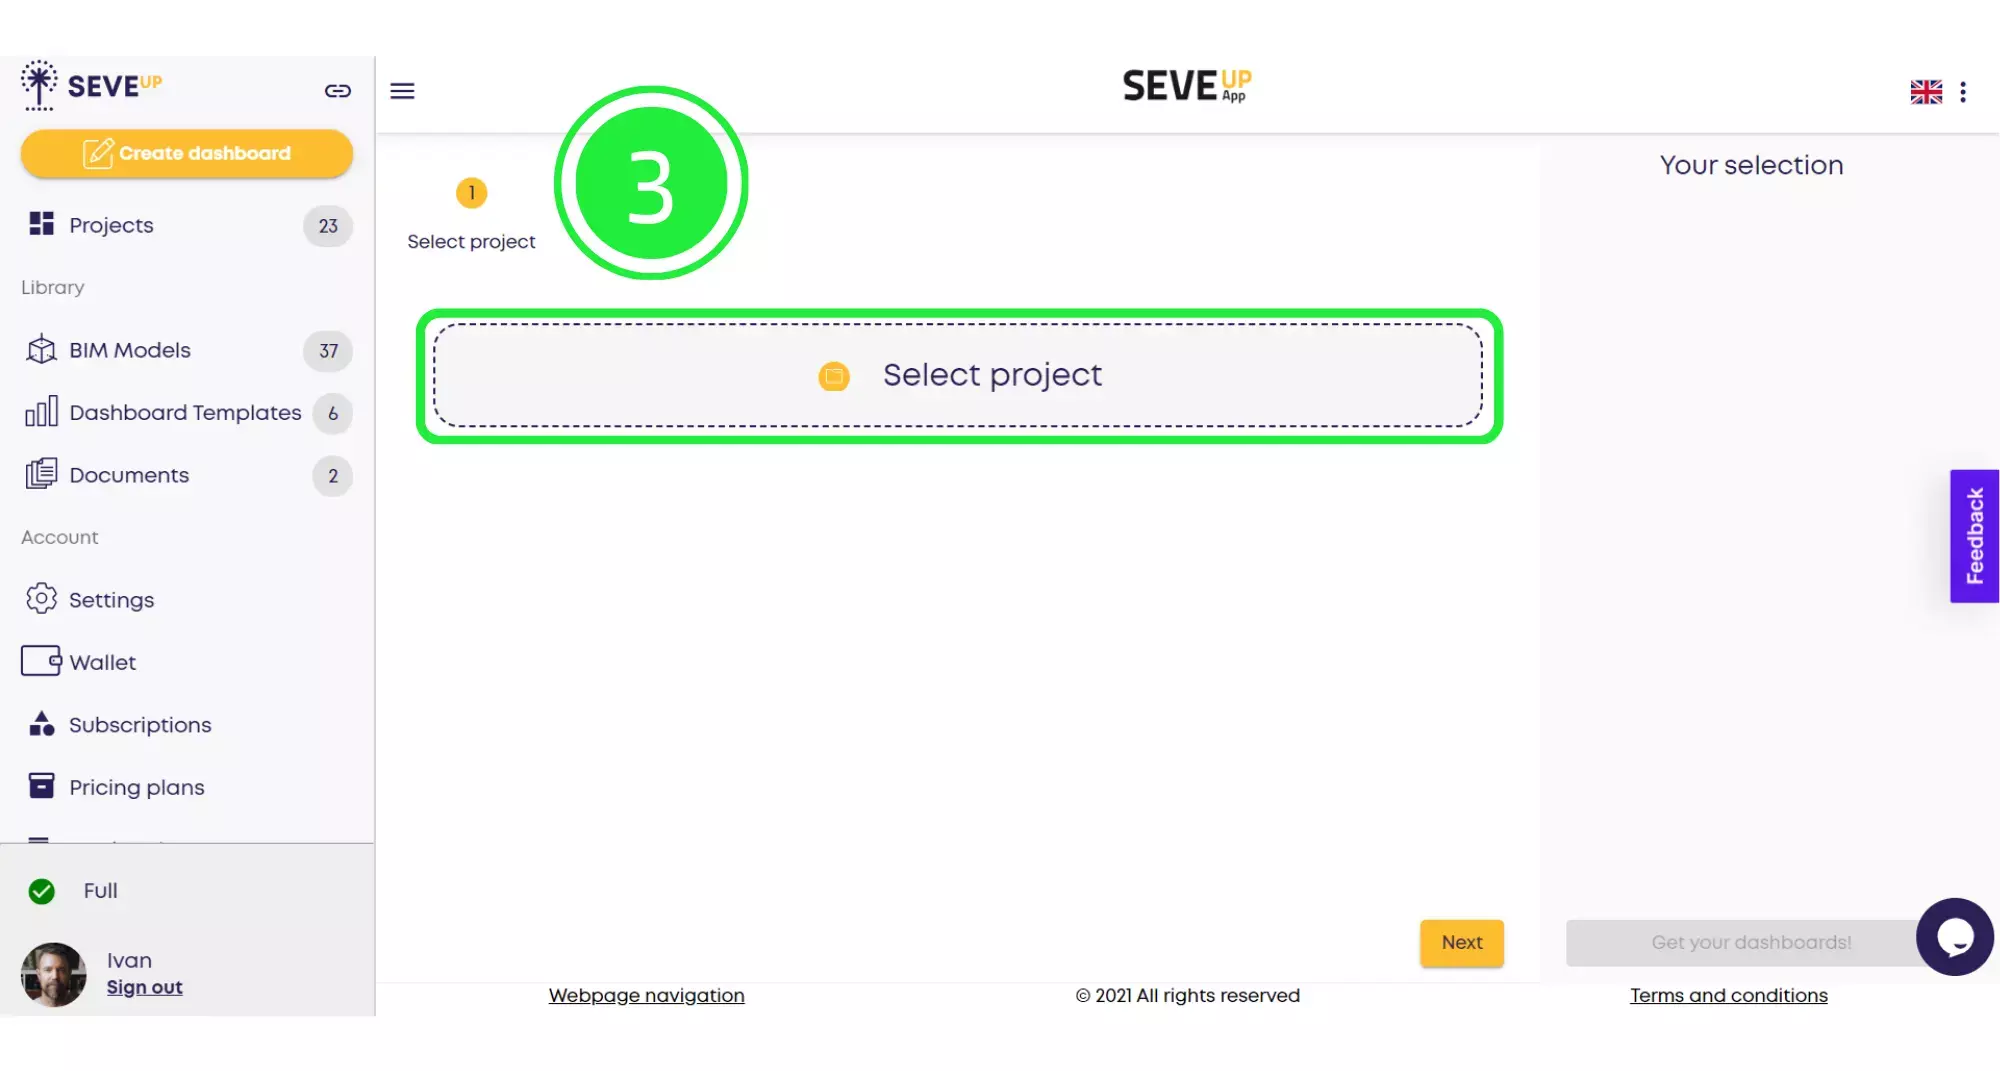
At the top of the page, you’ll see the wizard is now showing your progress. Click on the large “Select Project” button in the centre.
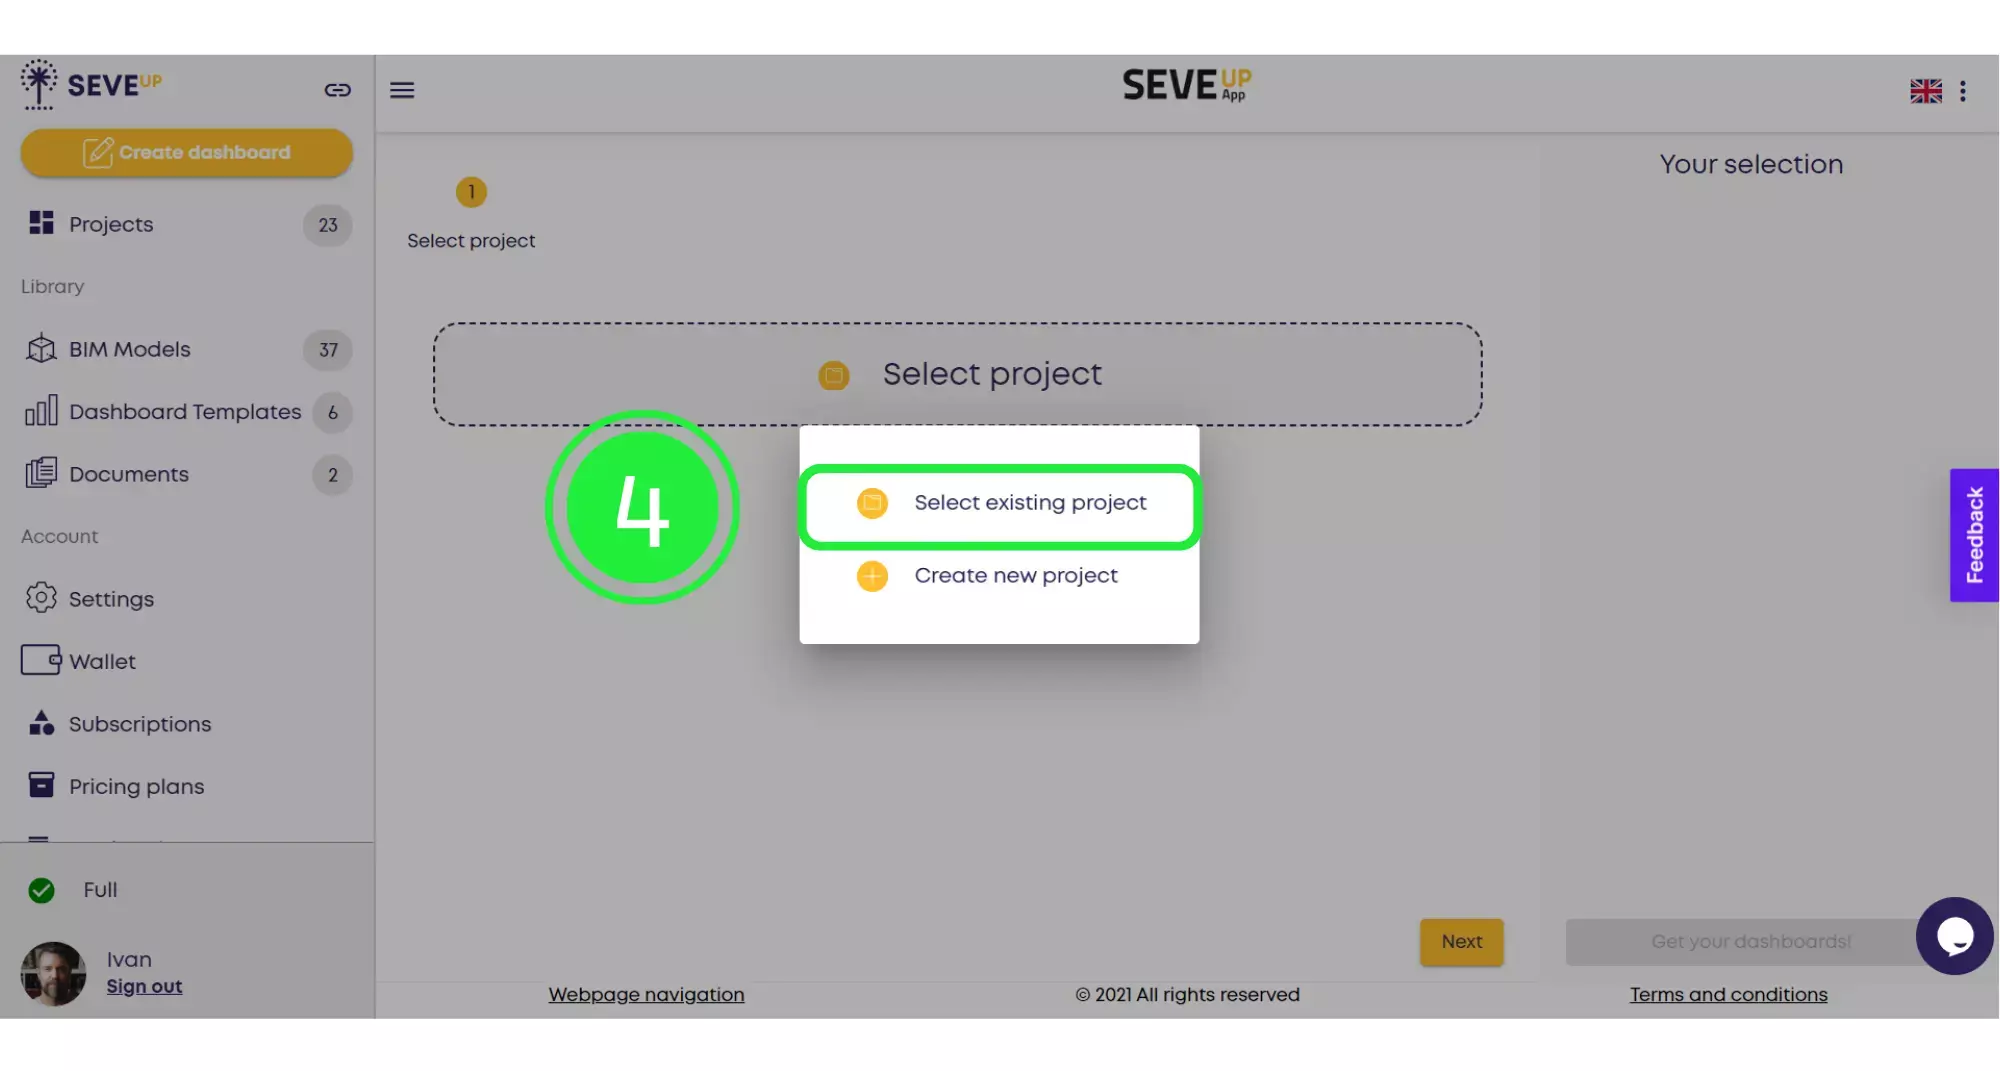
A popup will appear, allowing you to choose whether to select an existing project or create a new project. Click on “Select Existing Project”.
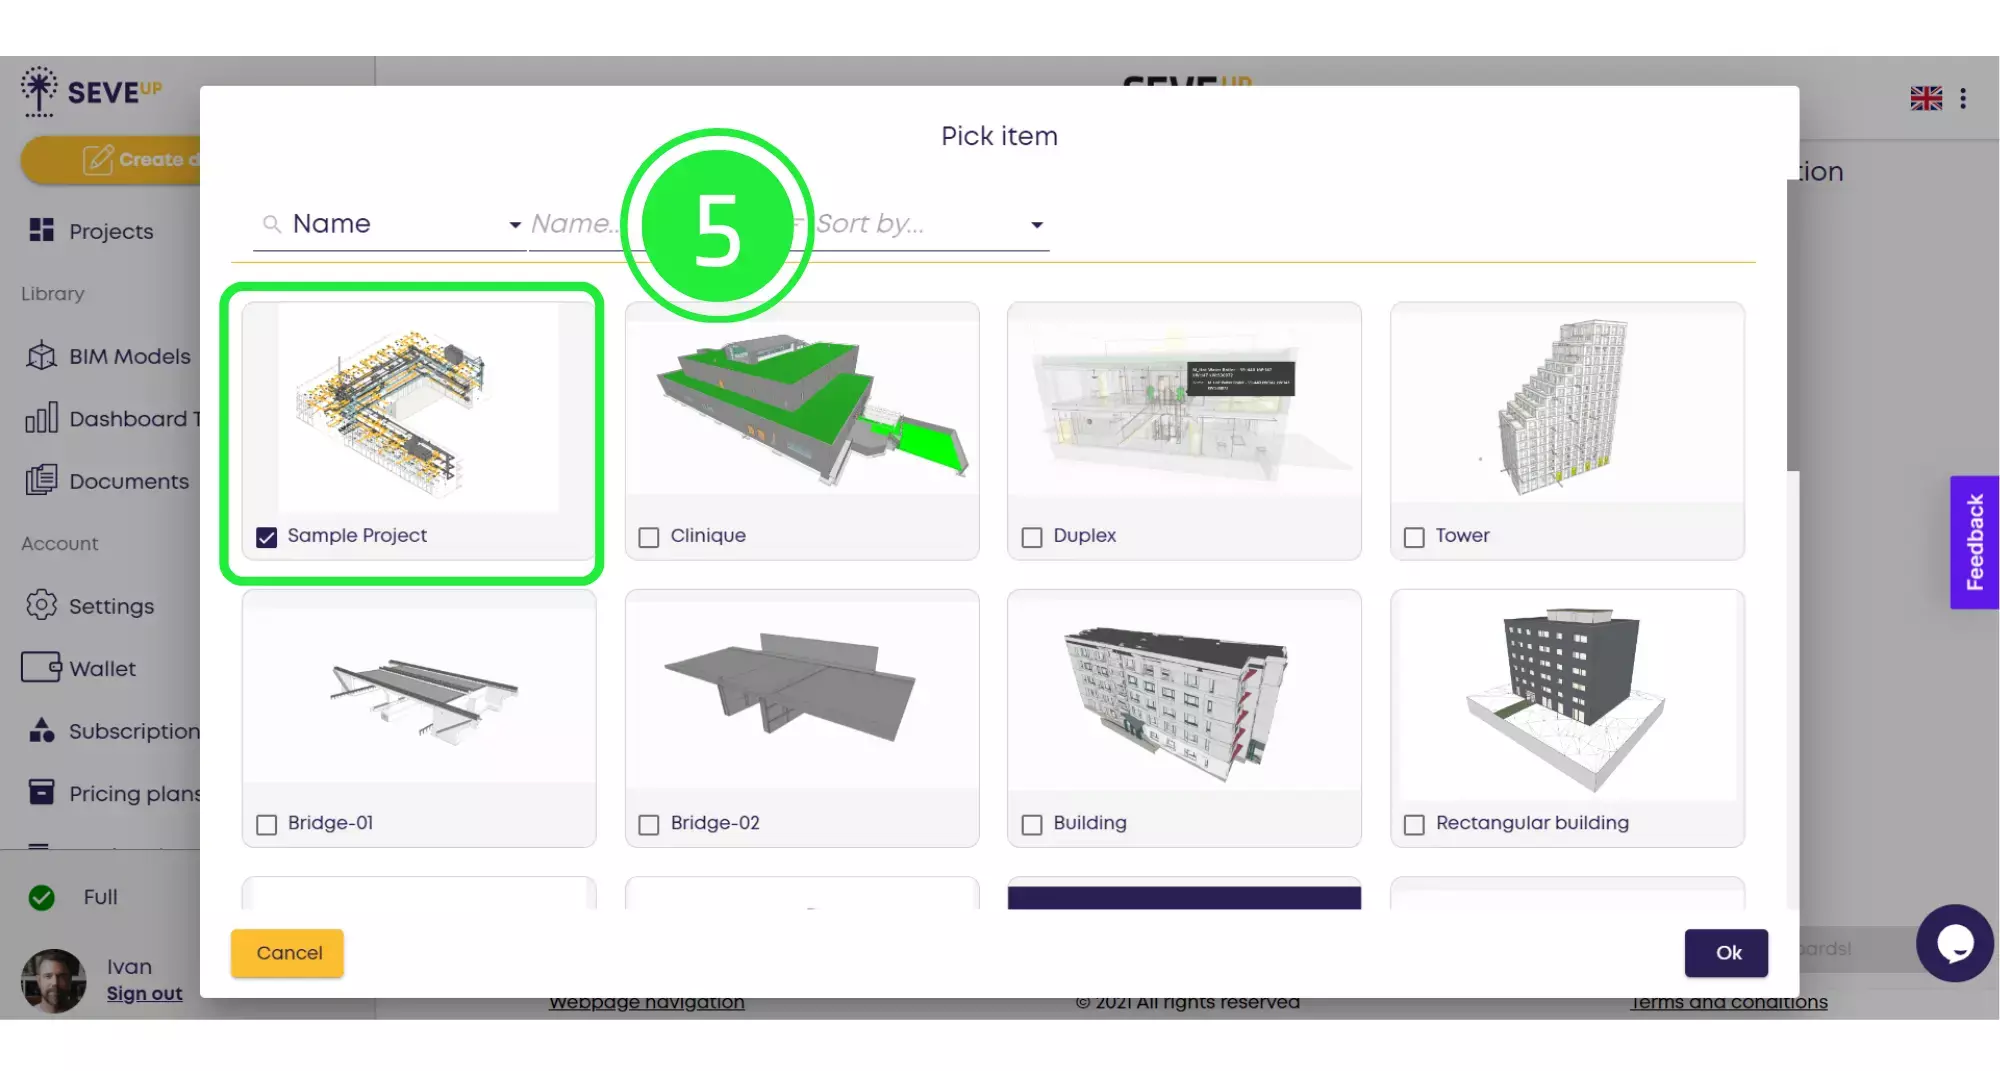
A selection of your projects will appear in a popup box. Choose the project you want to use by clicking on the small box to highlight it with a tick.
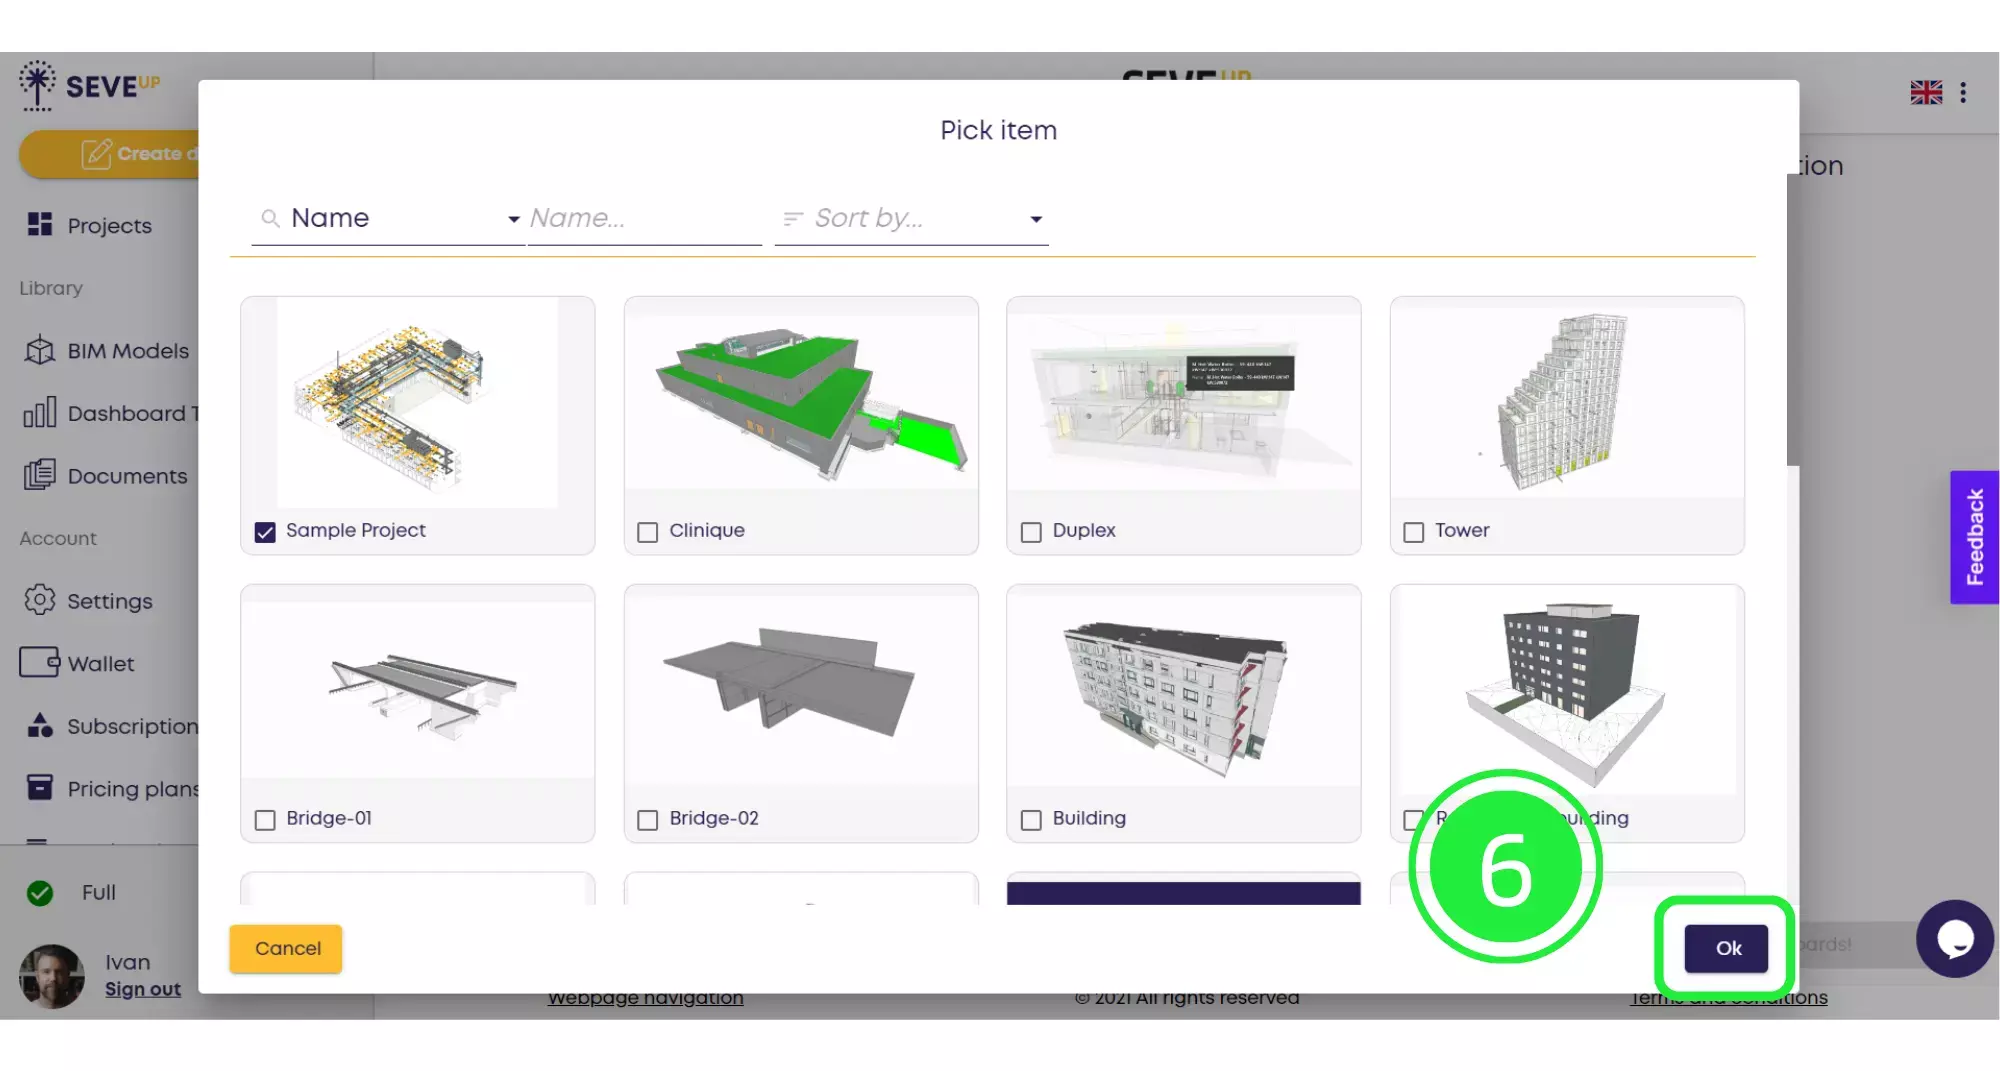
Now click on the “OK” button located in the bottom right corner.
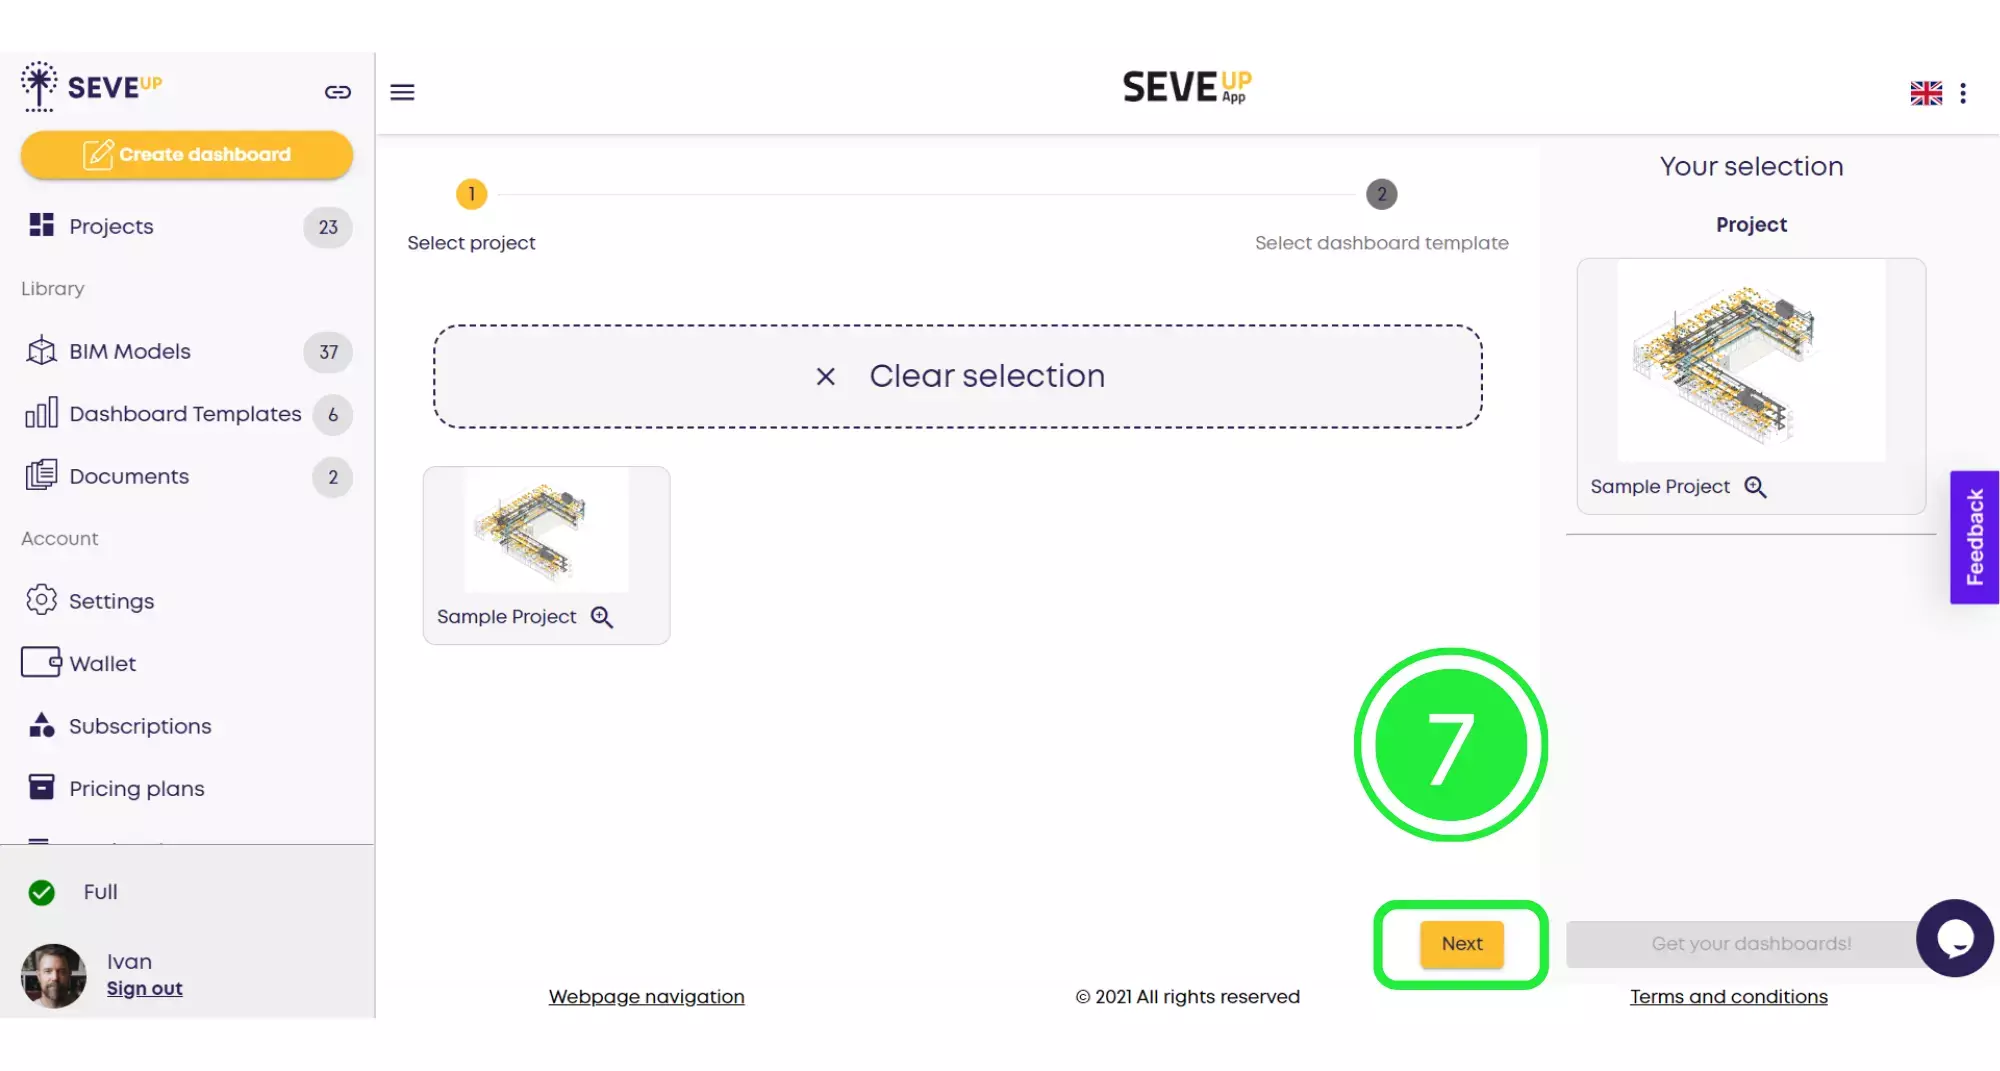
Now you’ll see the project you’ve chosen appear in the wizard. Then click on “Next” at the bottom to move to the following stage.
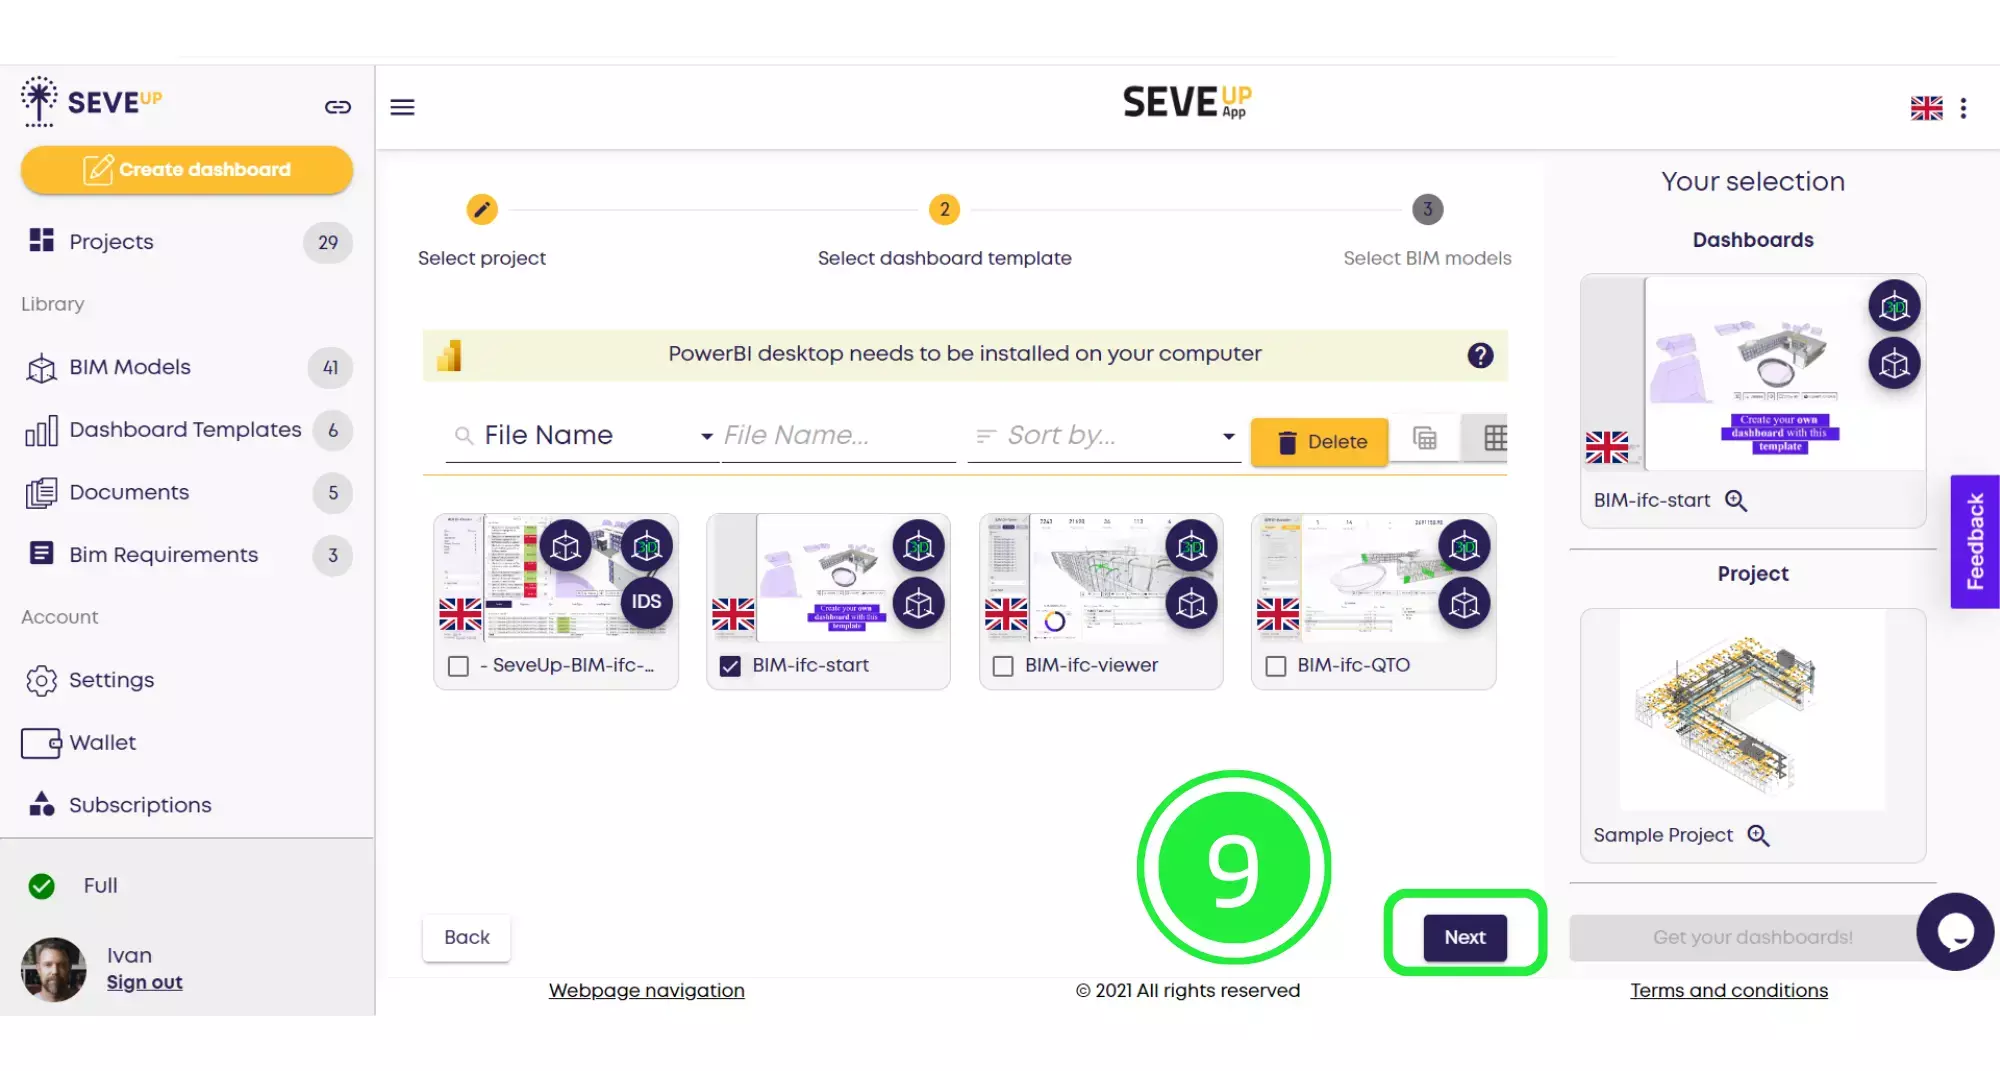
Now you’ll see that the wizard has moved you onto the “Select Dashboard Template” tab. Choose your template from the ones shown by clicking on the small box to highlight it with a tick. You’ll then see it show in the right hand pane next to the “Project” you’ve chosen.
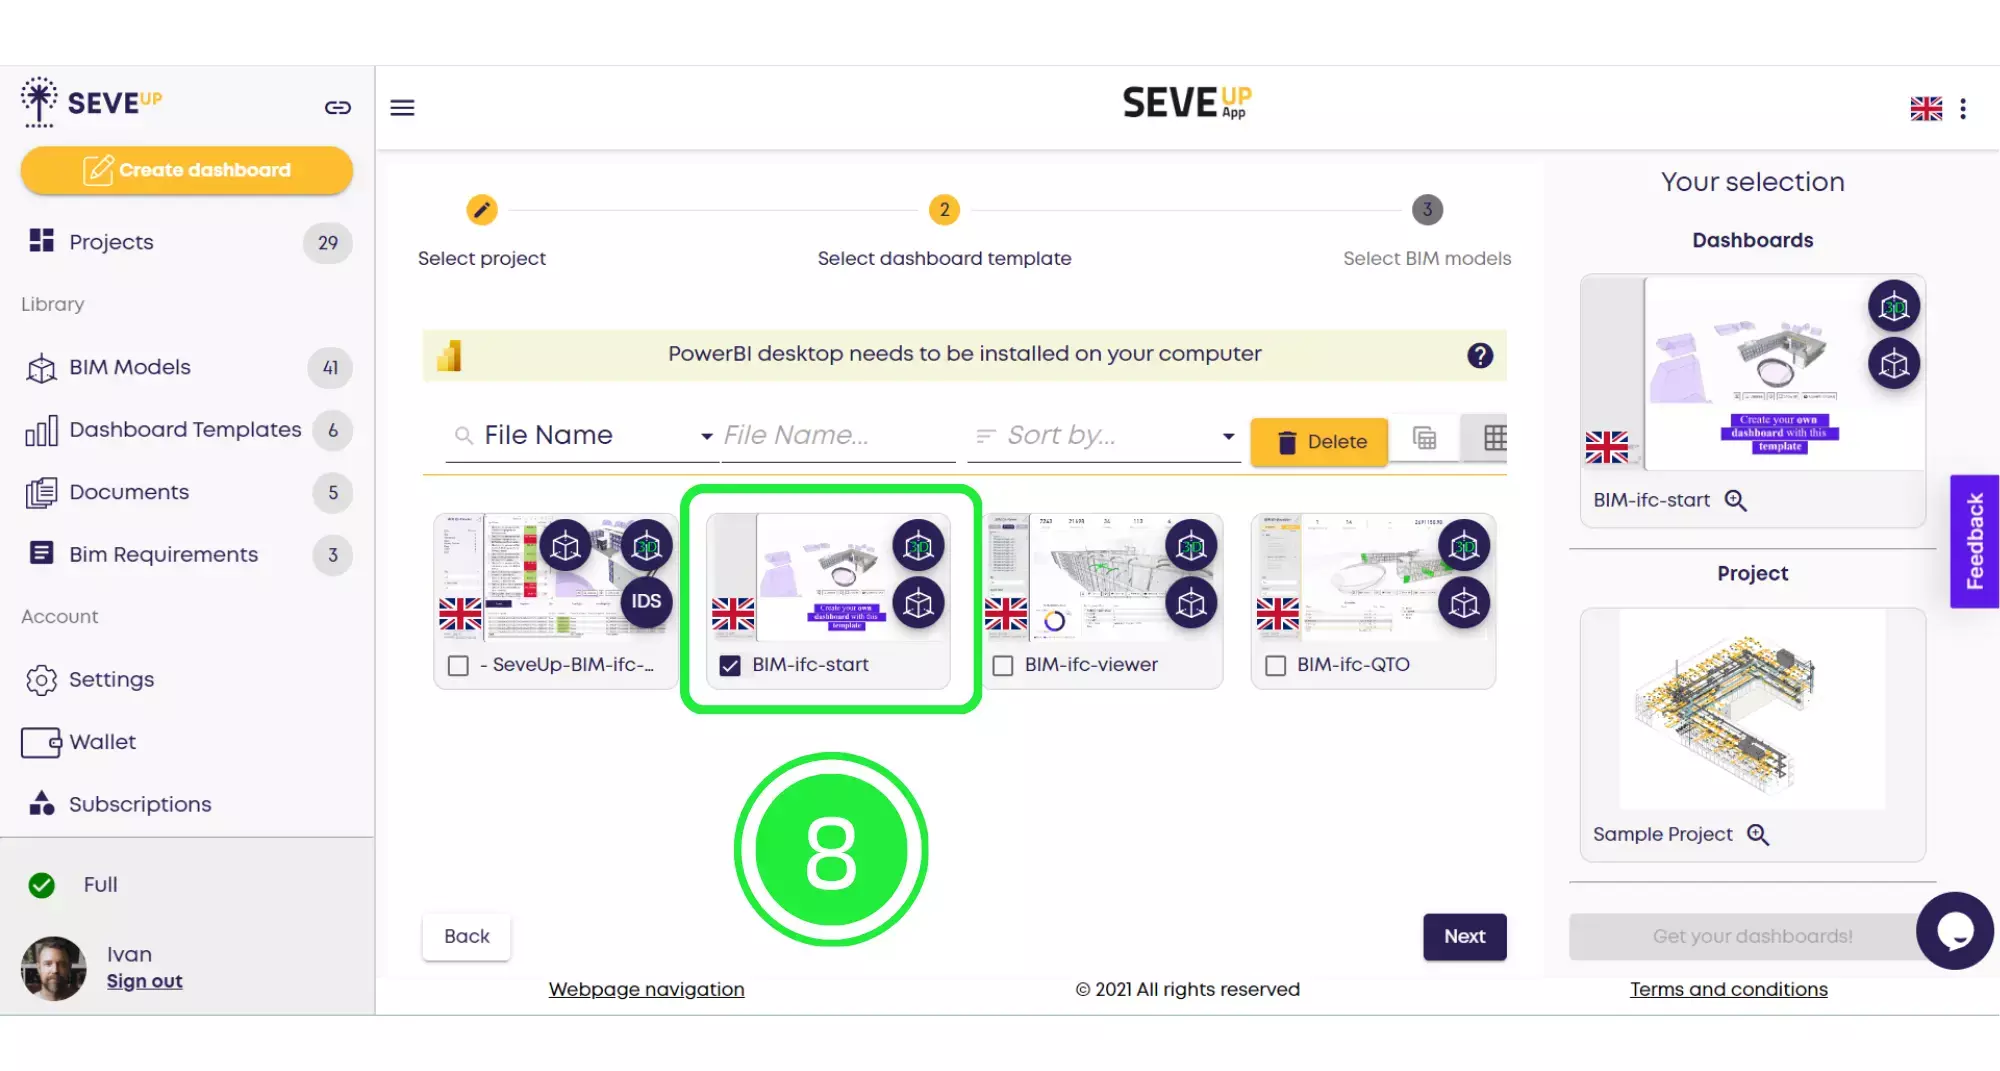
Now click on “Next” on the bottom right of the page to move onto the next part in the wizard.
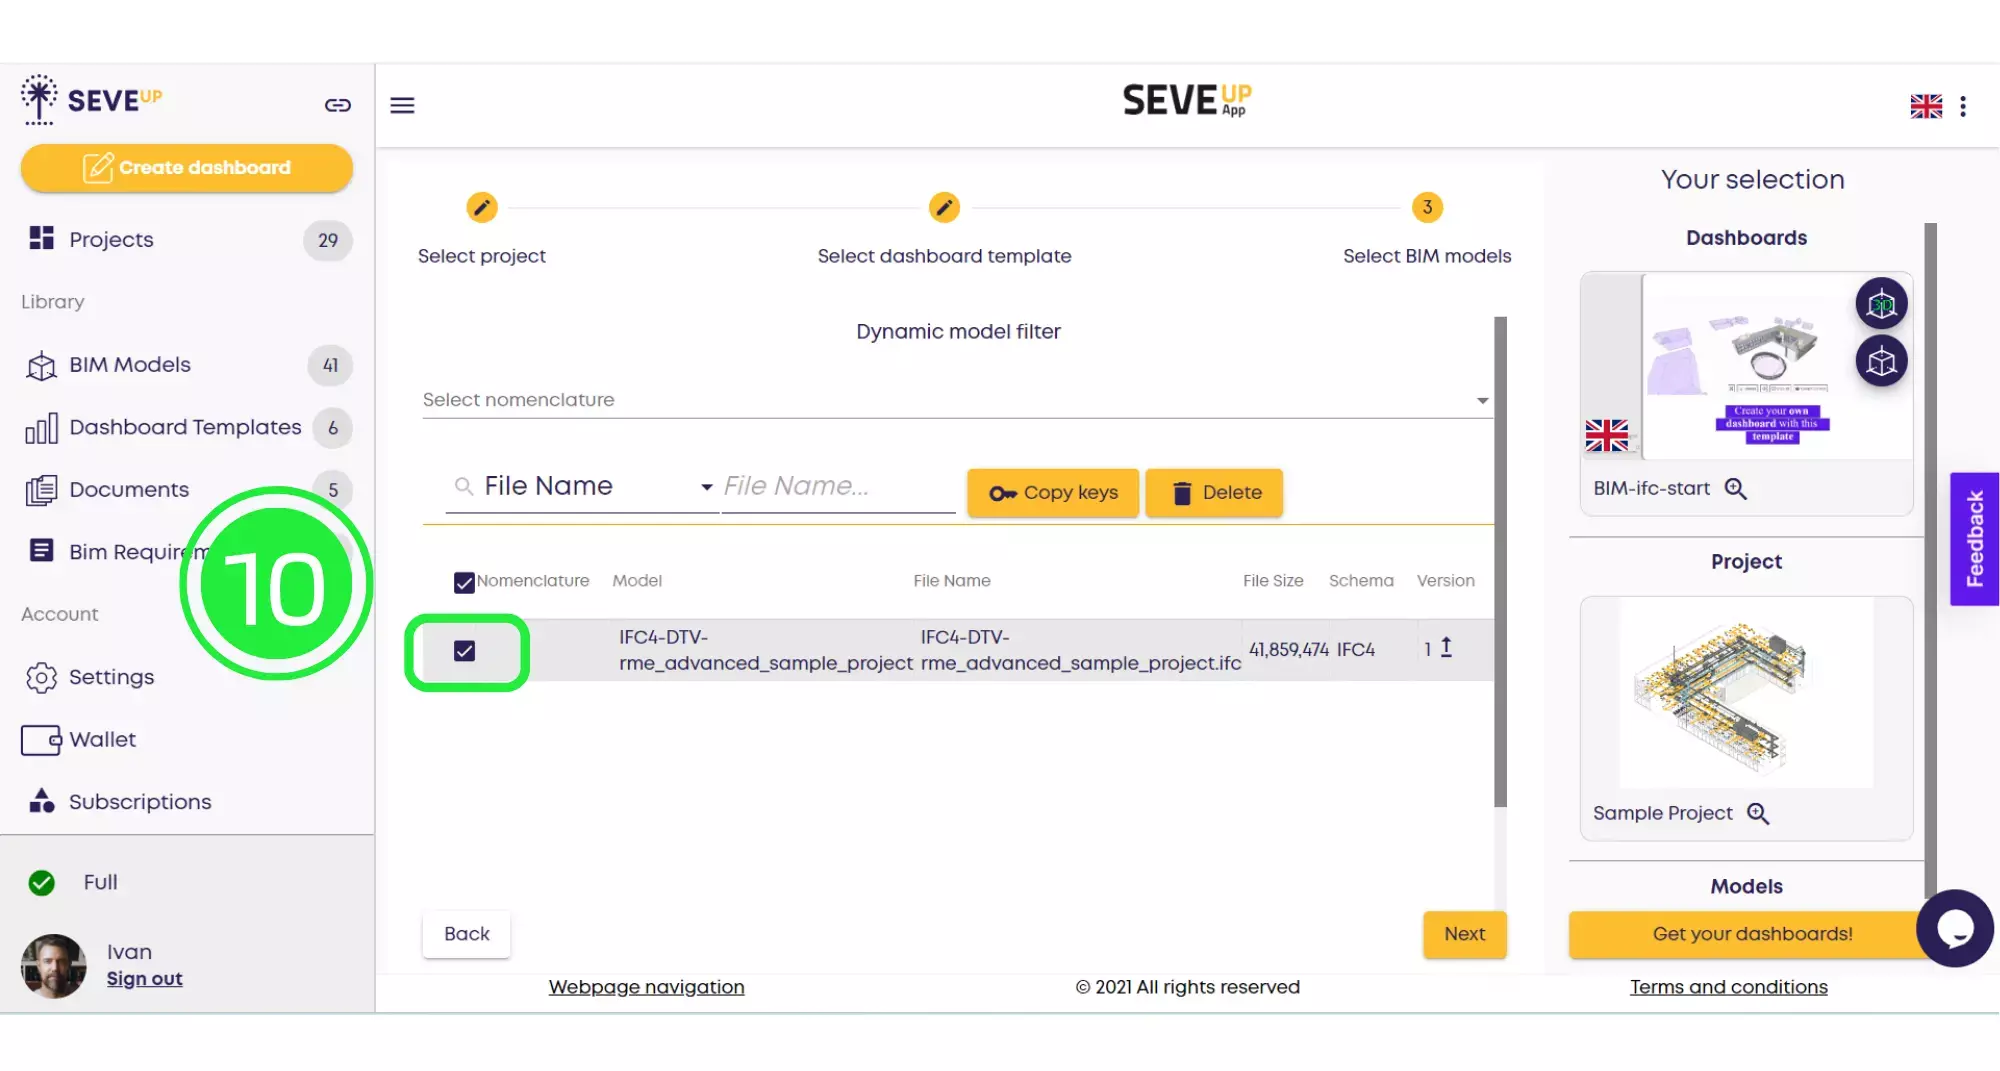
Now the wizard has moved to the “Select BIM Models” tab. Click on the BIM model you would like to use by highlighting the small box with a tick.
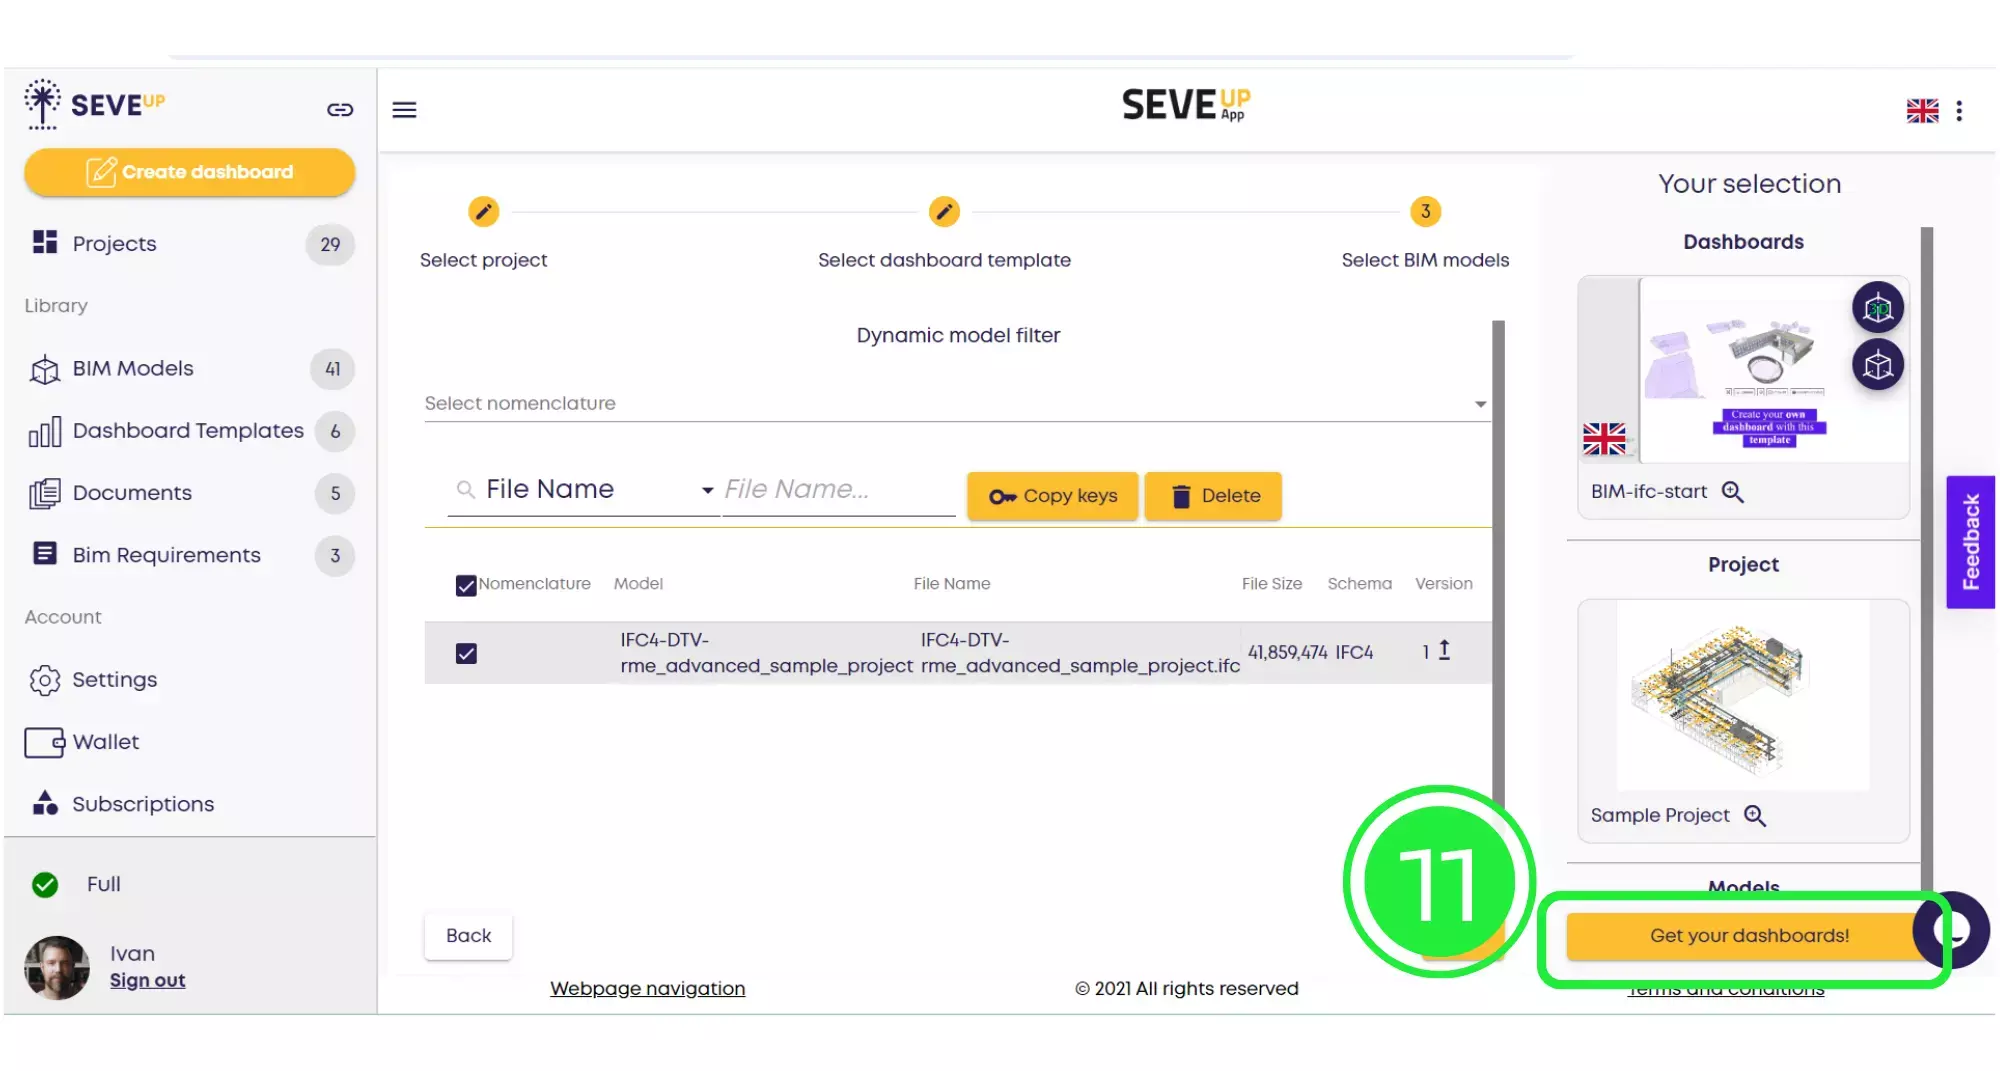
Now click on “Get Your Dashboards!” and your dashboard will automatically download onto your computer.
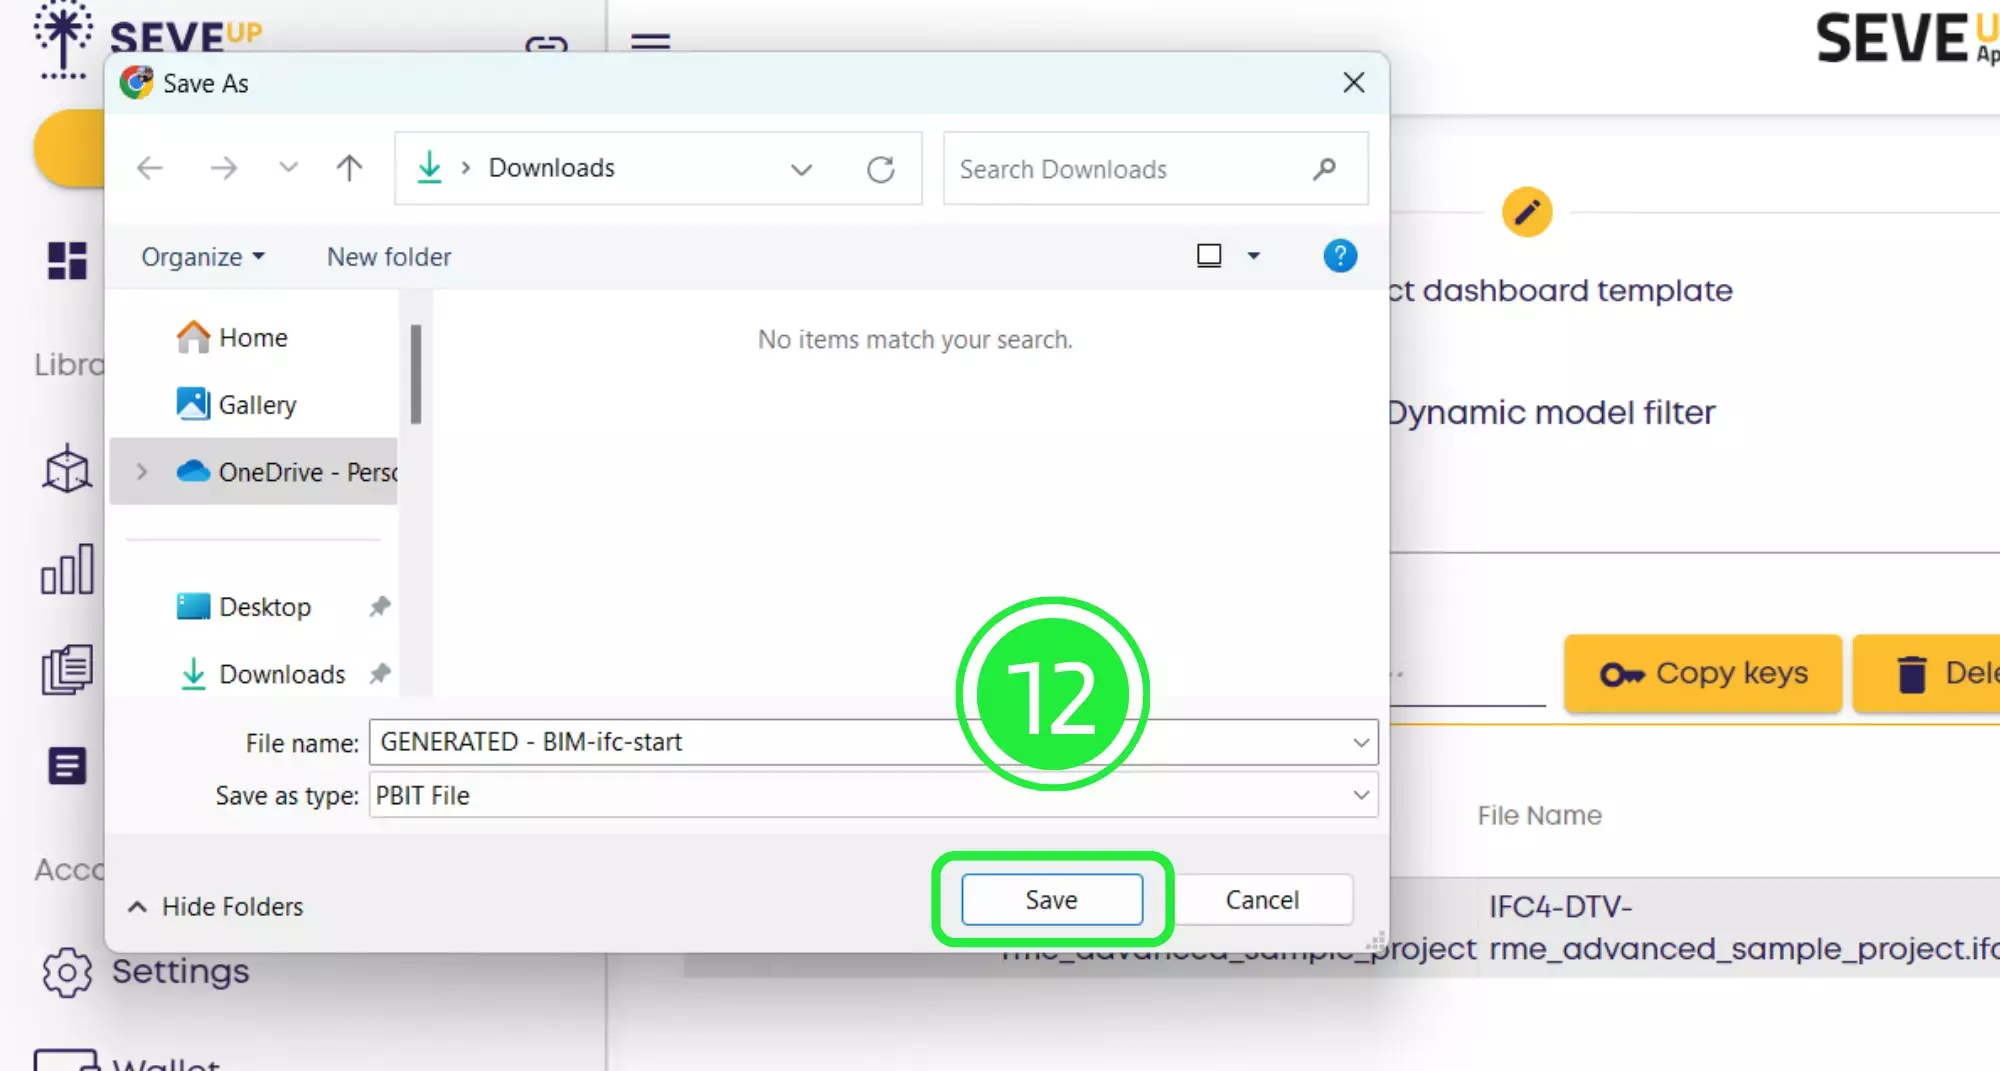
Click on the “Save” button to save your project to your computer.
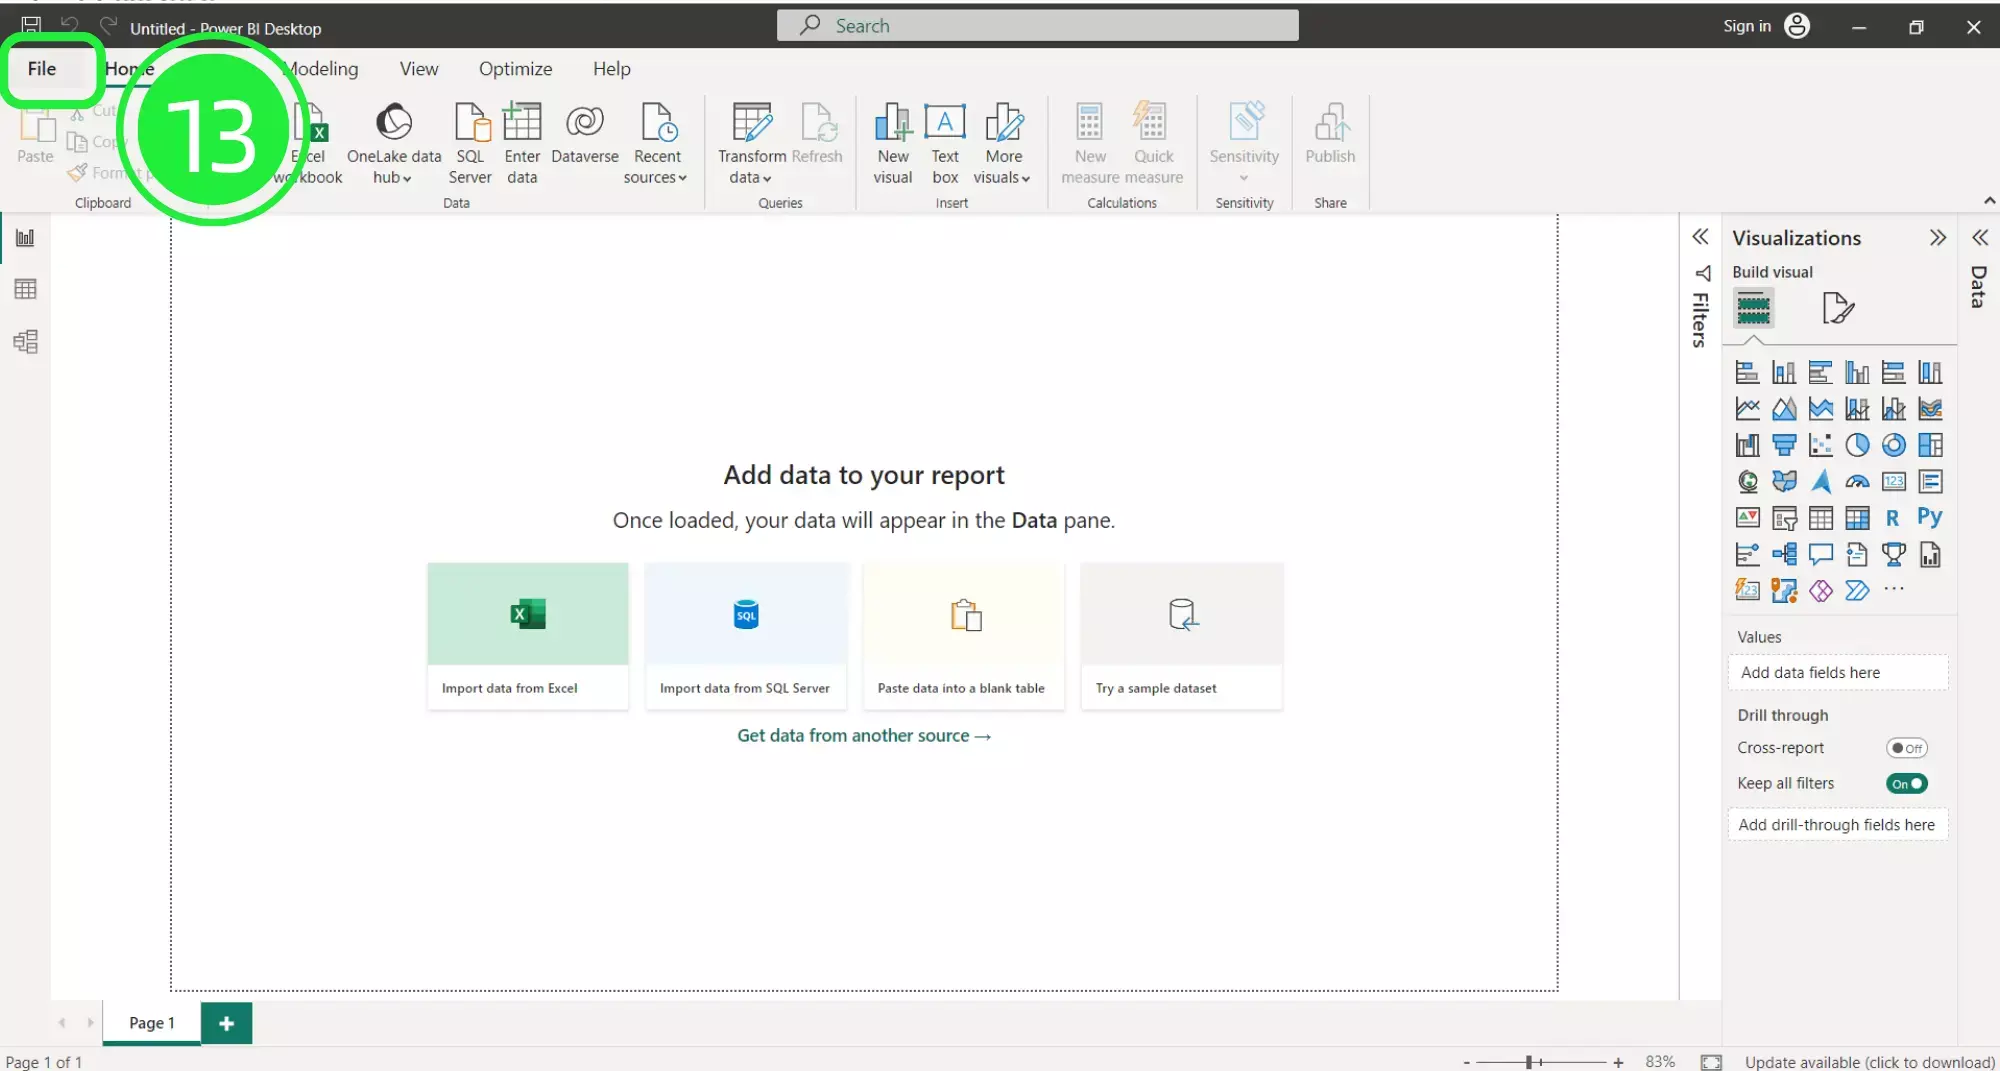
Open up Microsoft Power BI and click on “File” on the top left of the page.
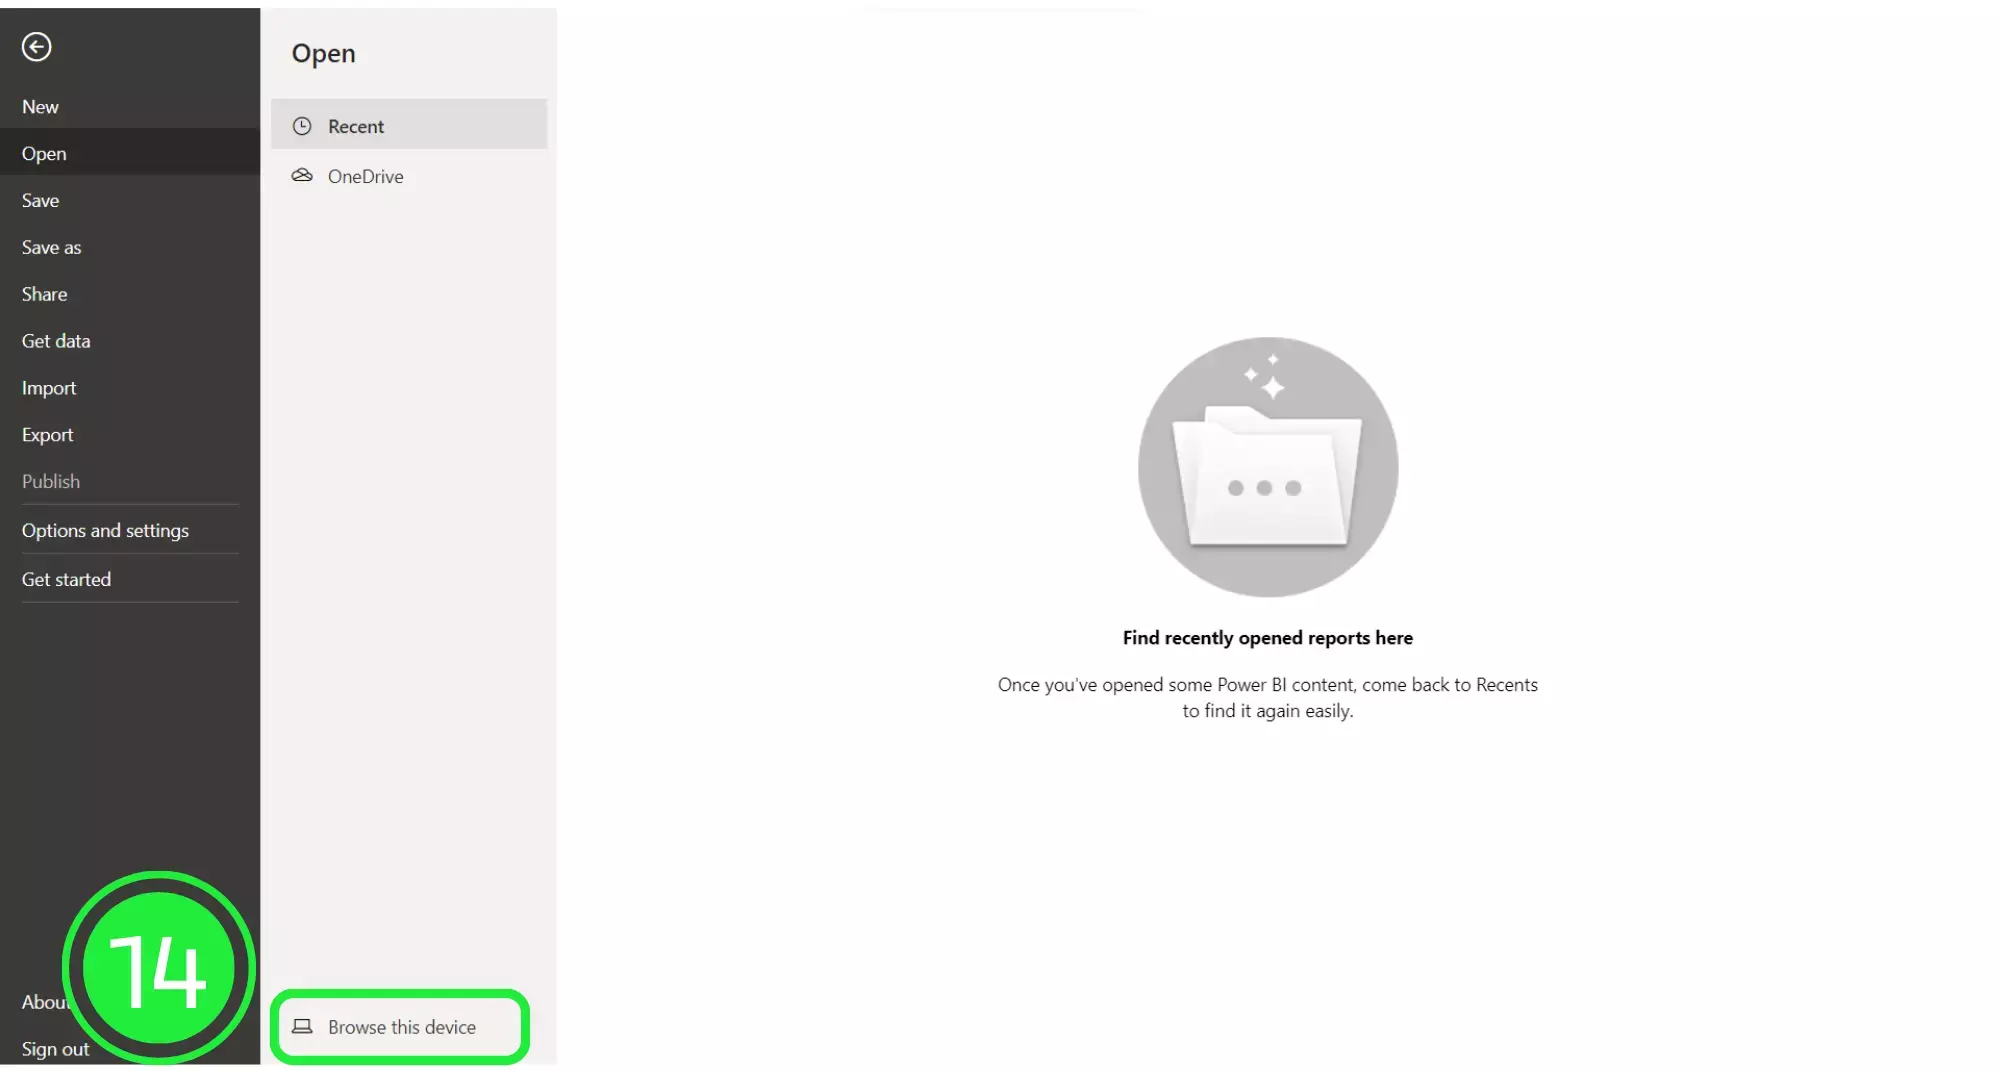
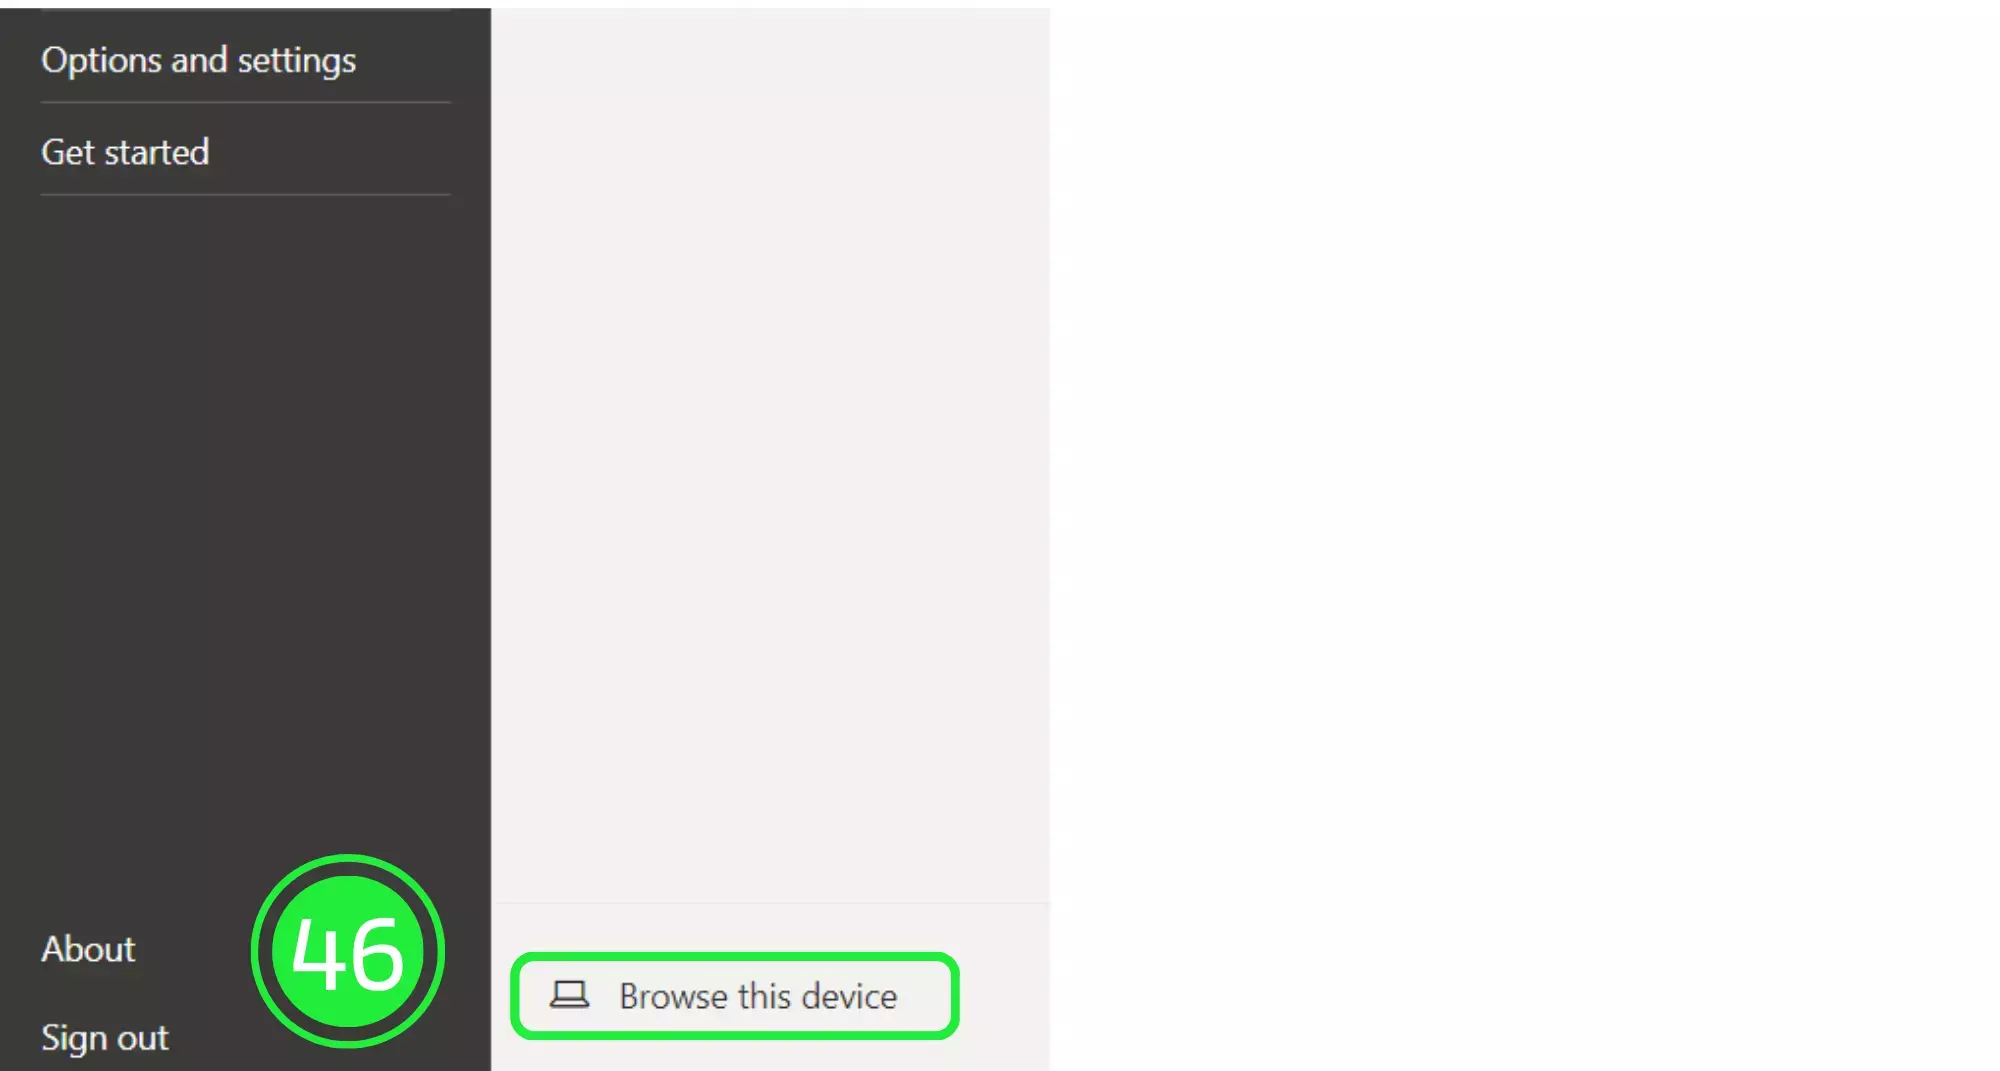
A menu will open up. Click on the “Browse this device” button at the bottom of the screen to search for your newly downloaded dashboard.
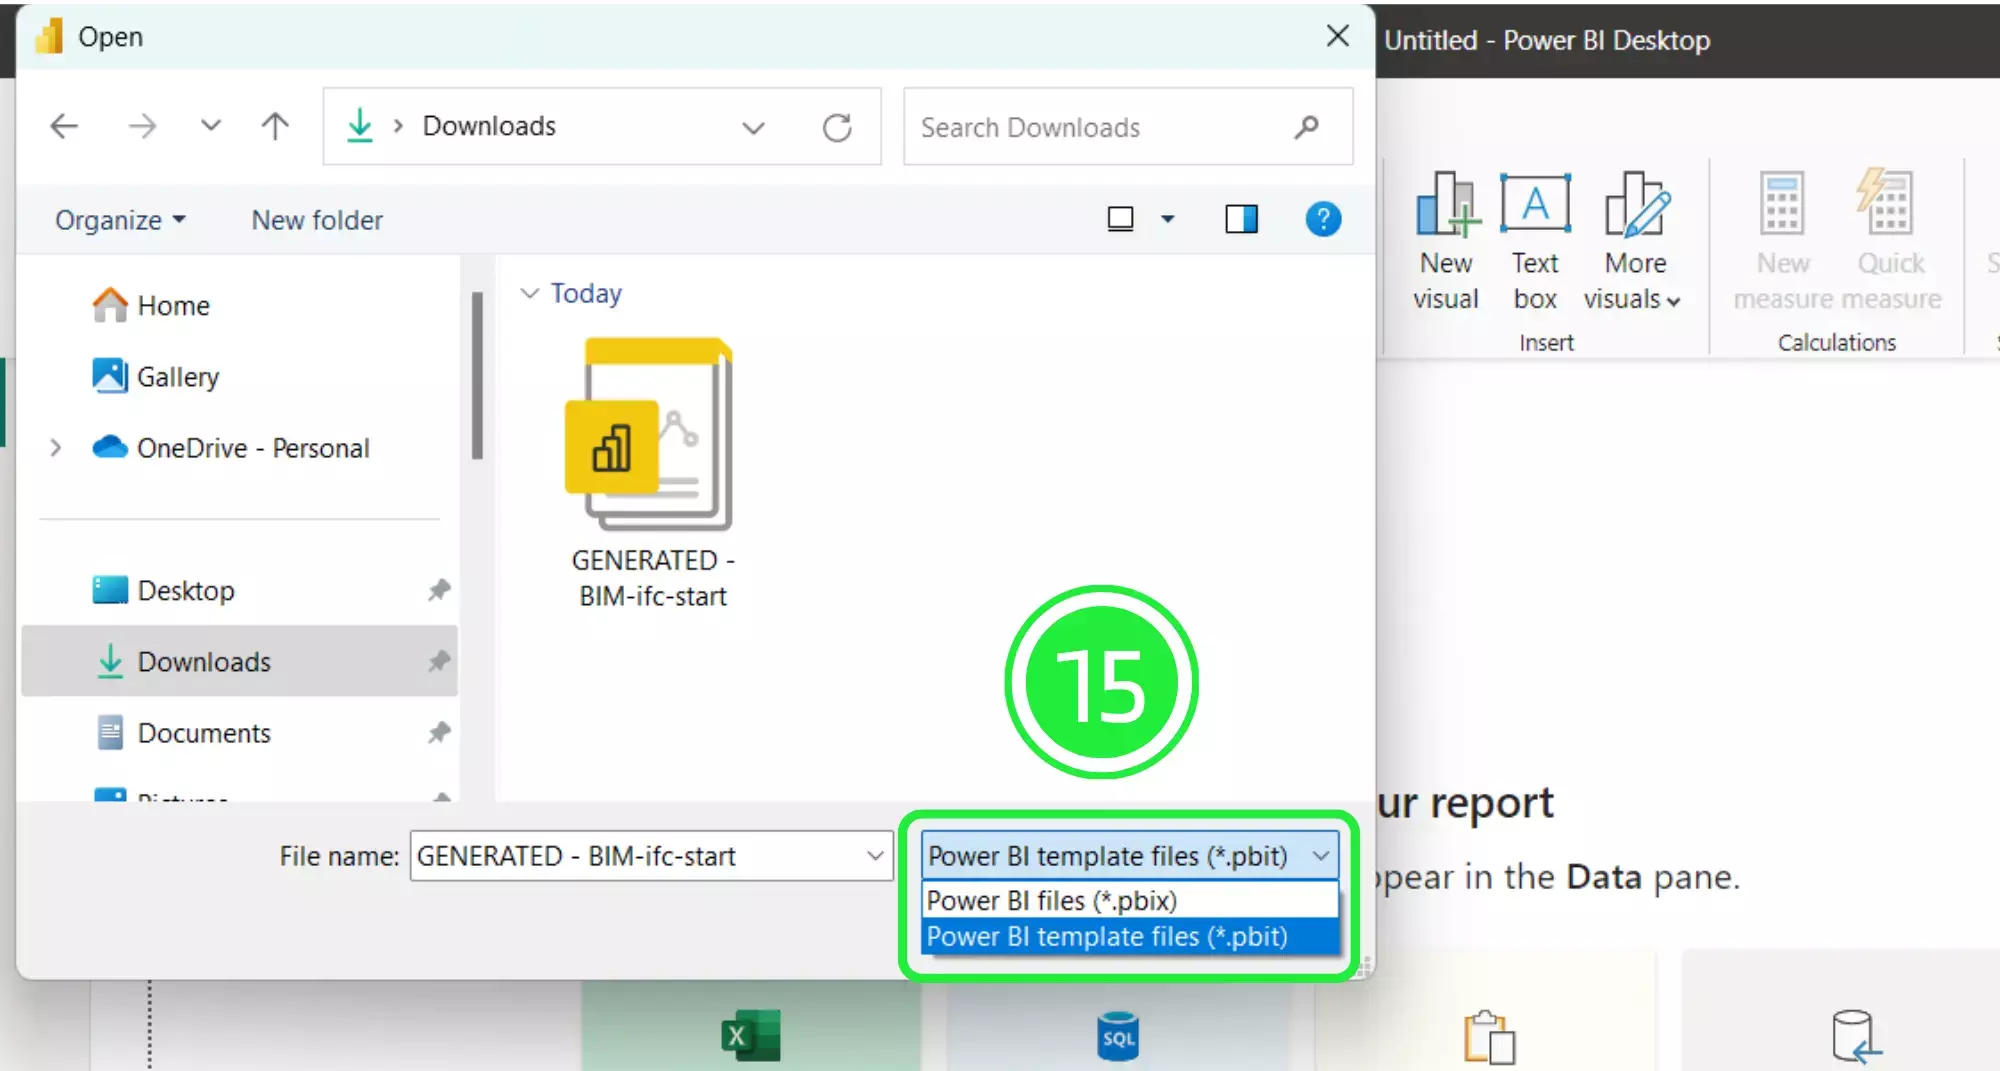
On the “Open” window, go to the bottom right and choose the correct file extension. Choose “Power BI Template Files (*pbit). Any files of this type will now show in the window.
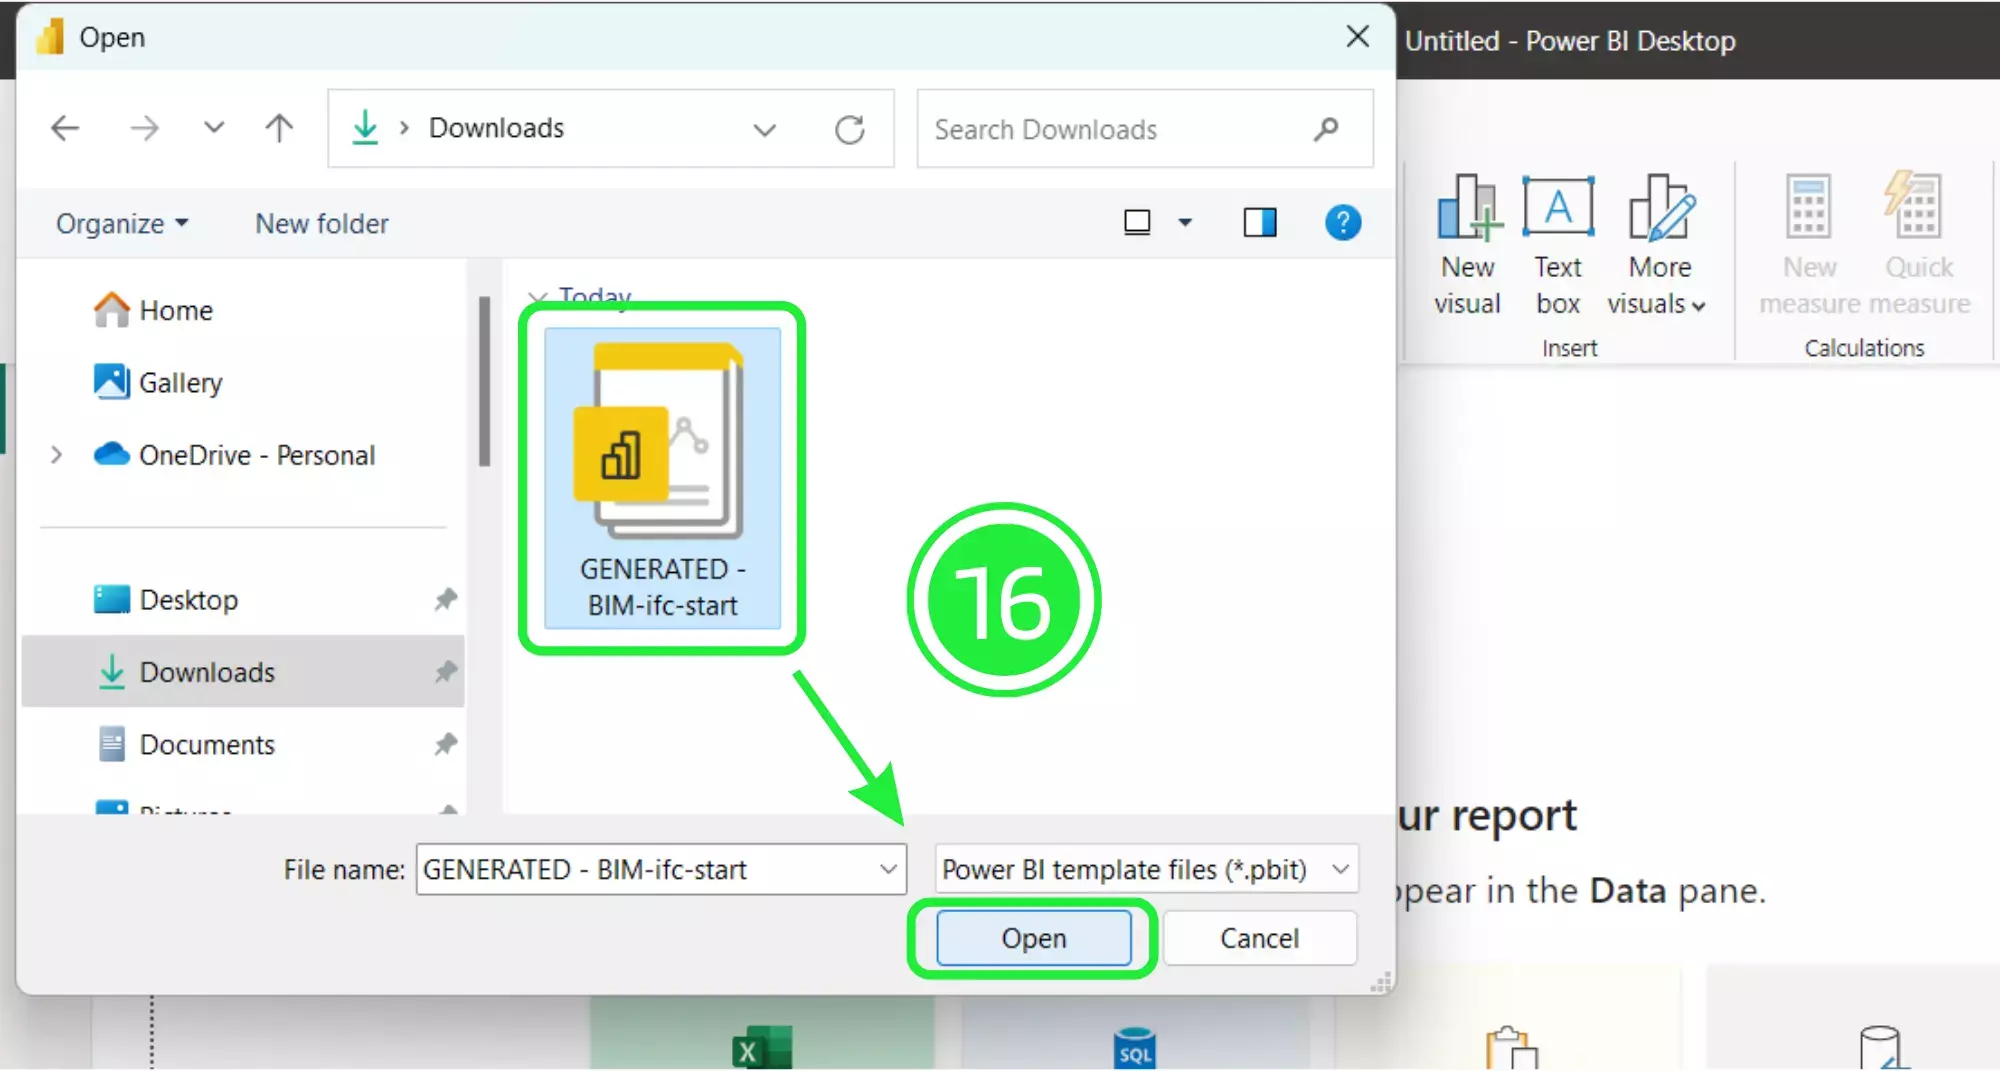
Select your newly downloaded template file and then click on “Open”.
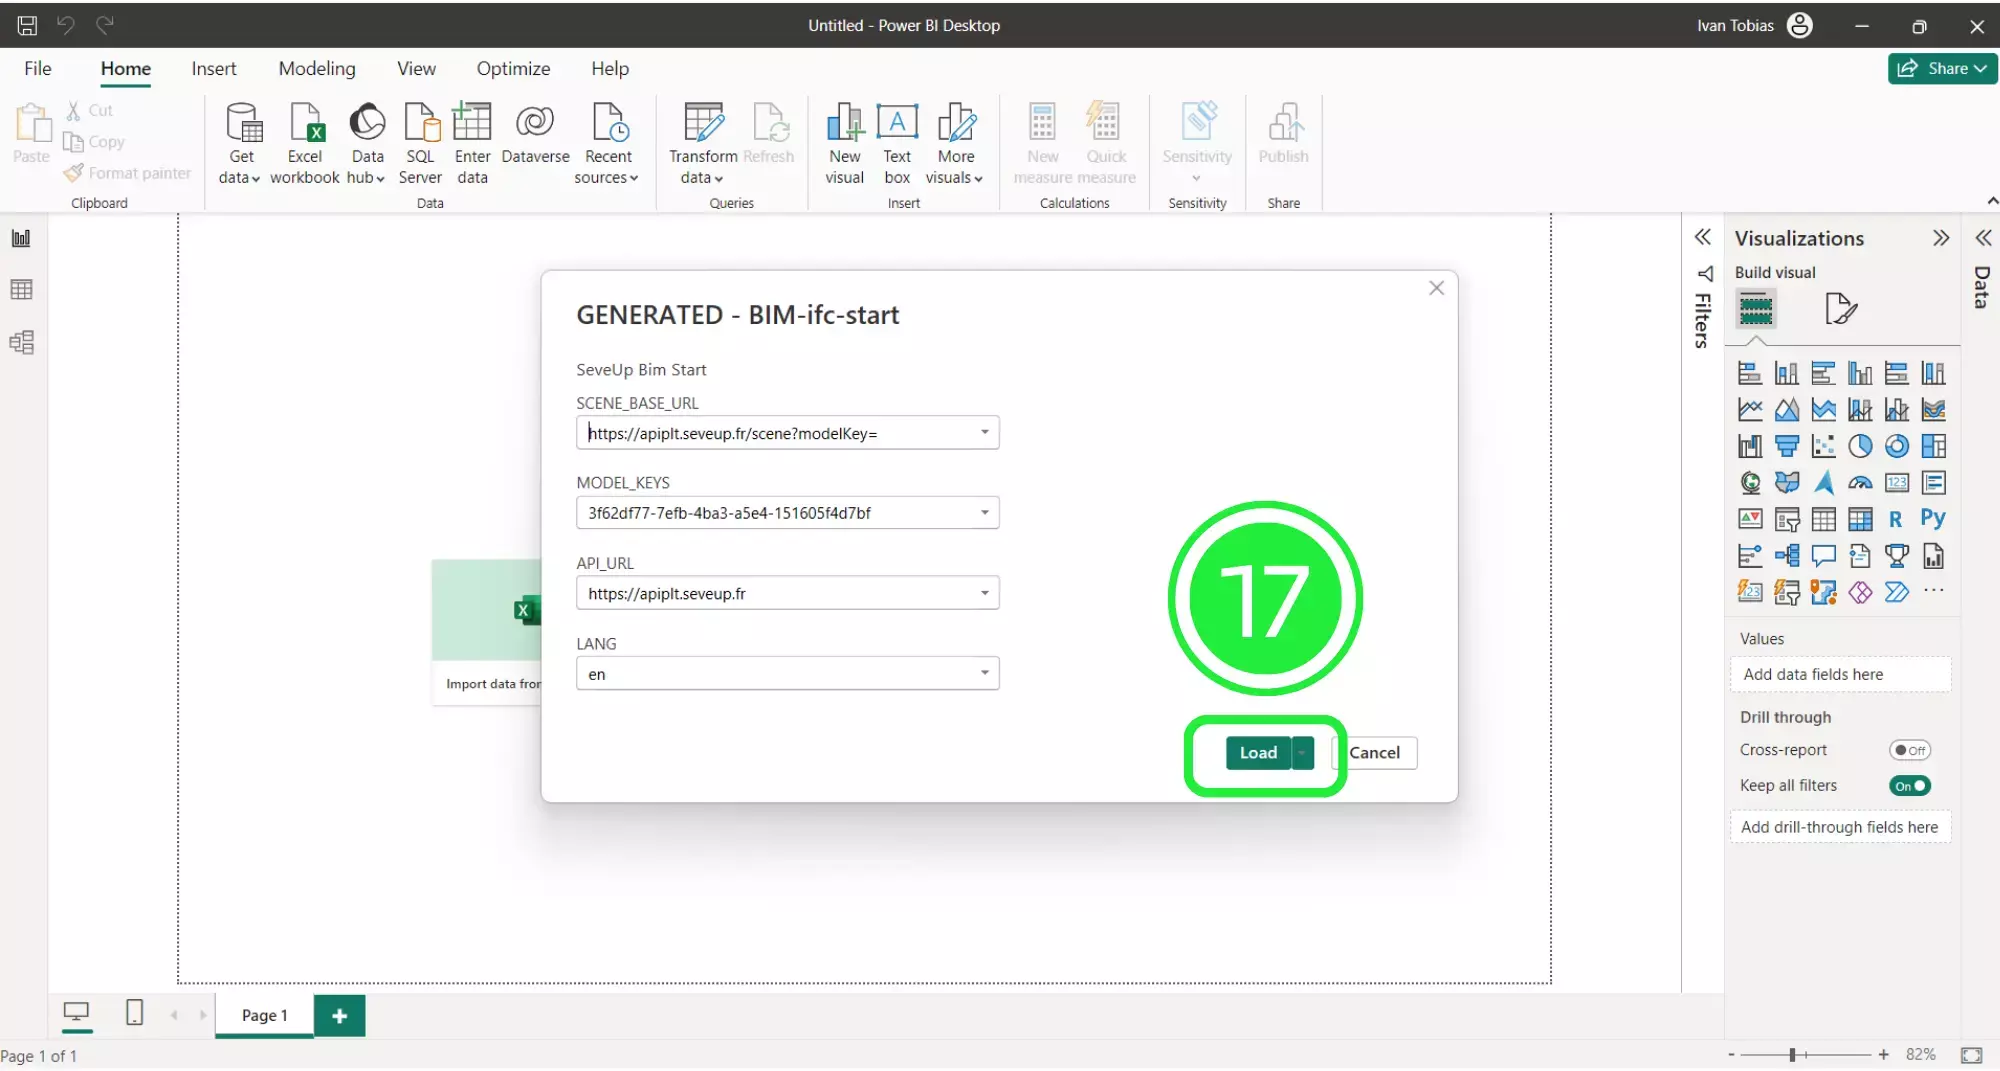
A pop-up will appear showing the file details. Click on “Load” and your Dashboard Template file will start to load in Microsoft Power BI.
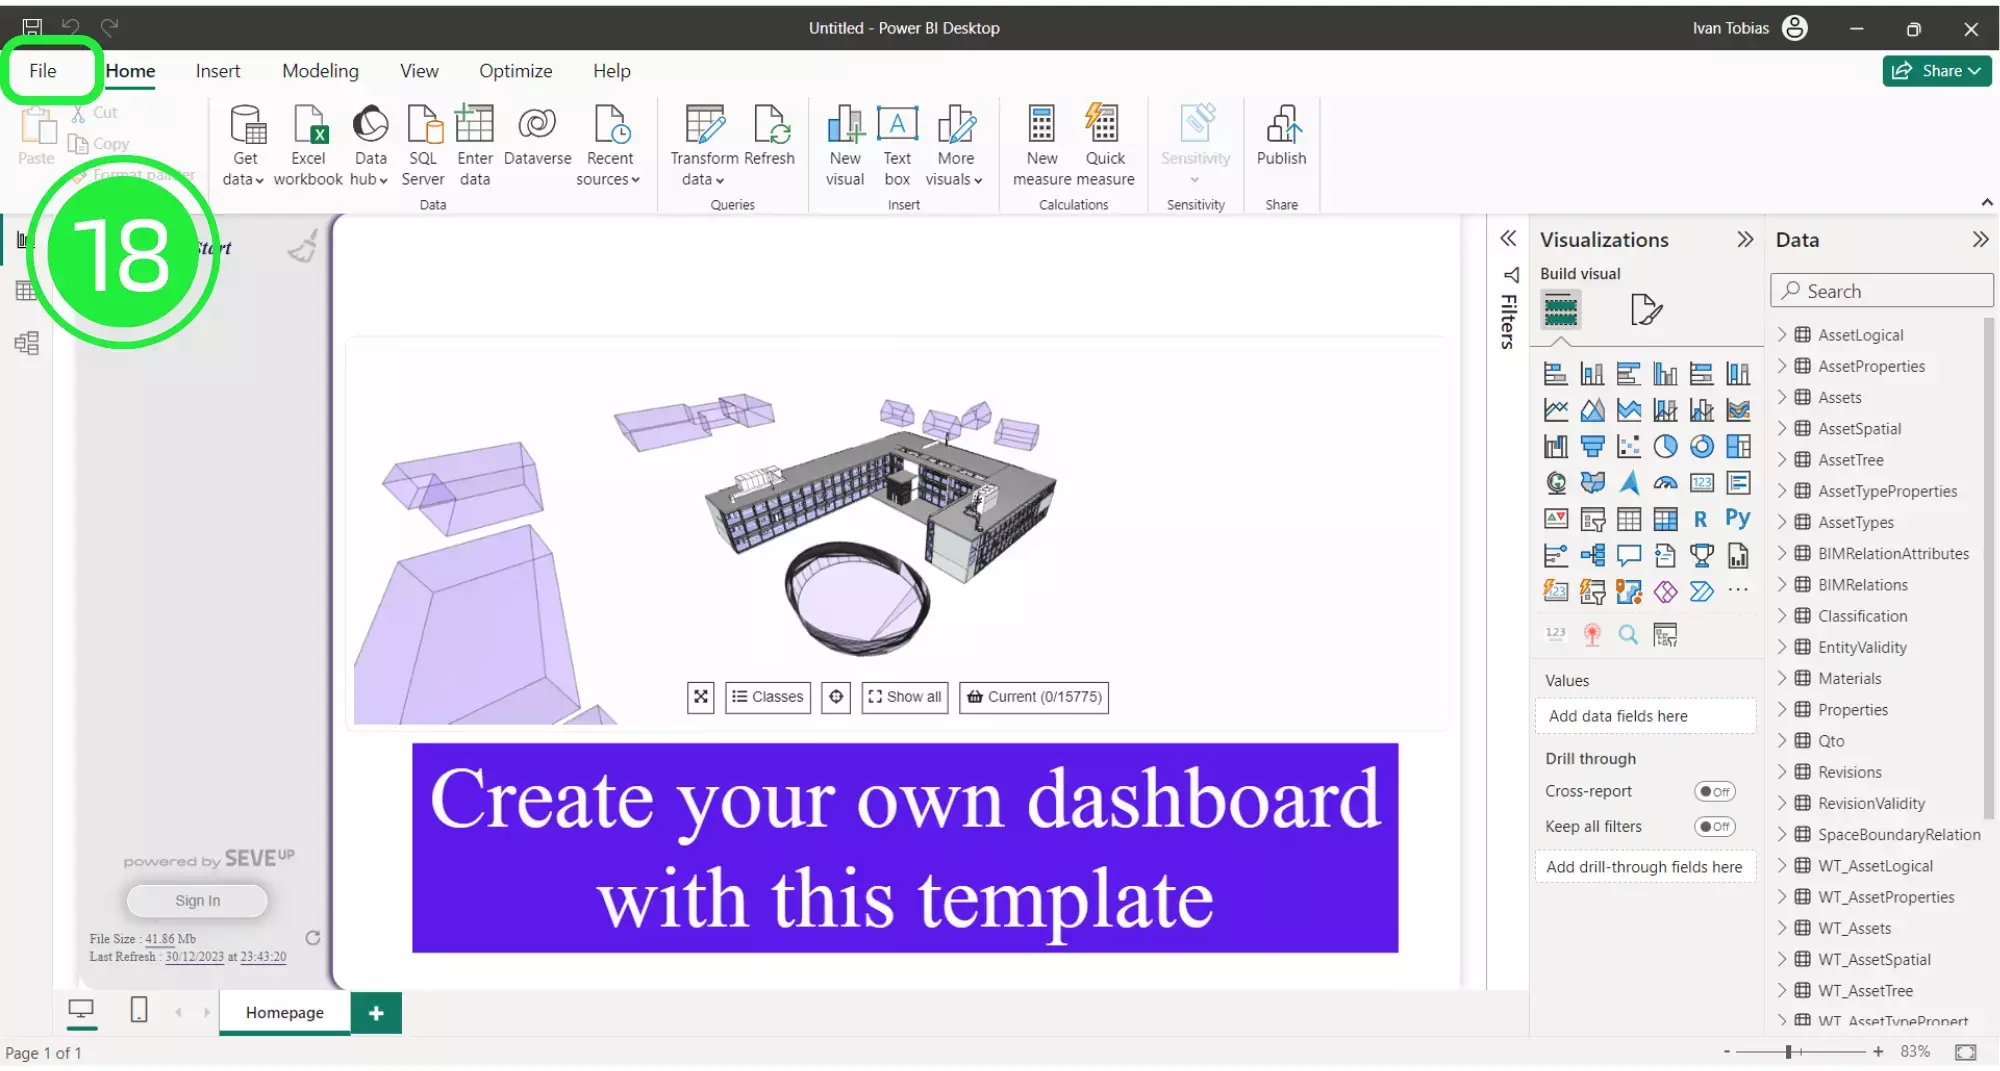
Once your new dashboard template has loaded, it will populate the Power BI interface with all of the BIM data that was in the files you added.
In order to build the template in Power BI we first need to save it as a Power BI file (.pbix). To do this click on “File” in the top left corner of the page.
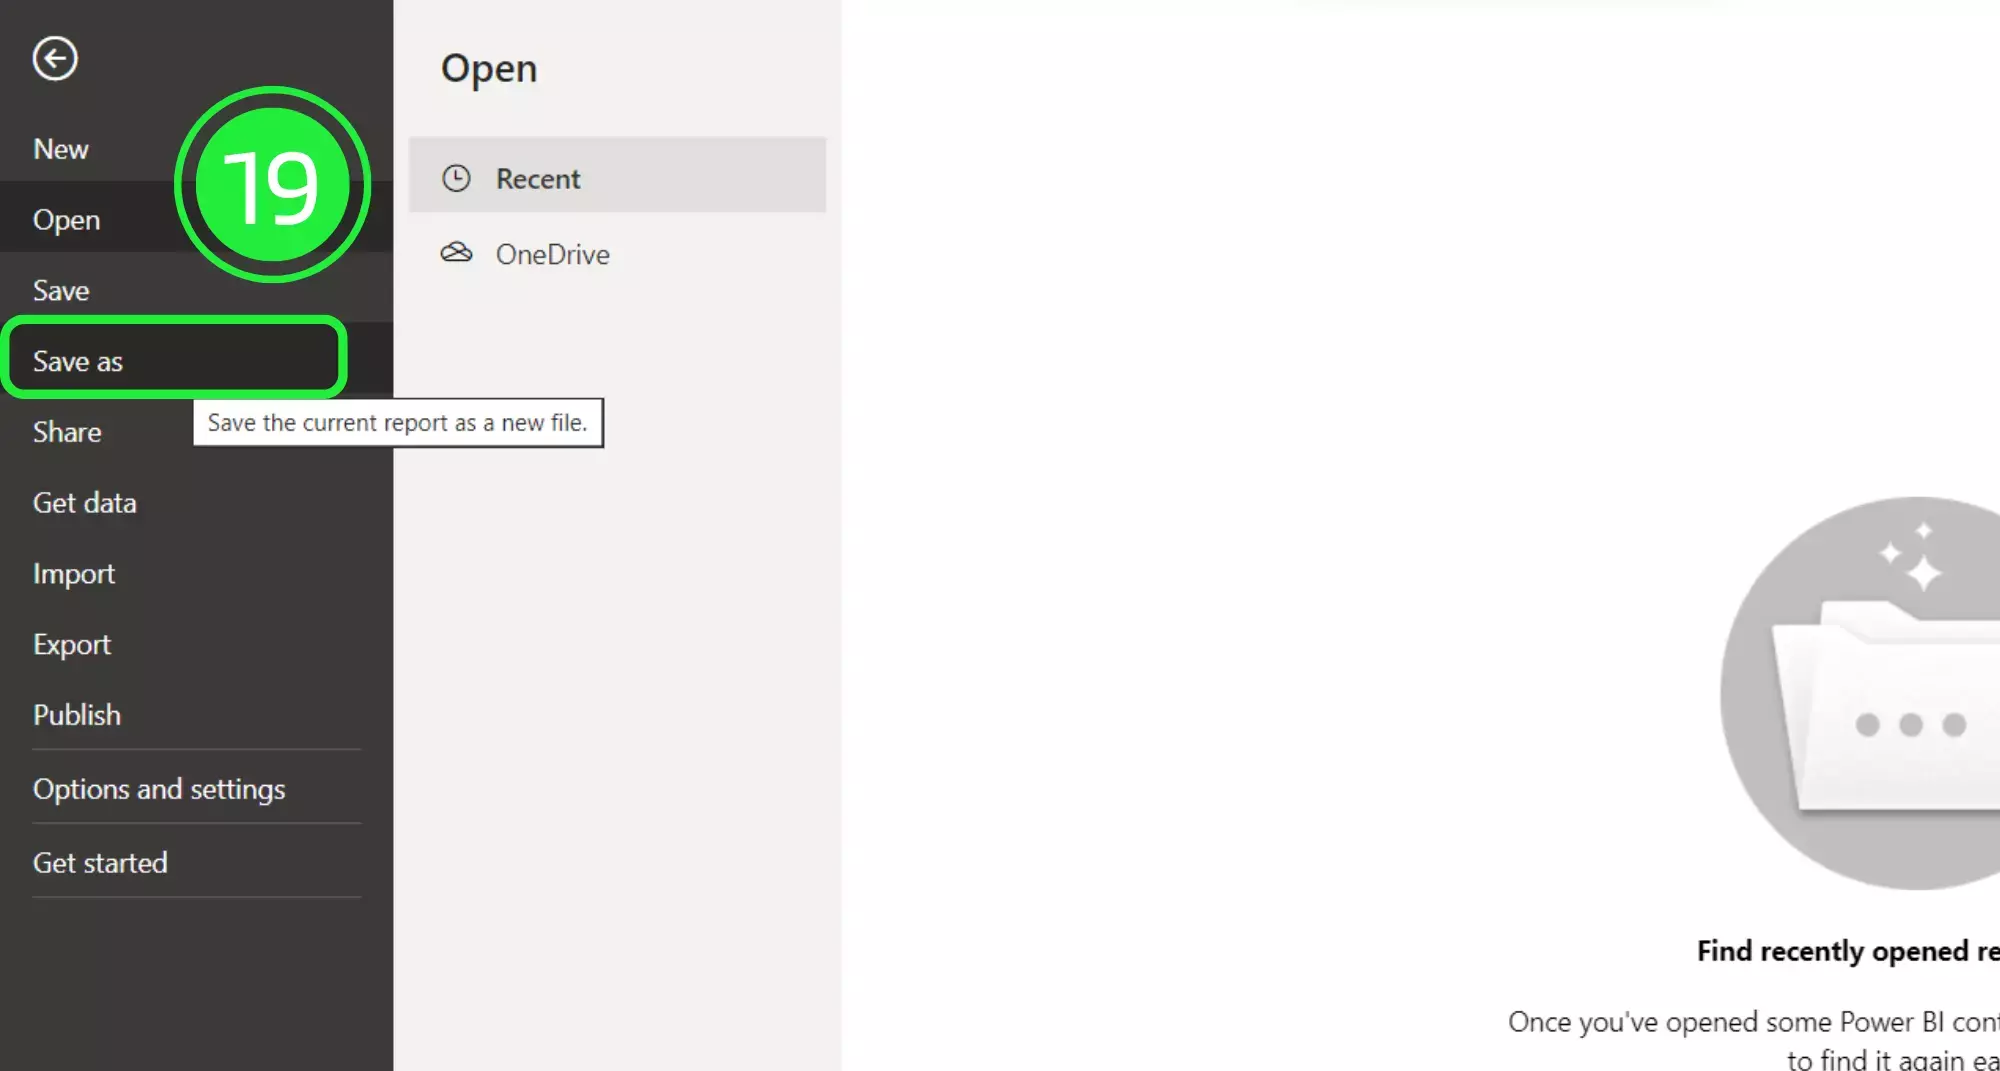
Select “Save As” in order to save your file.
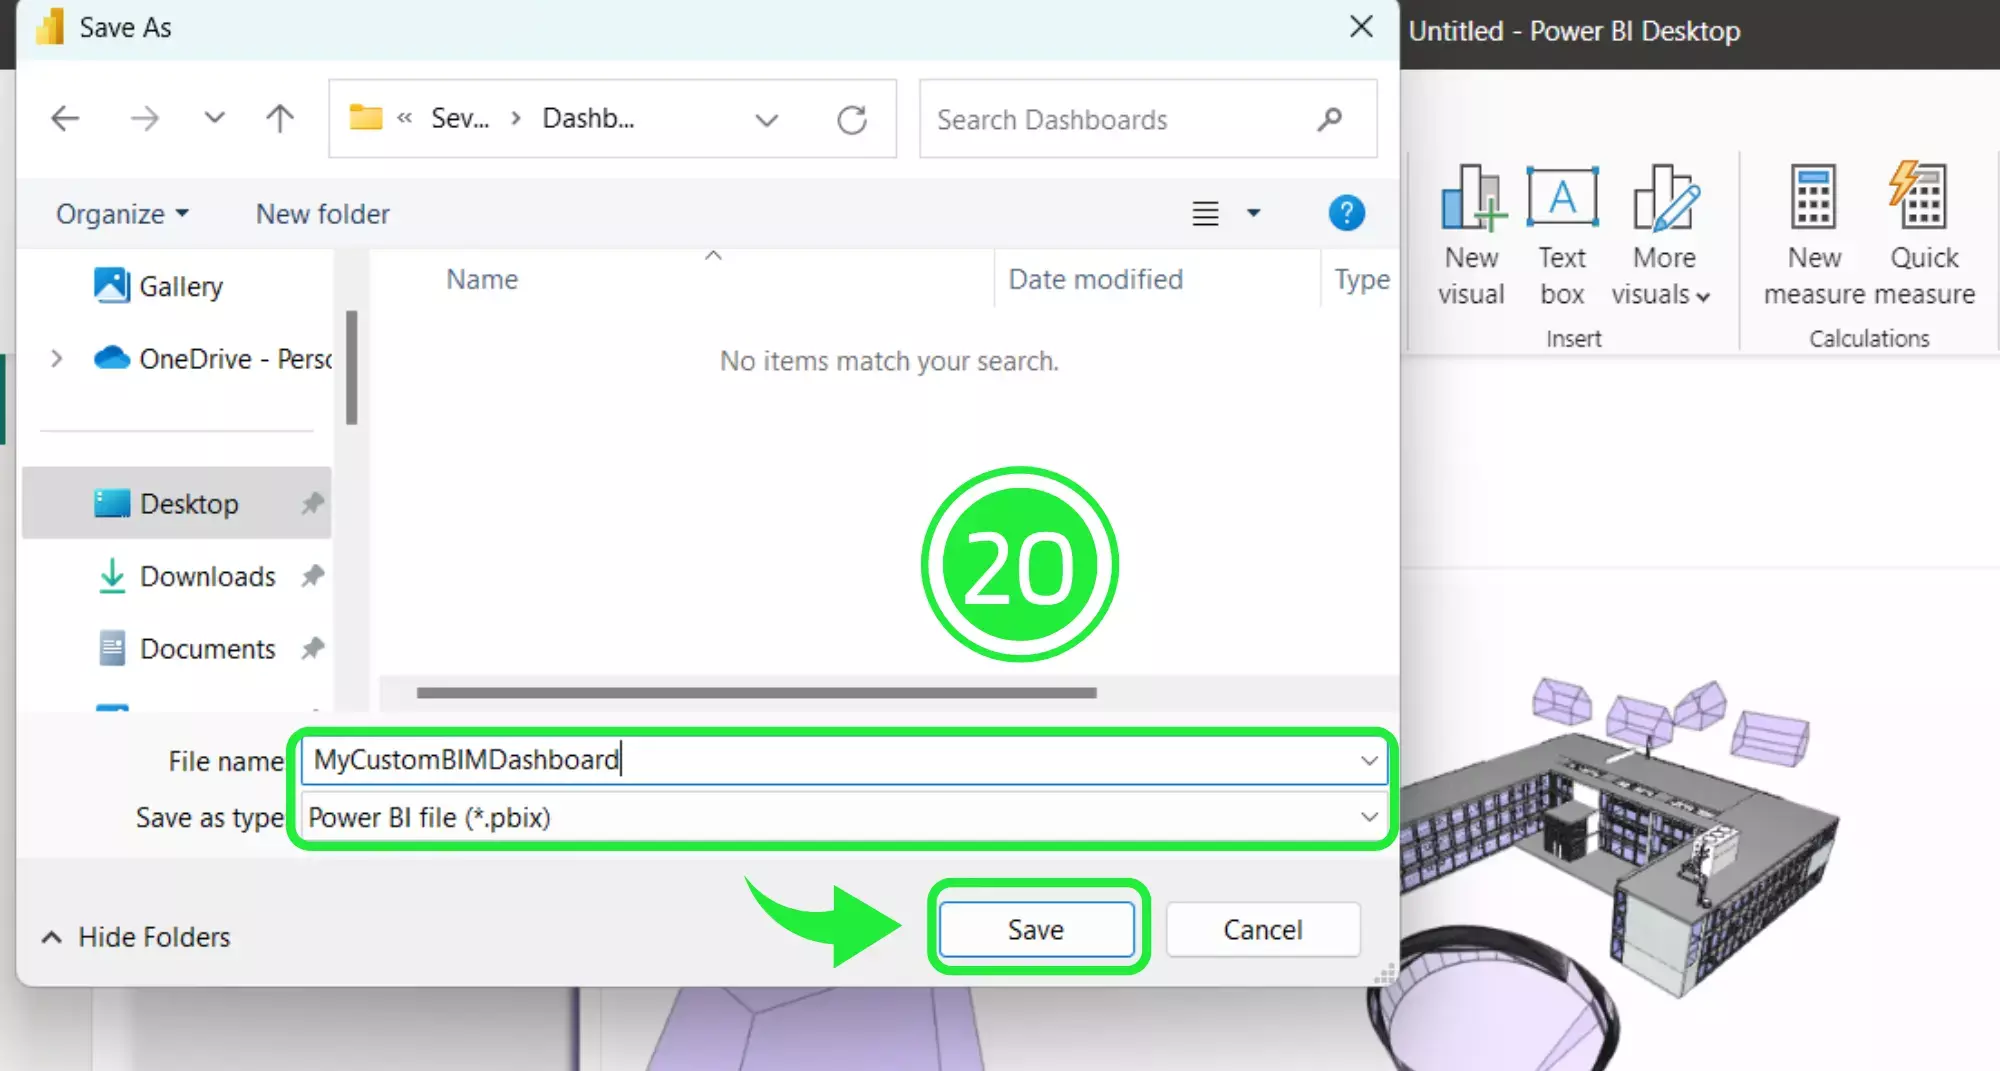
Choose an appropriate name for your file and then click on the “Save” button. These first twenty steps can be found in several of our tutorials: here for example (how to count bim properties with Power BI in 1 min)
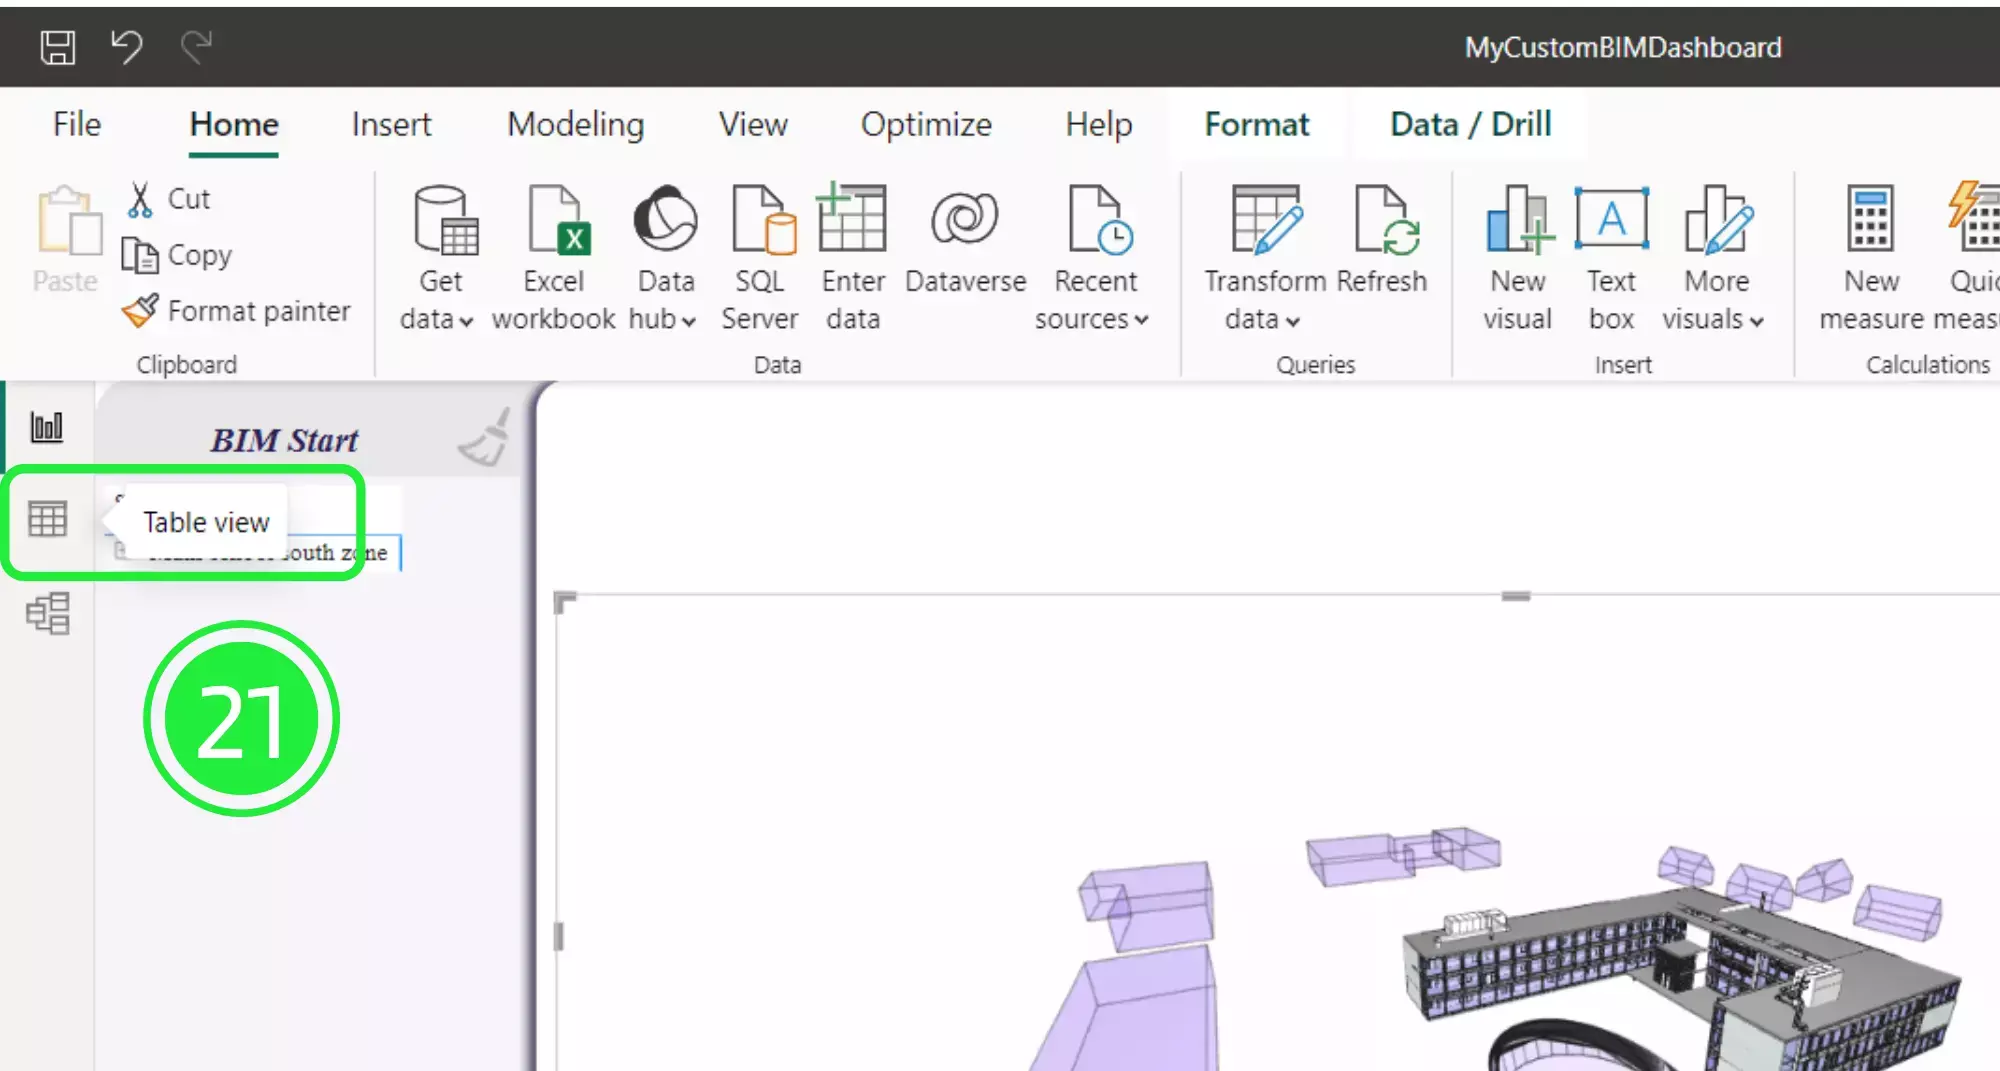
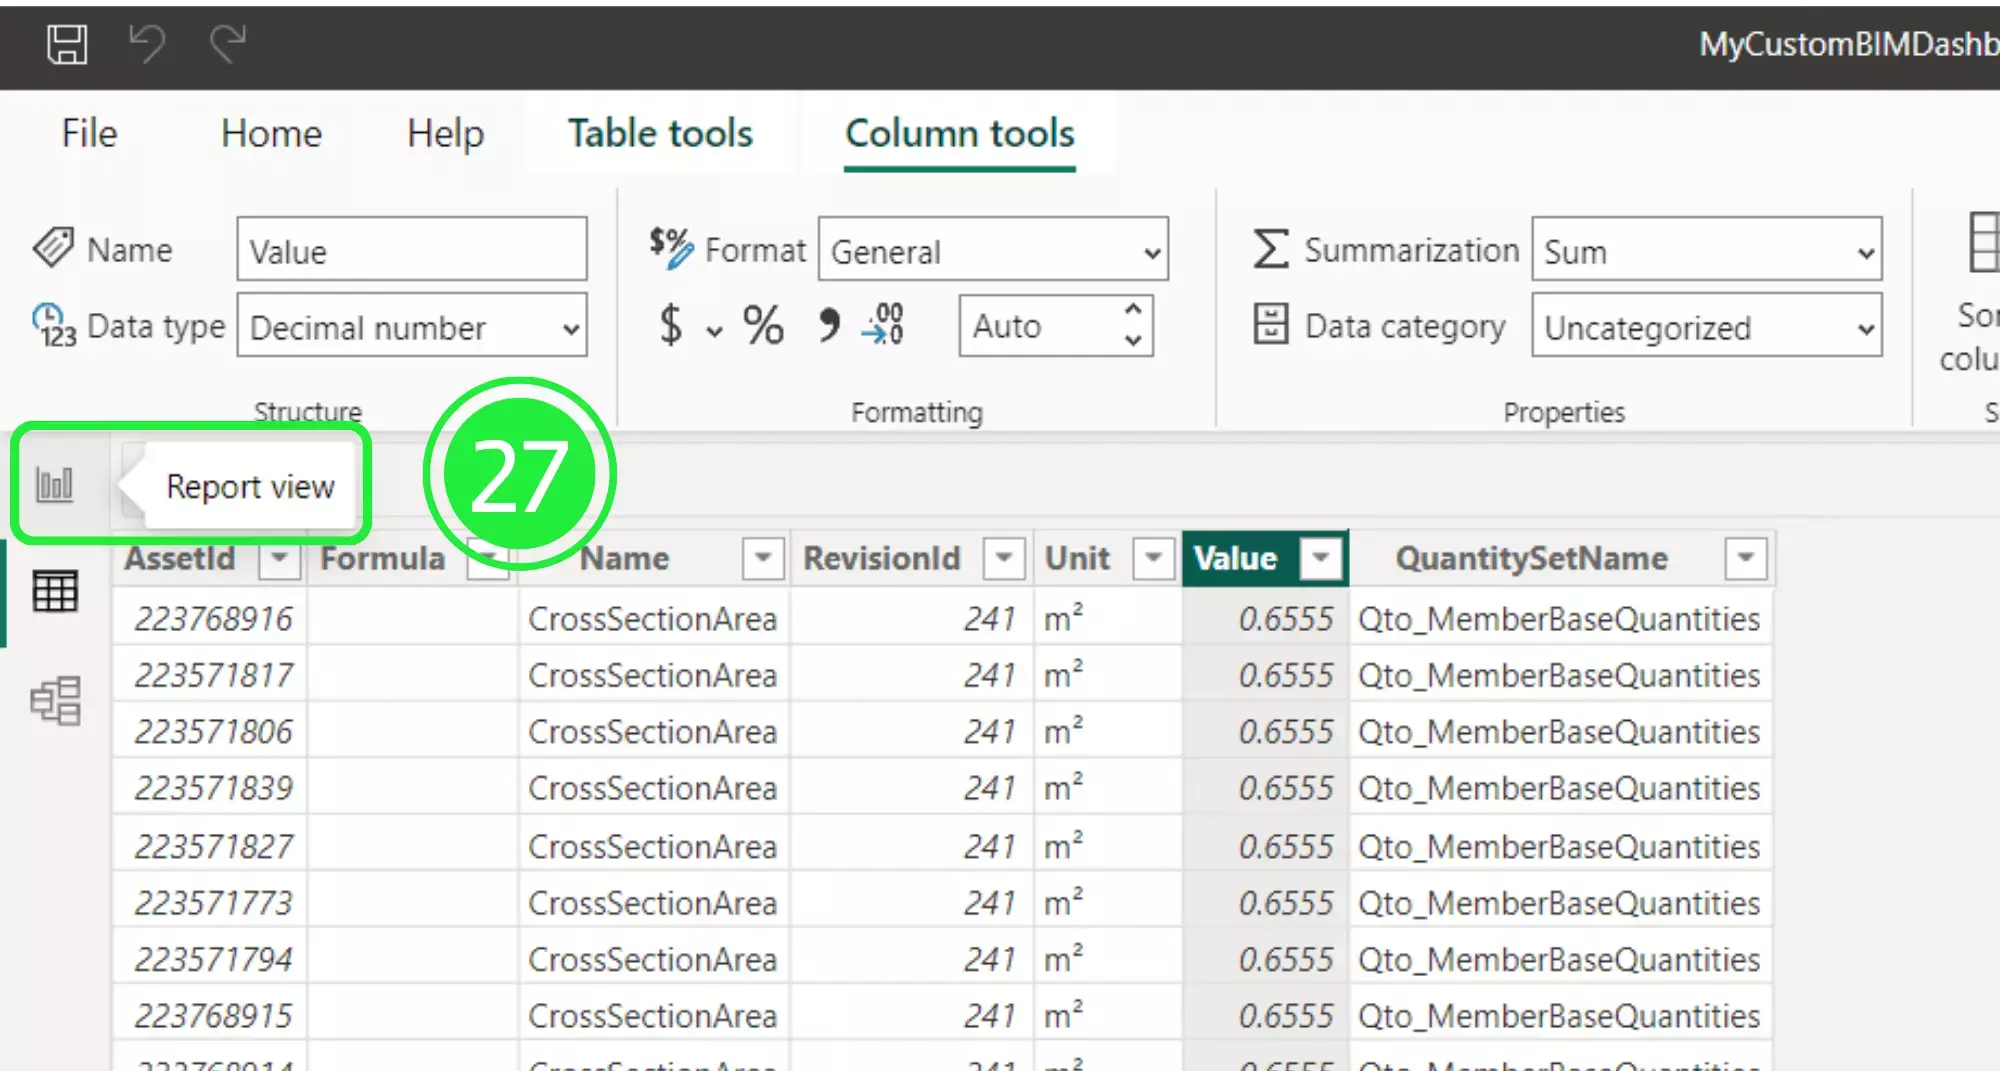
On the left hand side of the report there are several options for viewing the data. Click on the second option, “Table View” in order to display the data as a table.
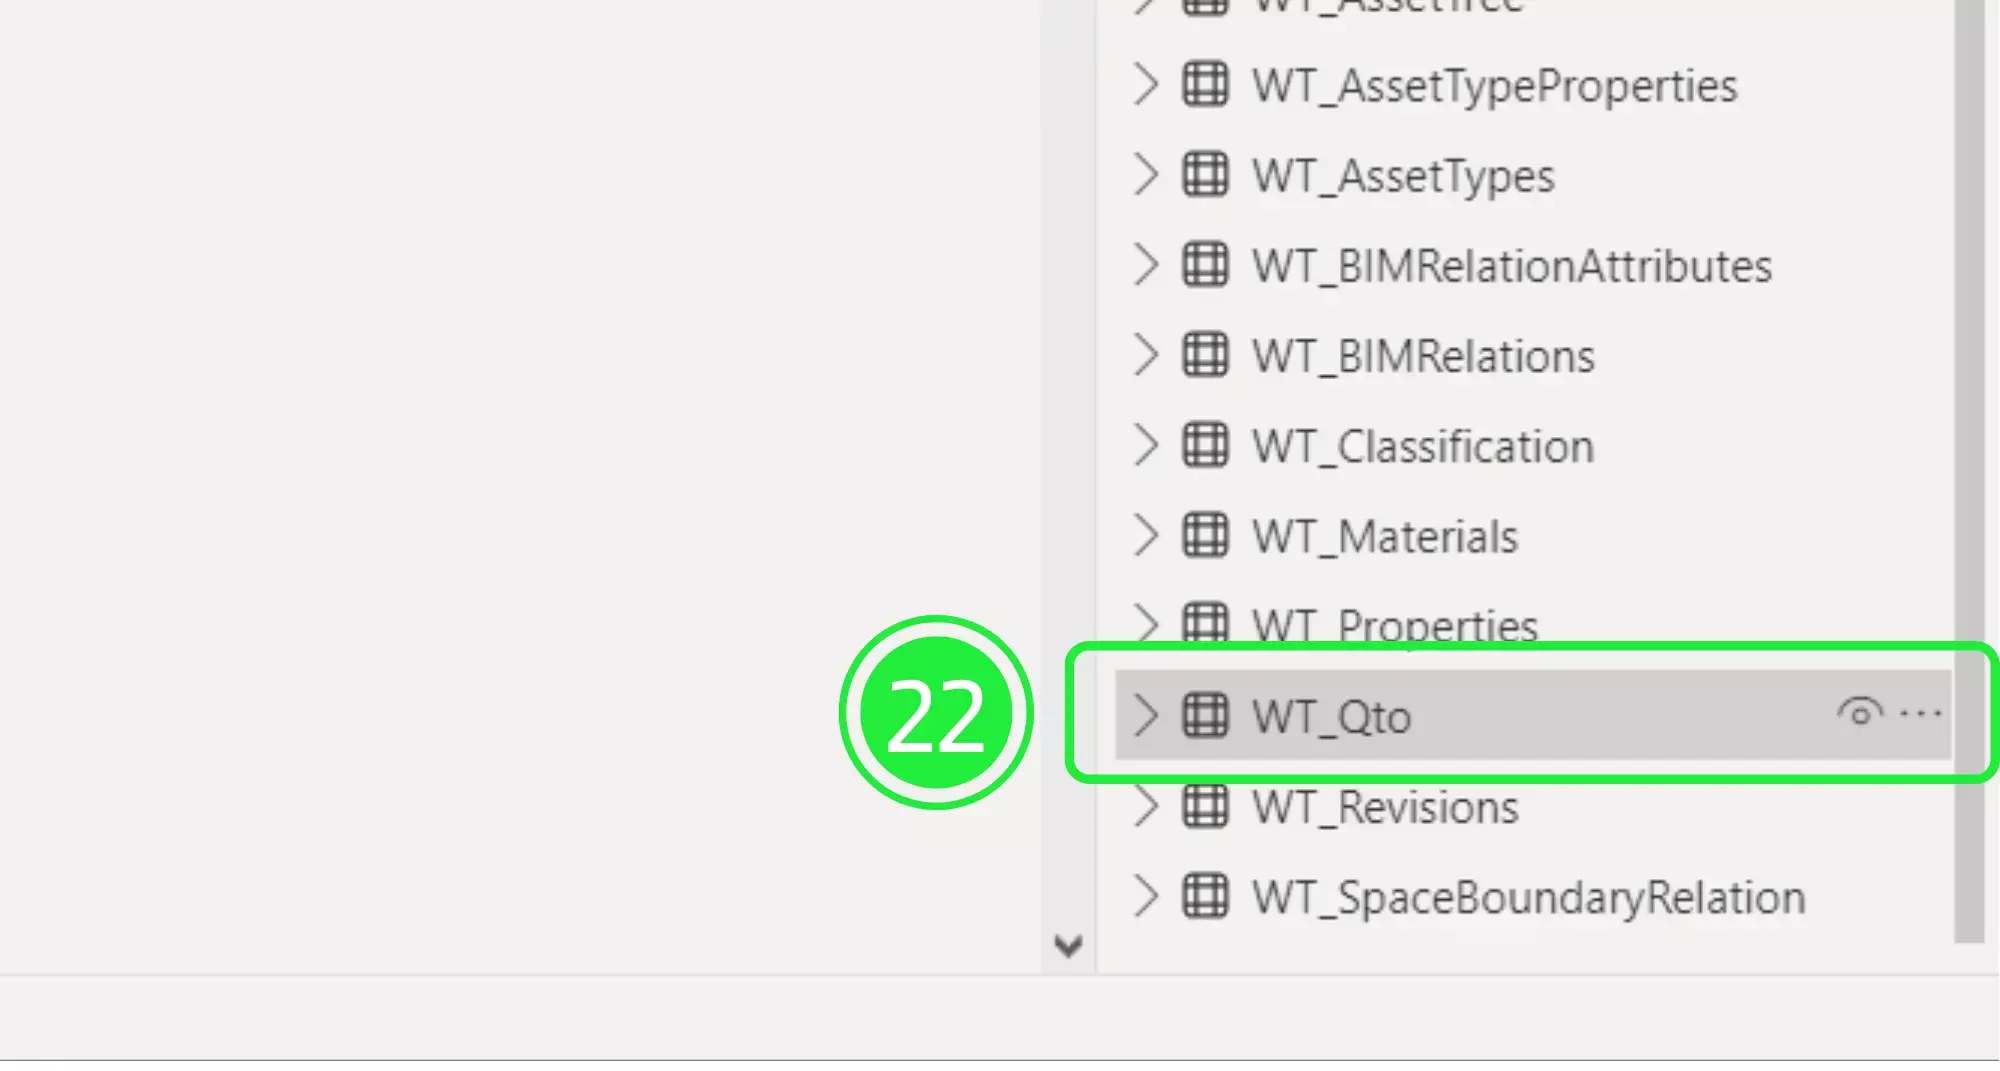
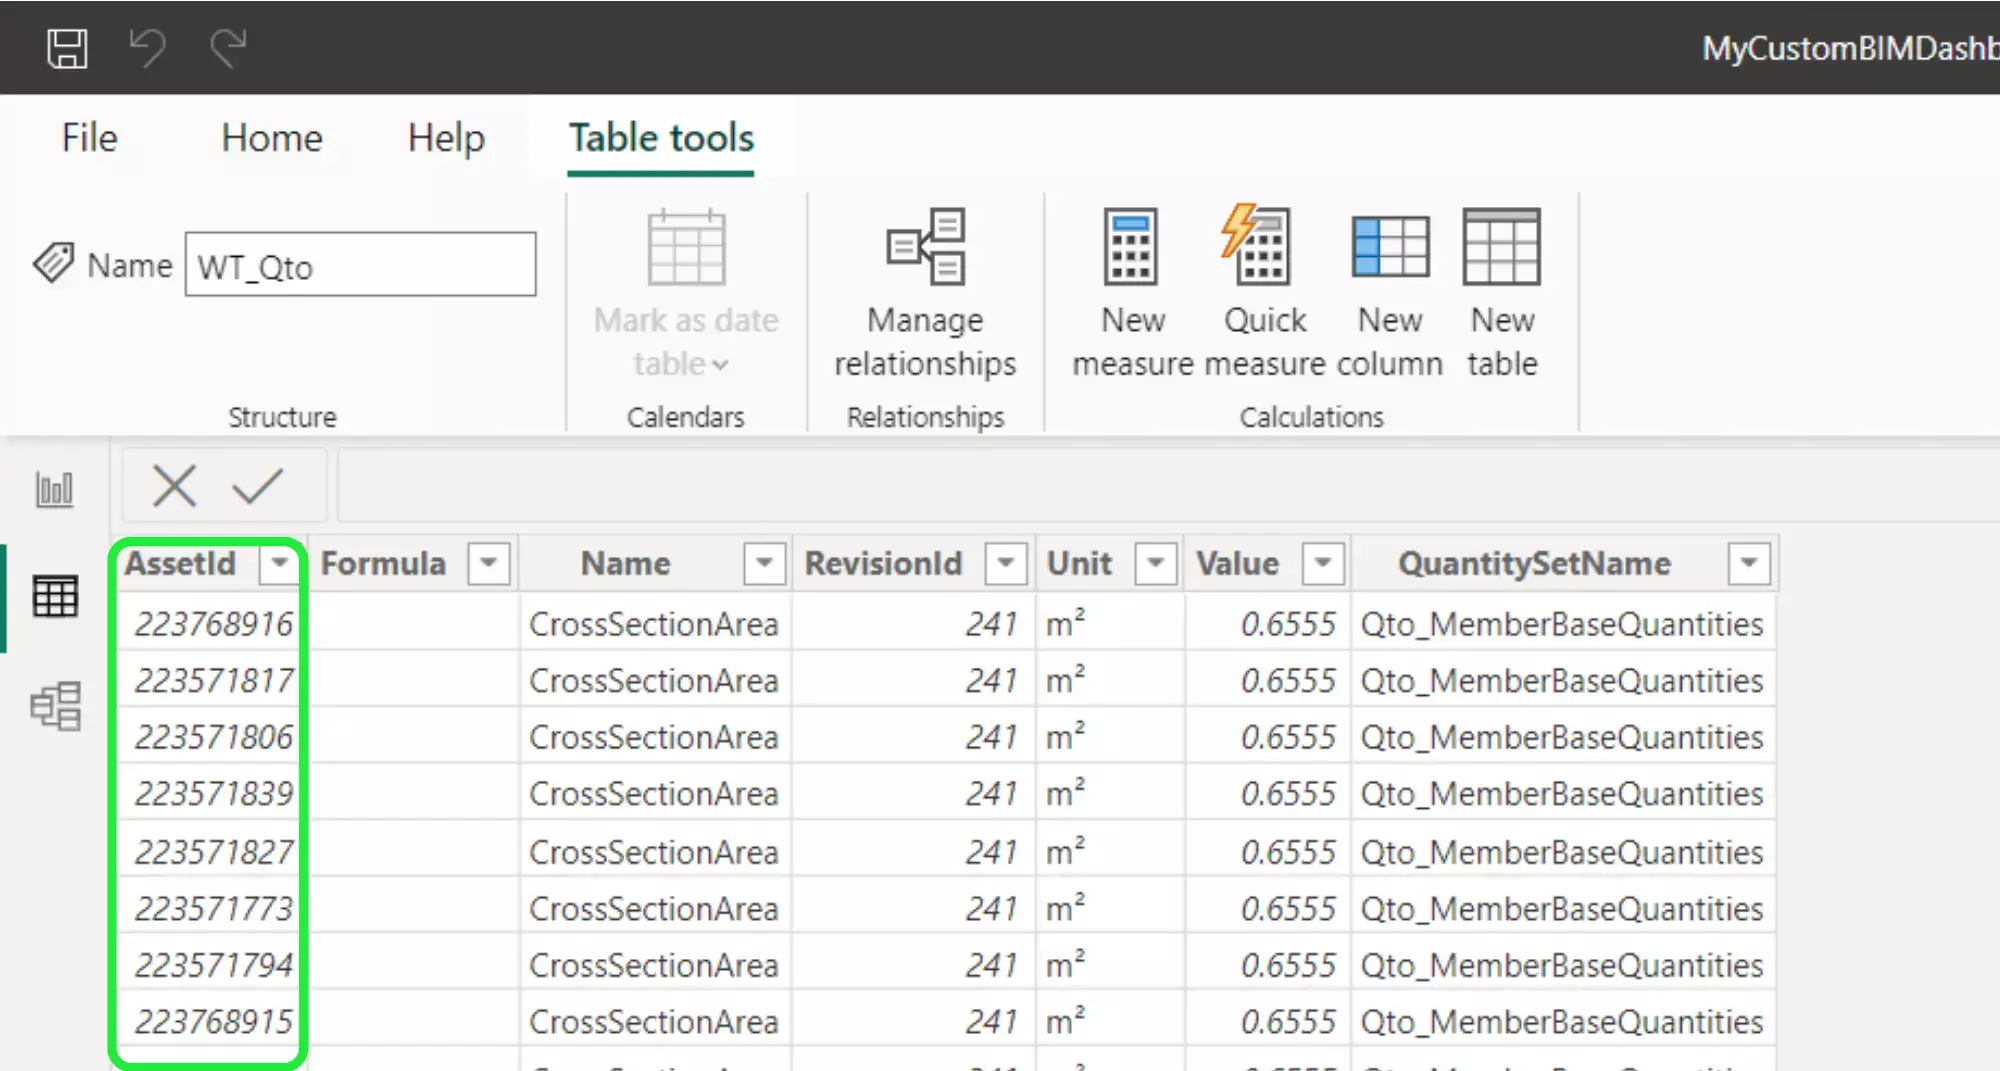
Now, choose a WT_Qto from the list on the right hand side under the Data pane. Now you can view all of the major information about your assets within your BIM Model.
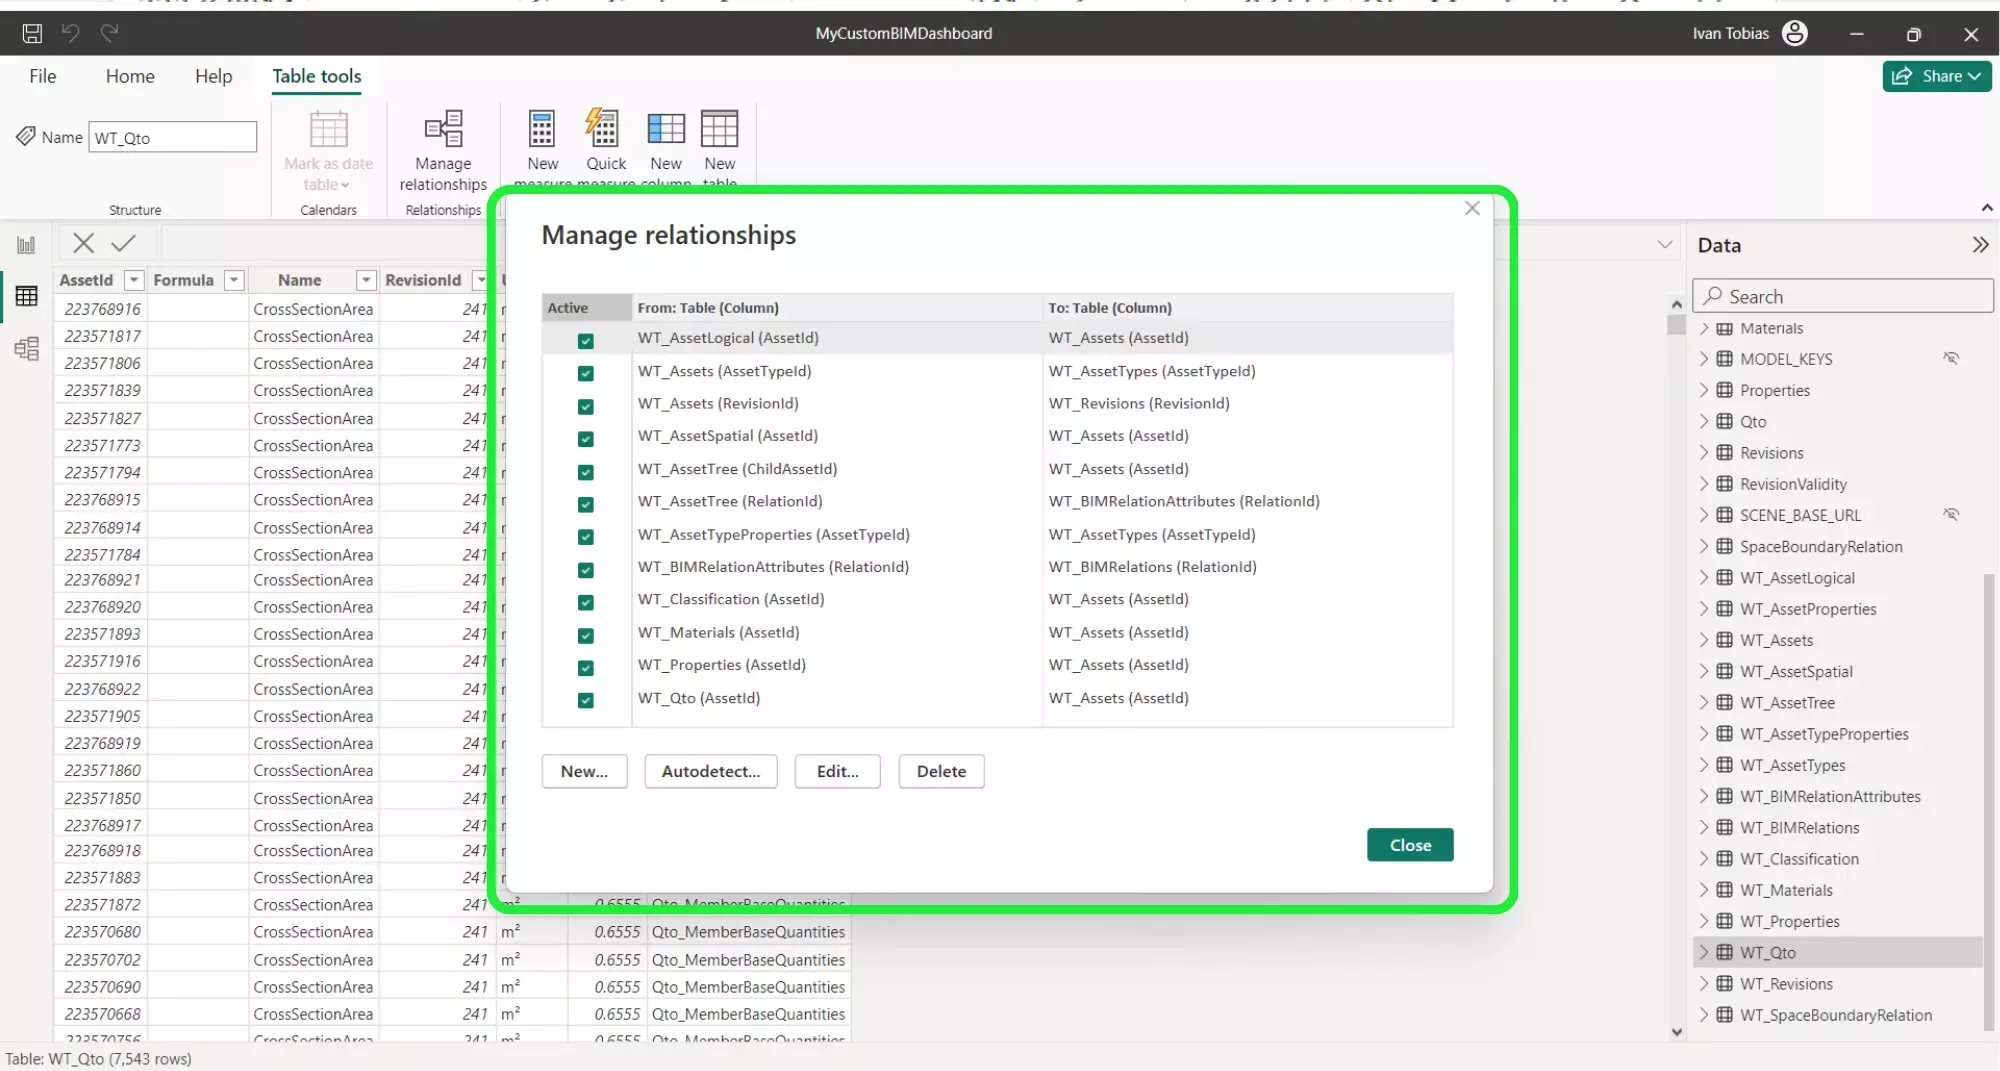
The column ‘Asset ID’ is a common dataset for creating the relationship between WT_QTO and WT_ASSETS.
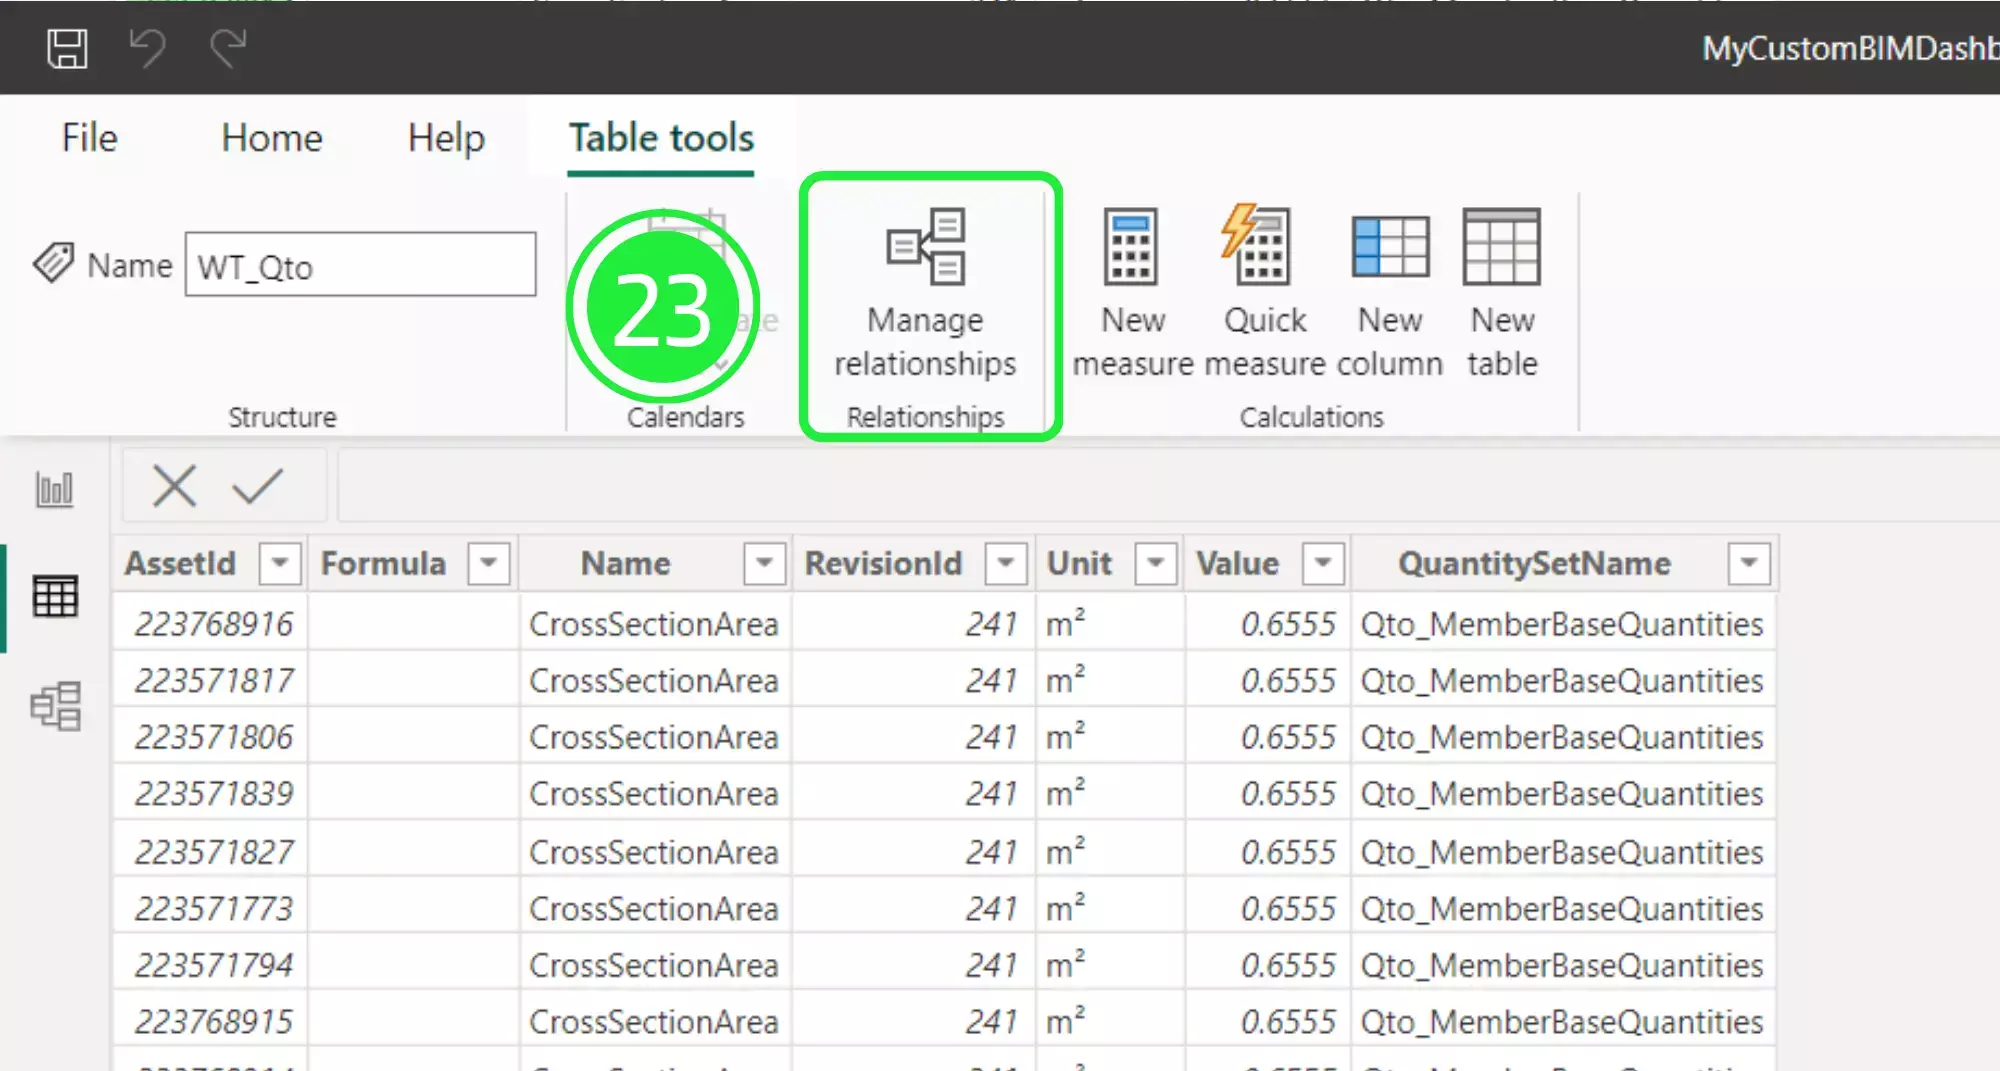
The relationships between the data can be seen by clicking on “Manage Relationships” at the top of the screen.
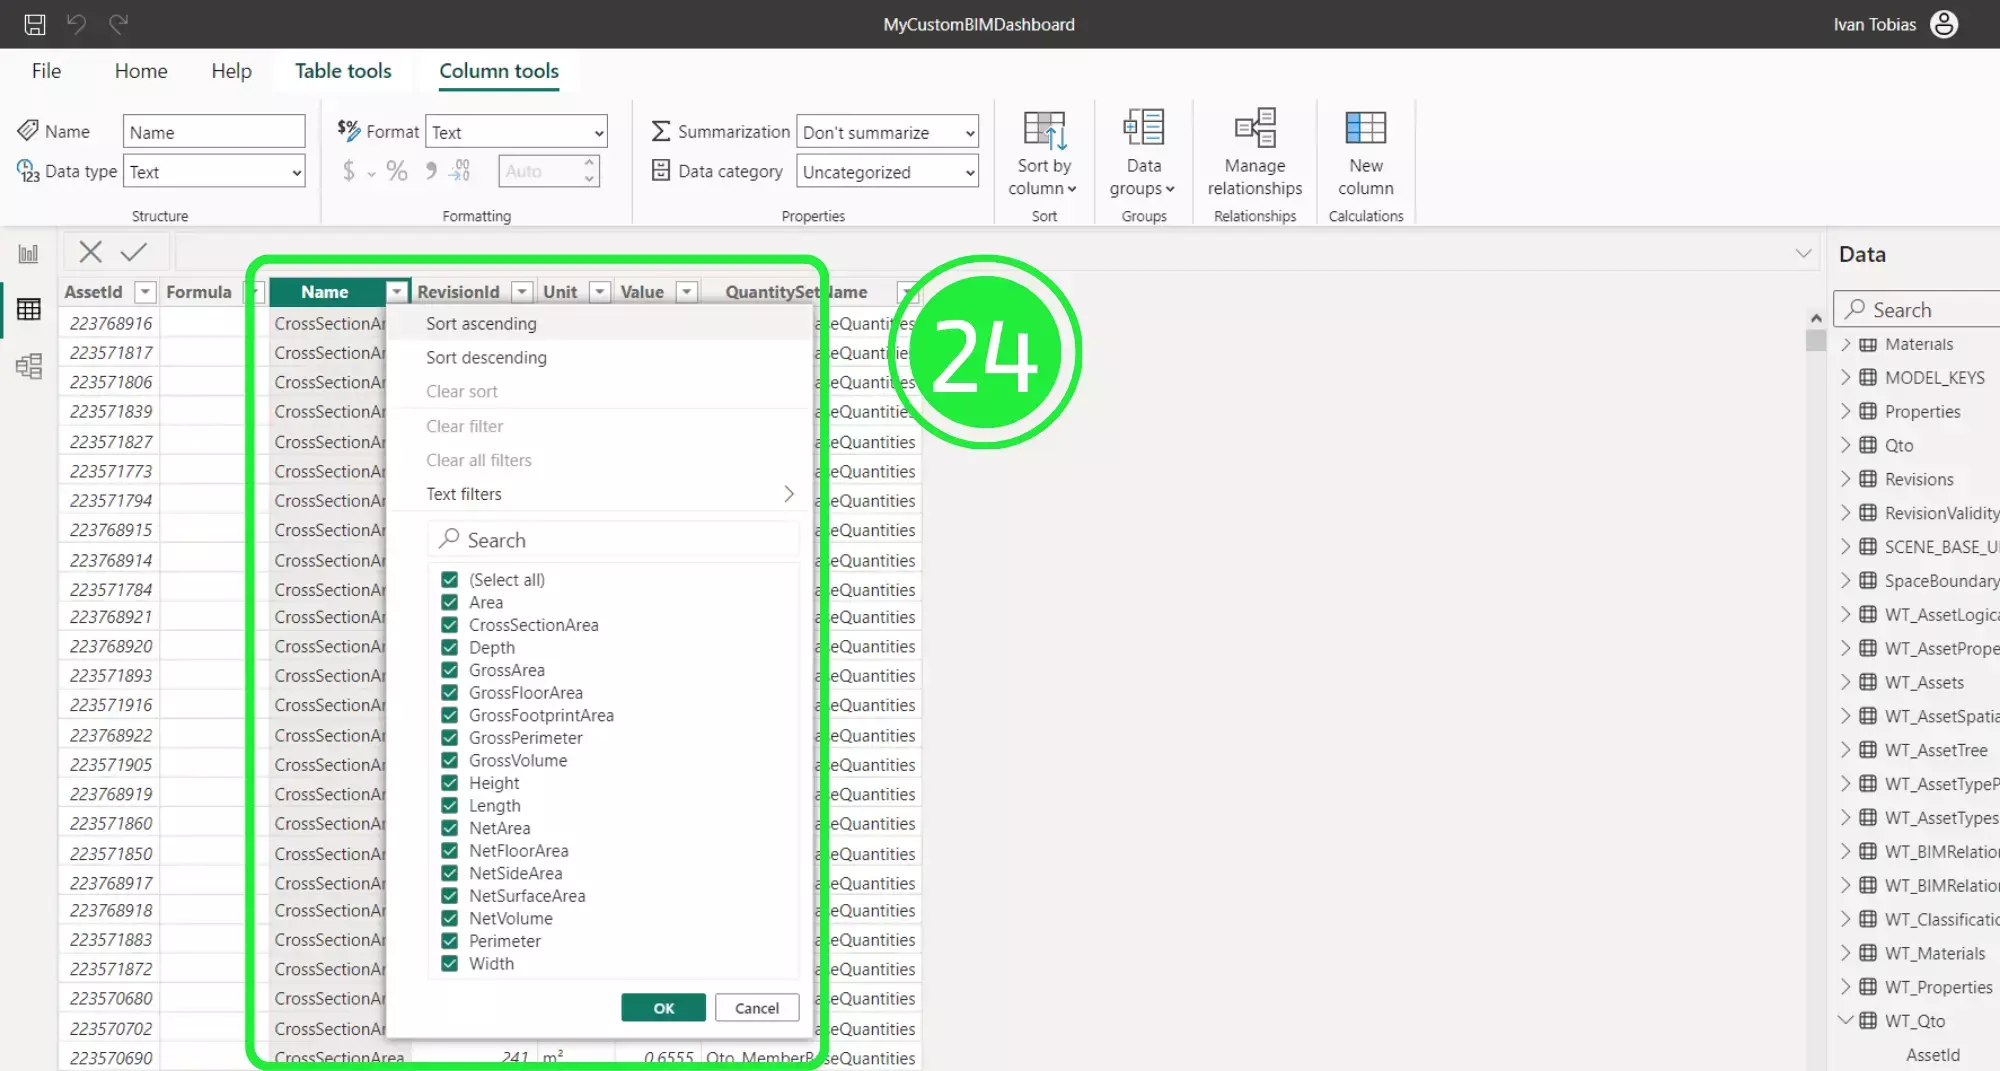
The “Name” column refers to the name or type of the quantity. If you drop the menu down at the side then you’ll see a filter for multiple quantities. This is all the base quantities per class that you will need and it provides more than a correctly exported .ifc can handle.
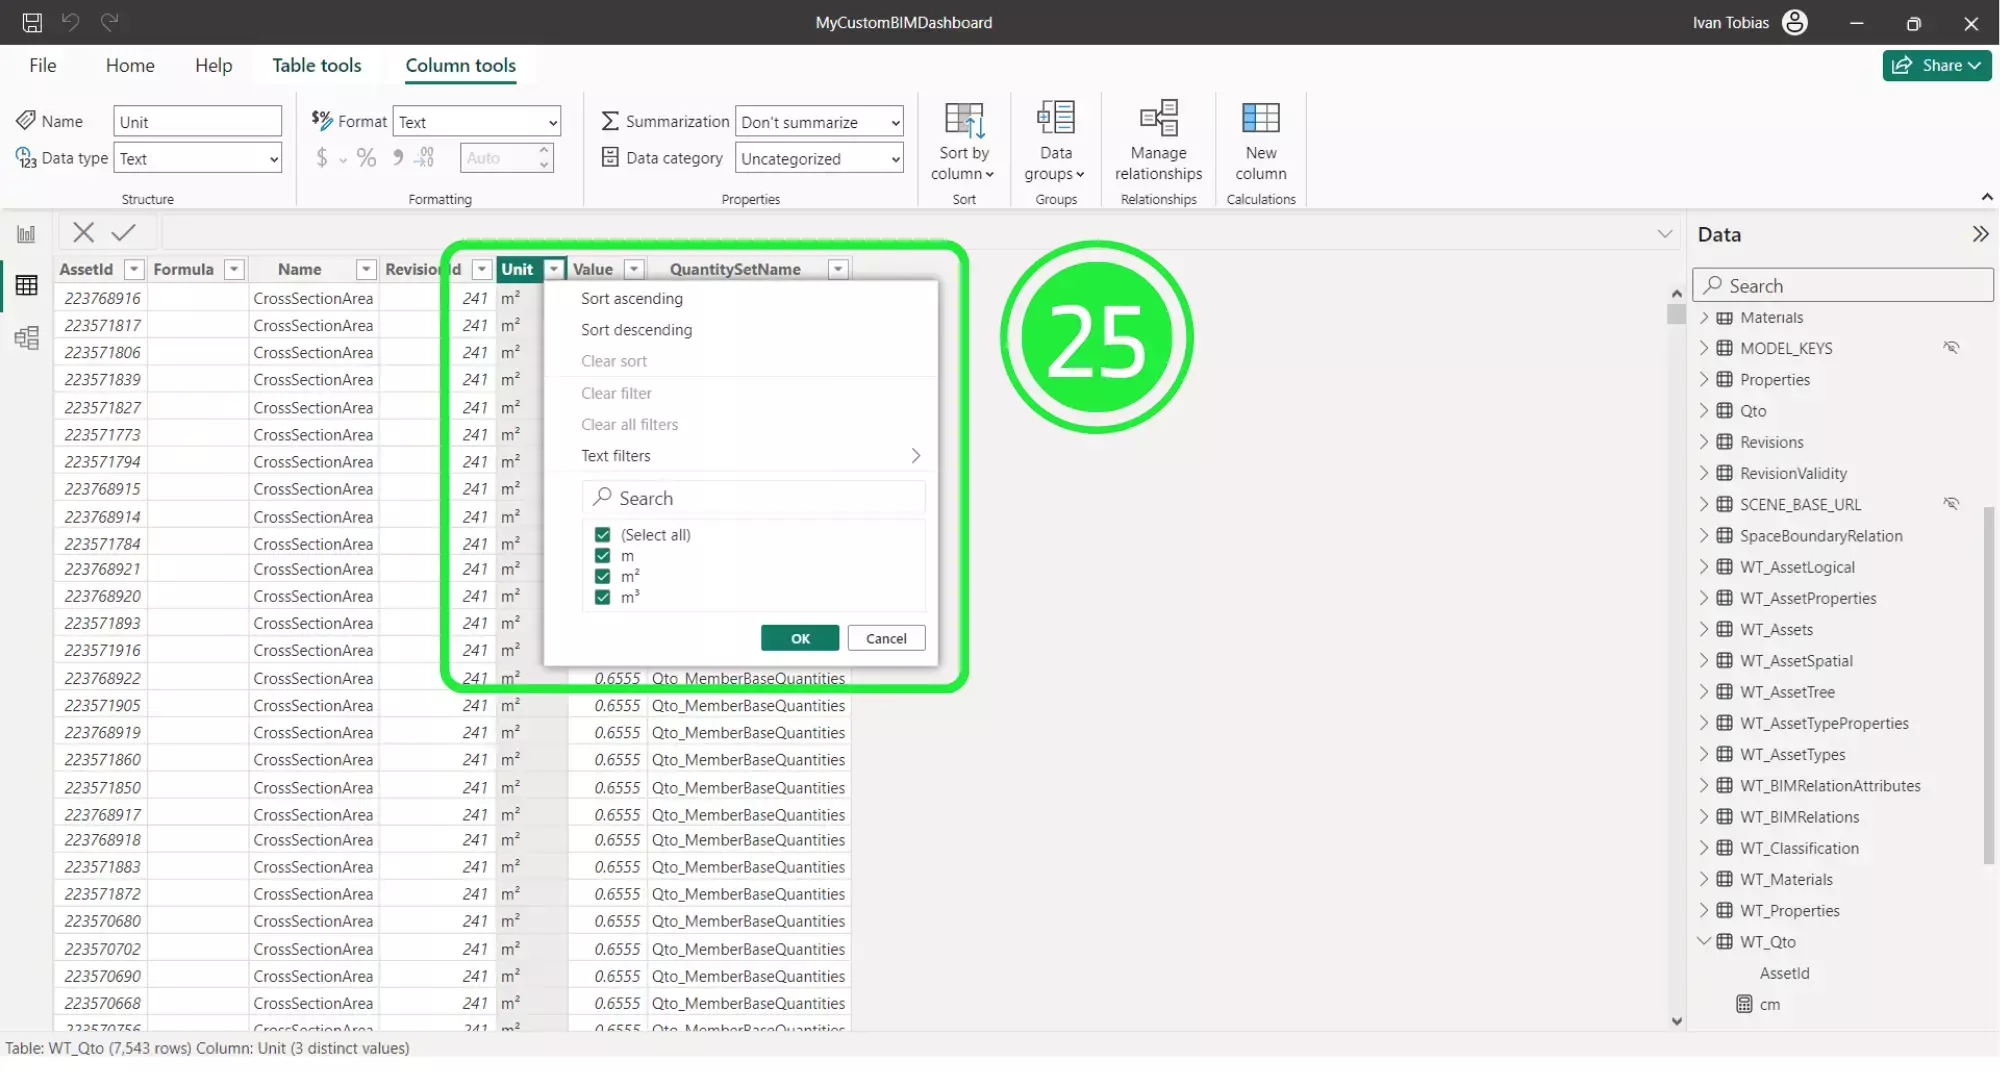
The ‘Unit’ column is an associated unit according to the quantity name. If you click on the drop down menu then you’ll be able to filter the data.
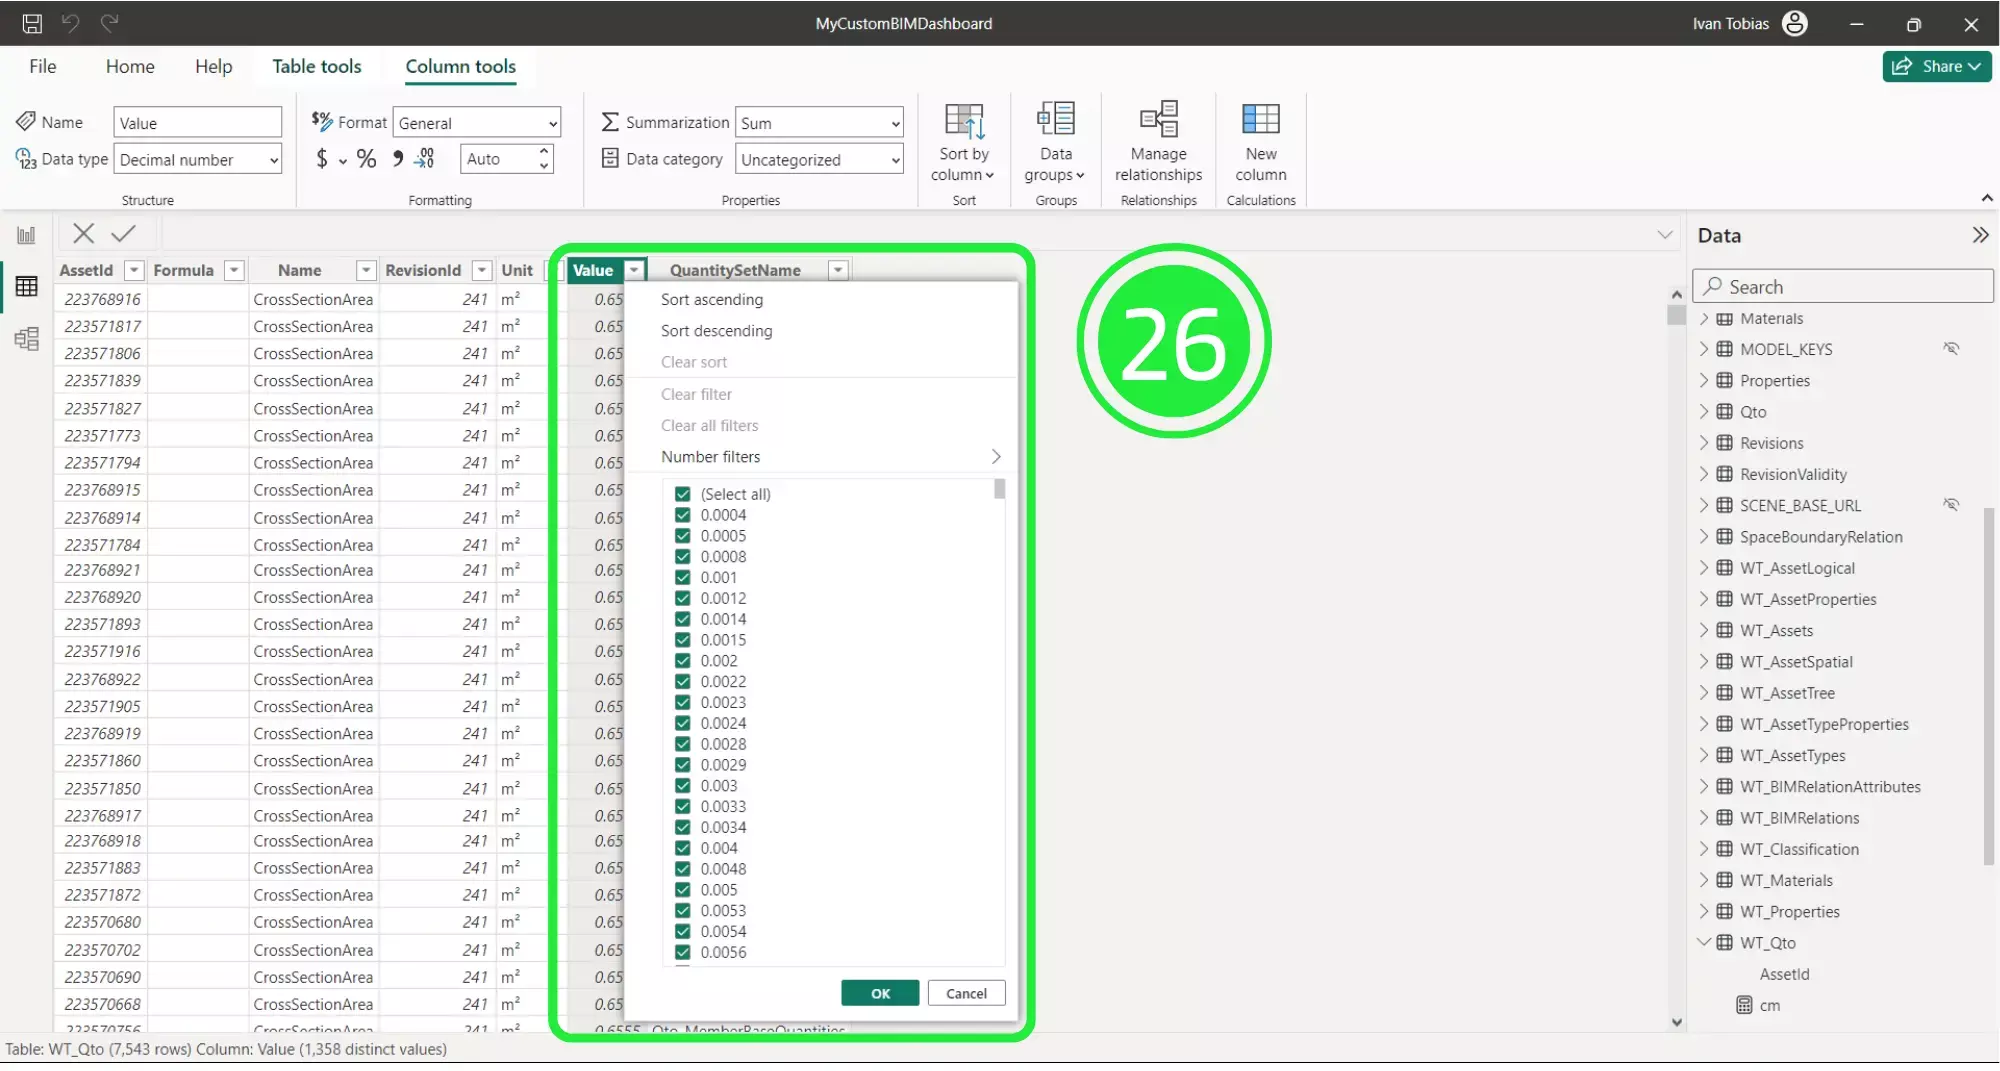
The “Value” column gives you the precise measurements relating to the Quantity “Name”.
Click on “Report View” on the left-hand side of the screen to go back to the dashboard and see progress in optimizing space area per level with SeveUp BIM data.
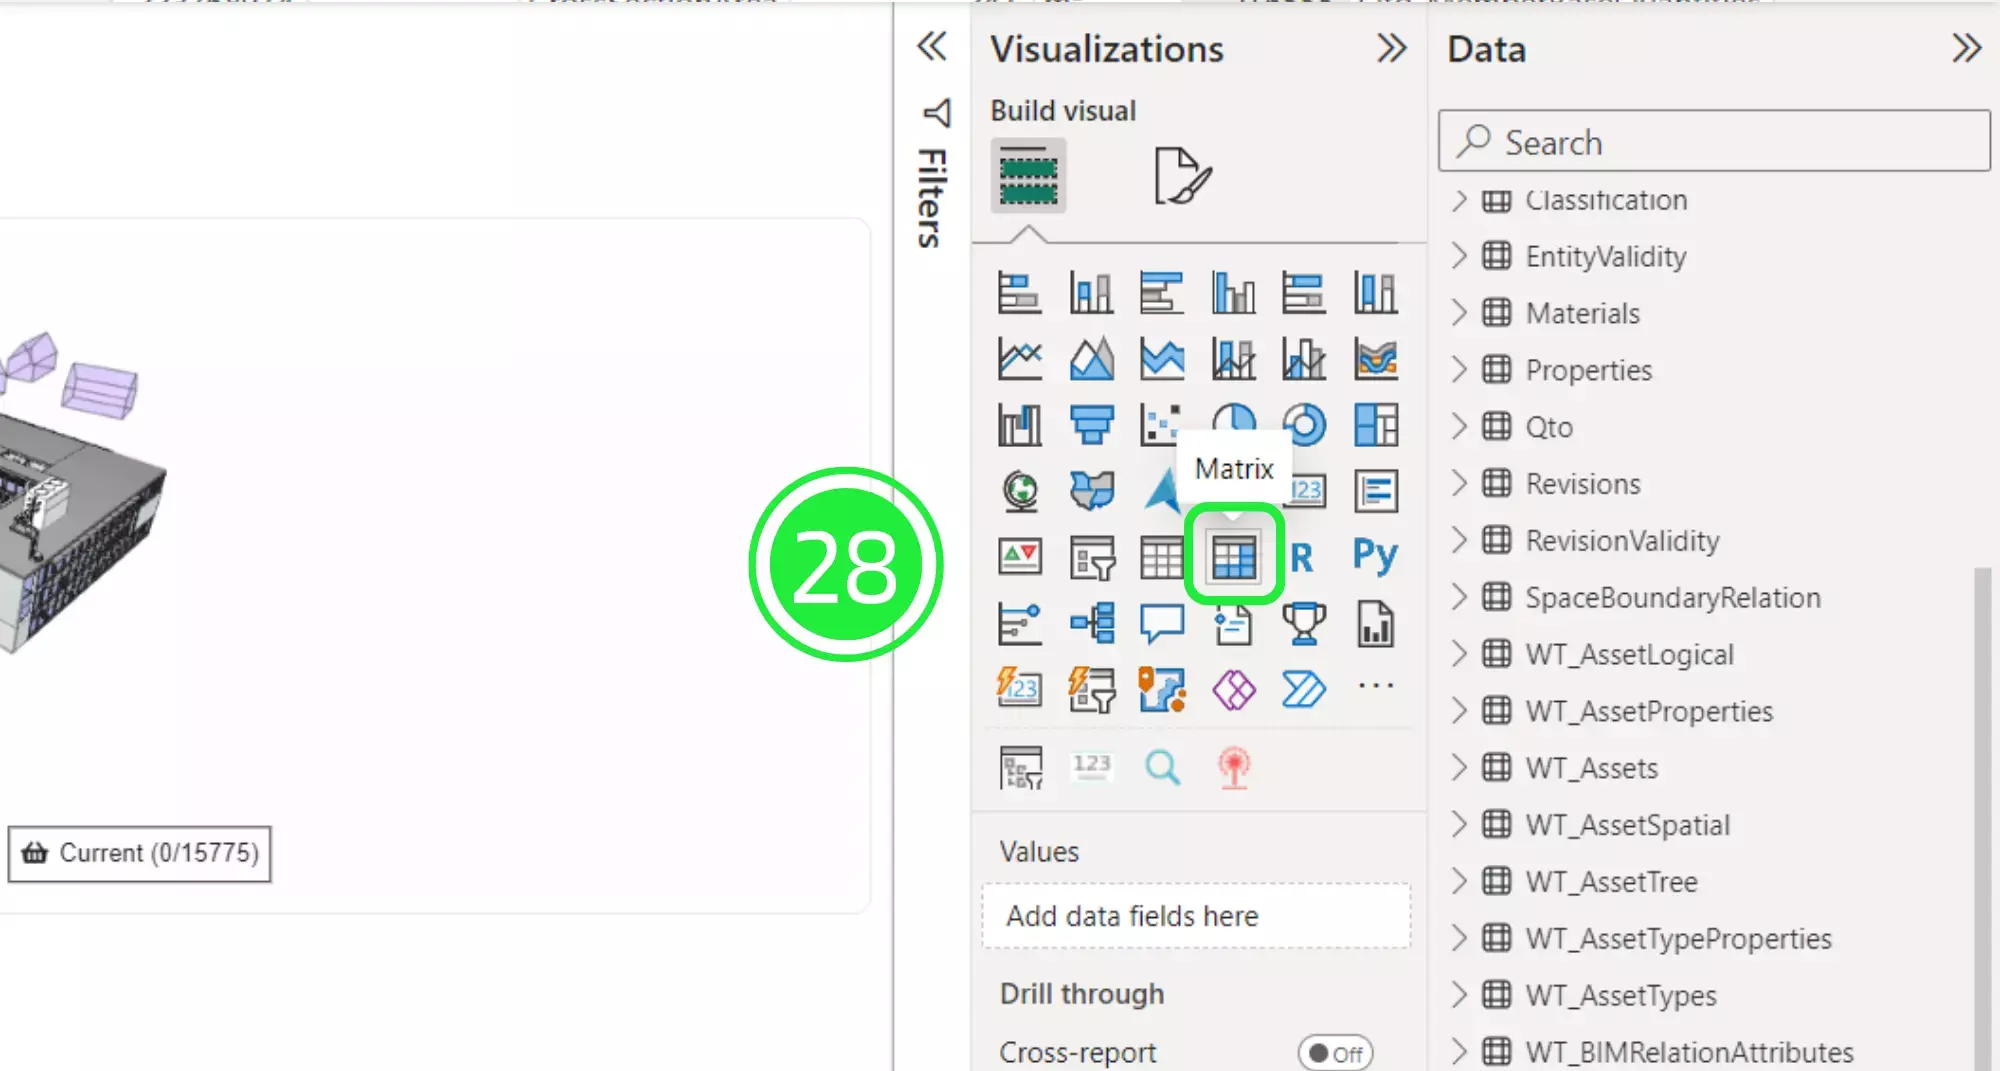
On the right hand side of the Power BI Interface is the ‘Visualisations’ pane. Click on the ‘Matrix’ button to add the visual to your dashboard.
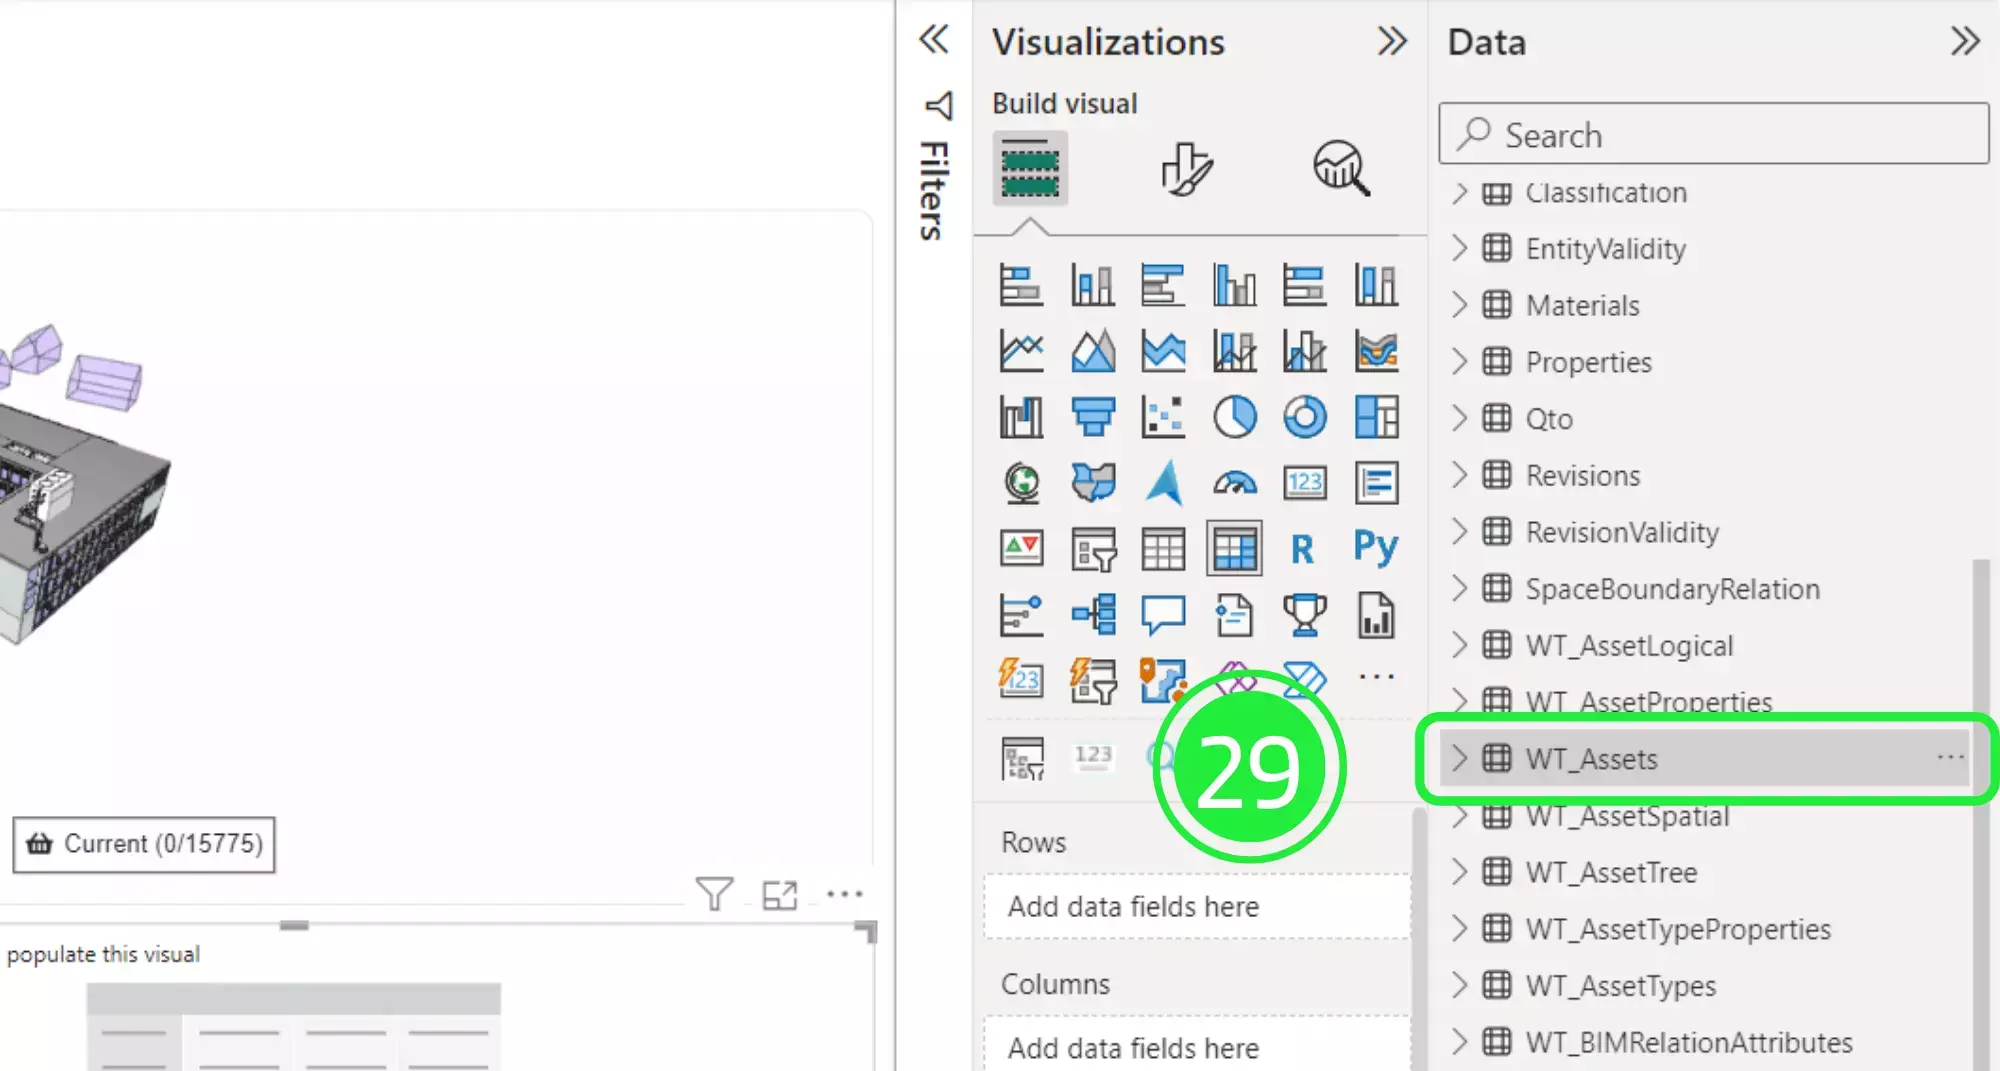
Under the Data pane, click on the drop down button on “WT_Assets” to expand the menu.
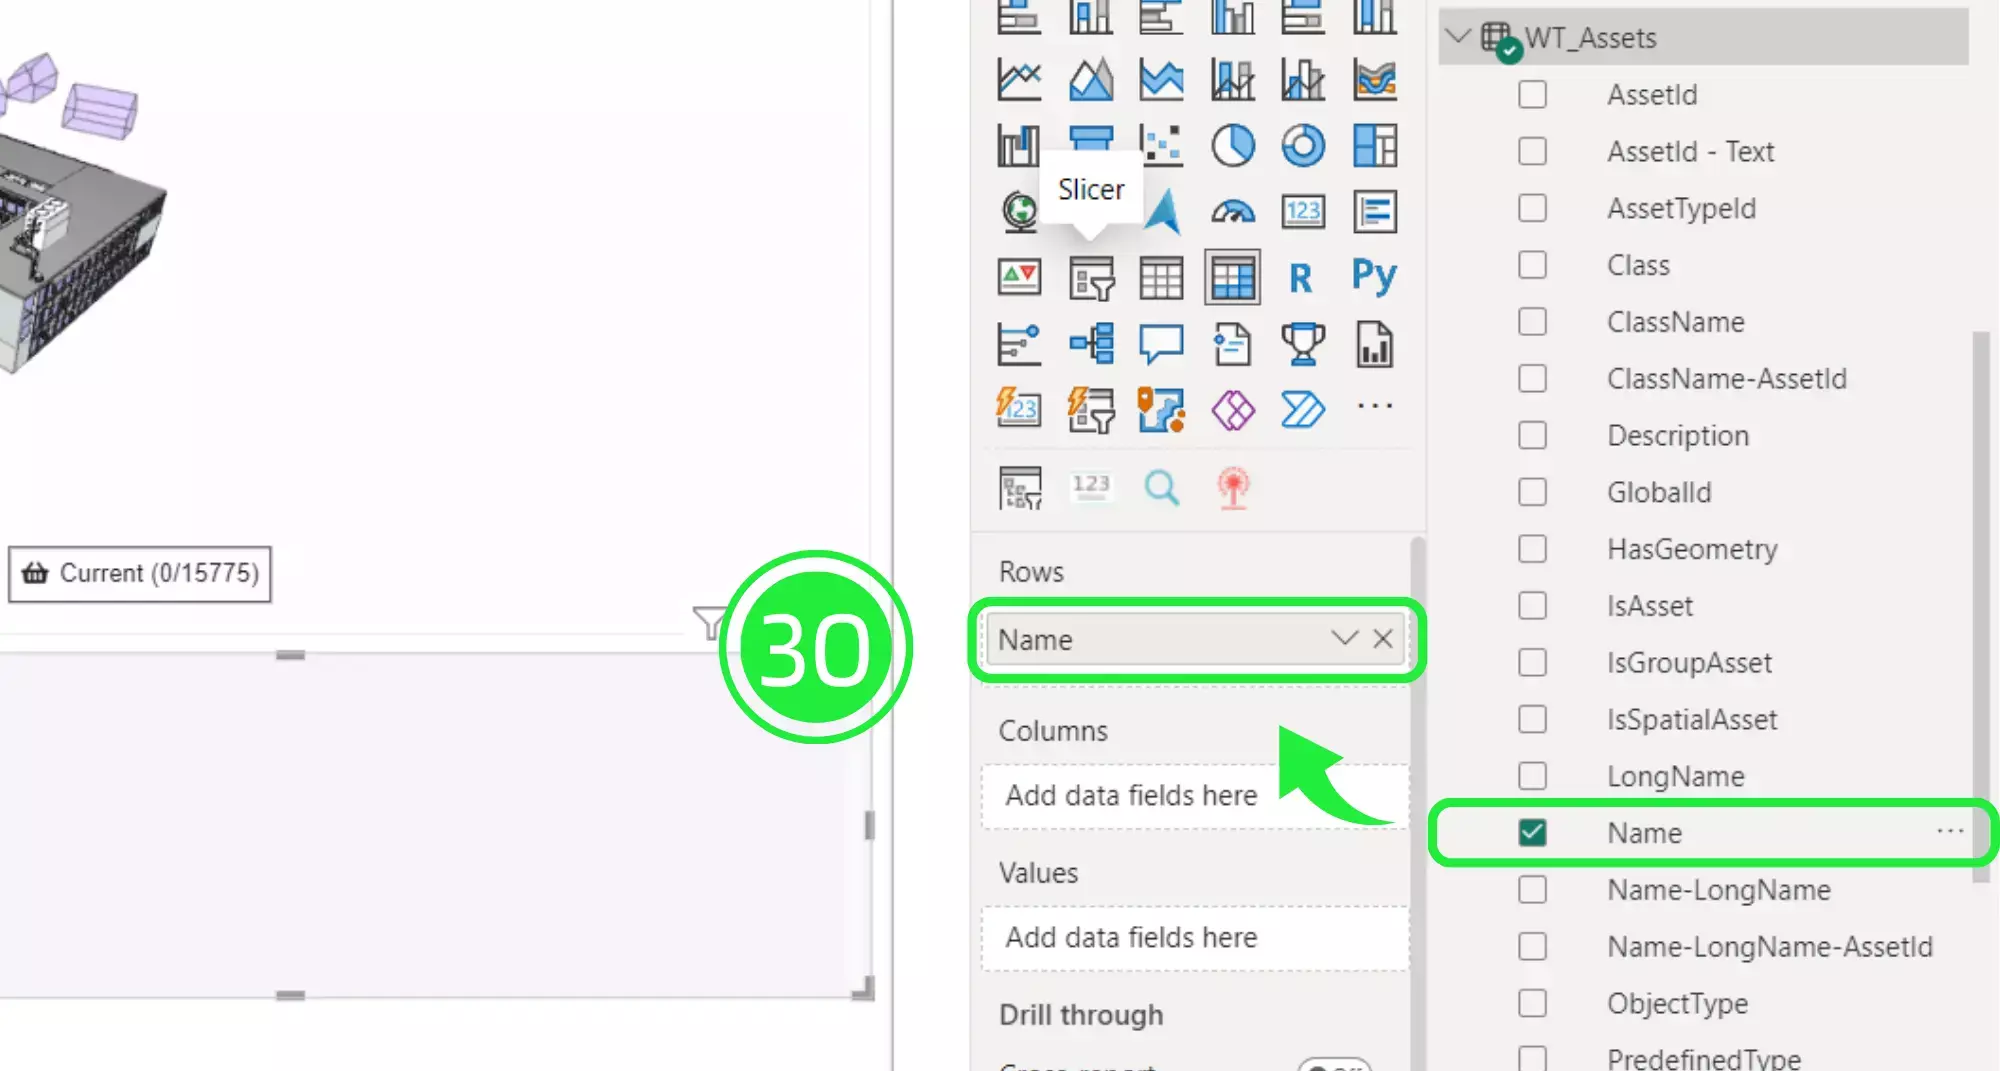
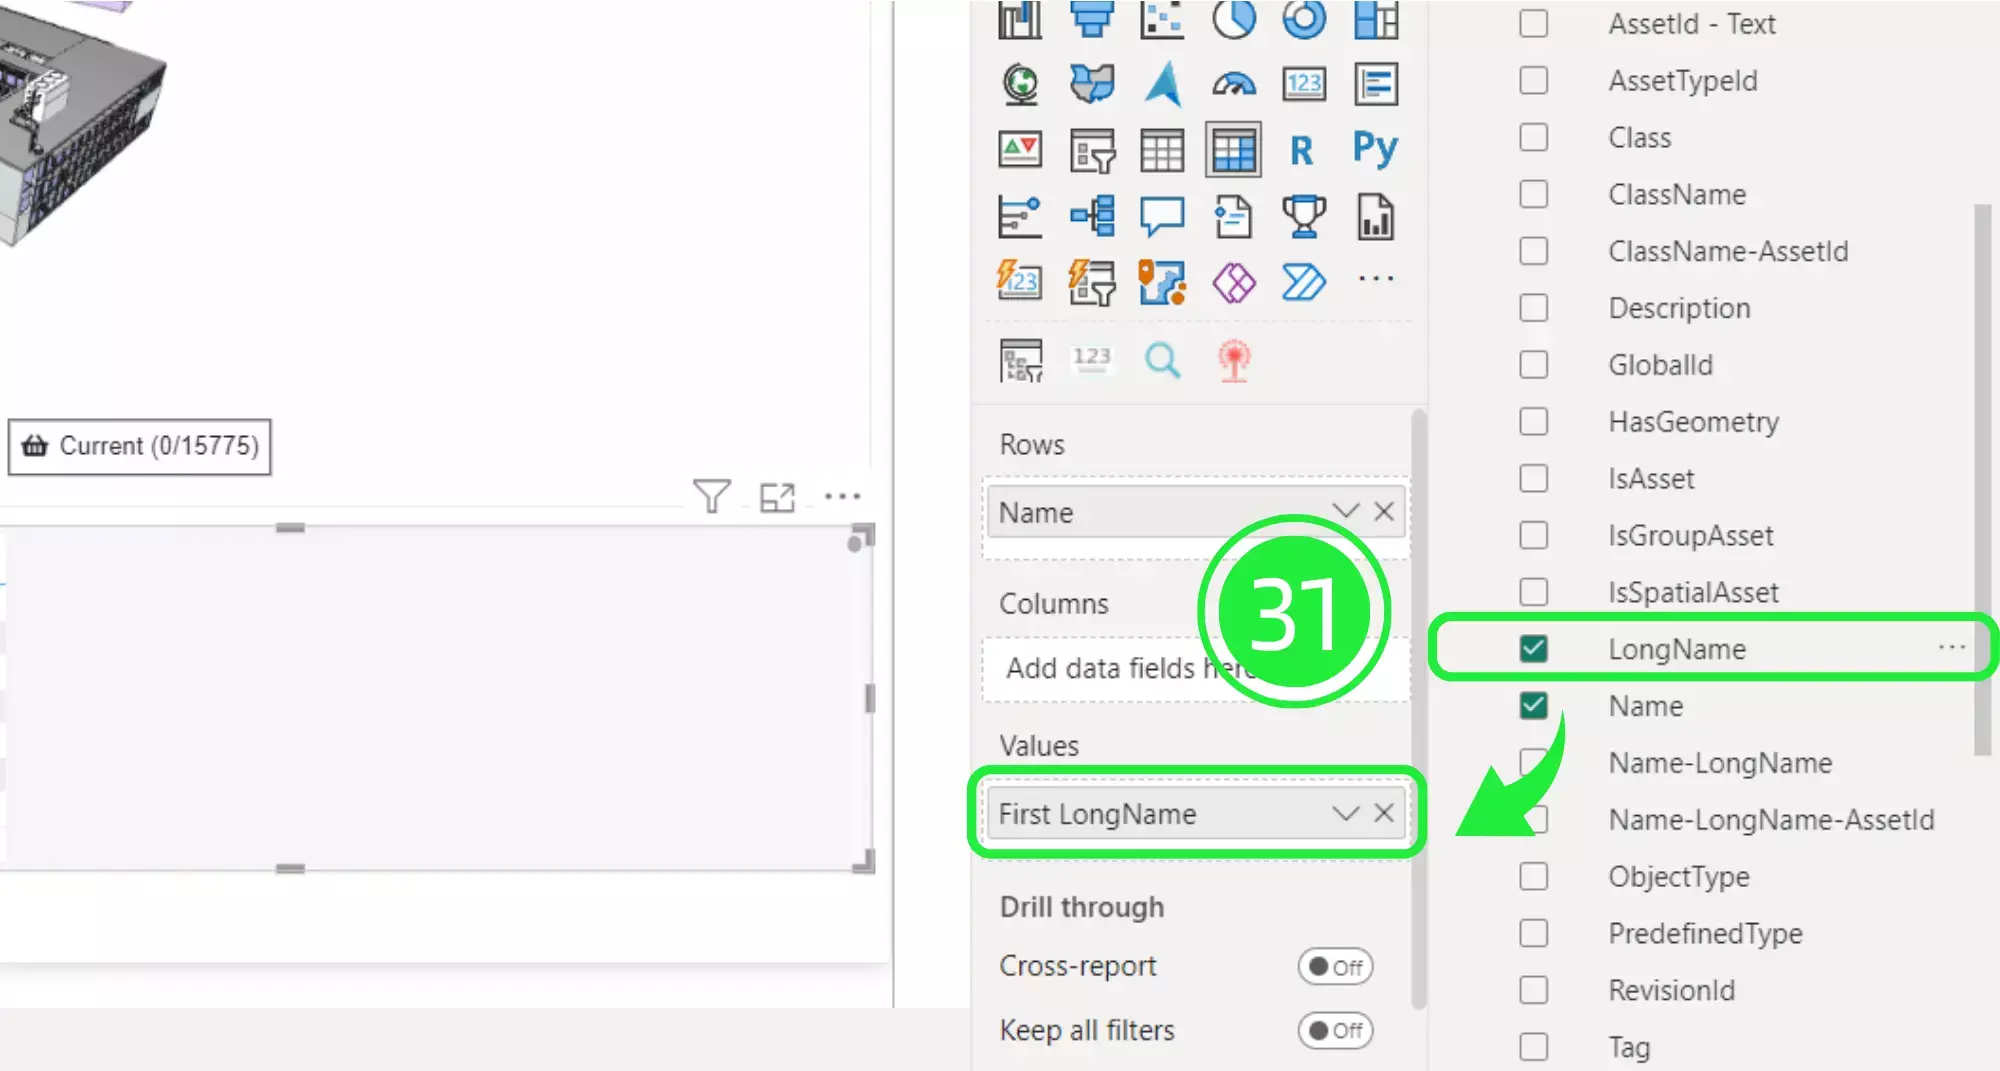
Drag and drop “Name” over to the “Rows” field under “Add data to my visual”.
Drag and drop “LongName” over to the “Values” field under “Add data to my visual”.
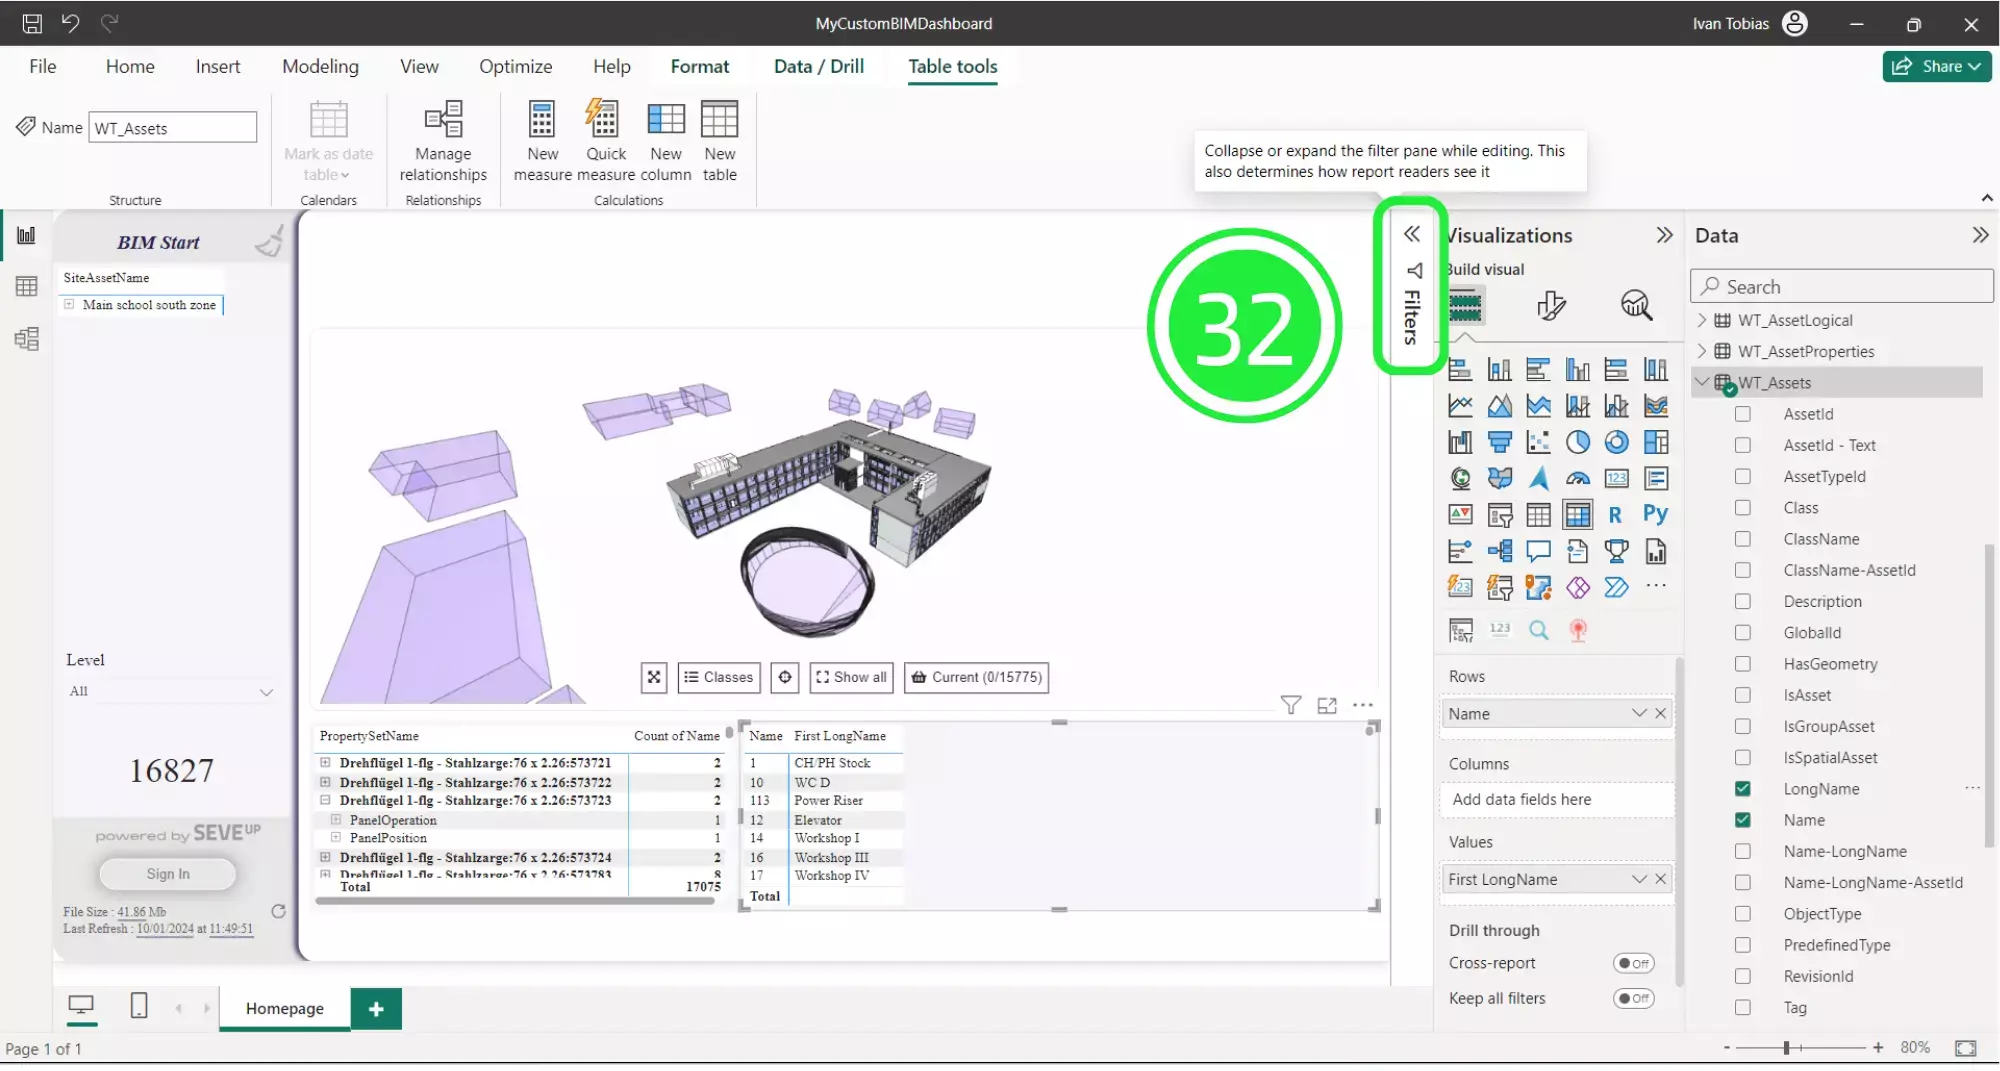
Click to expand the “Filters” pane that is located next to the “Visualisations” pane.
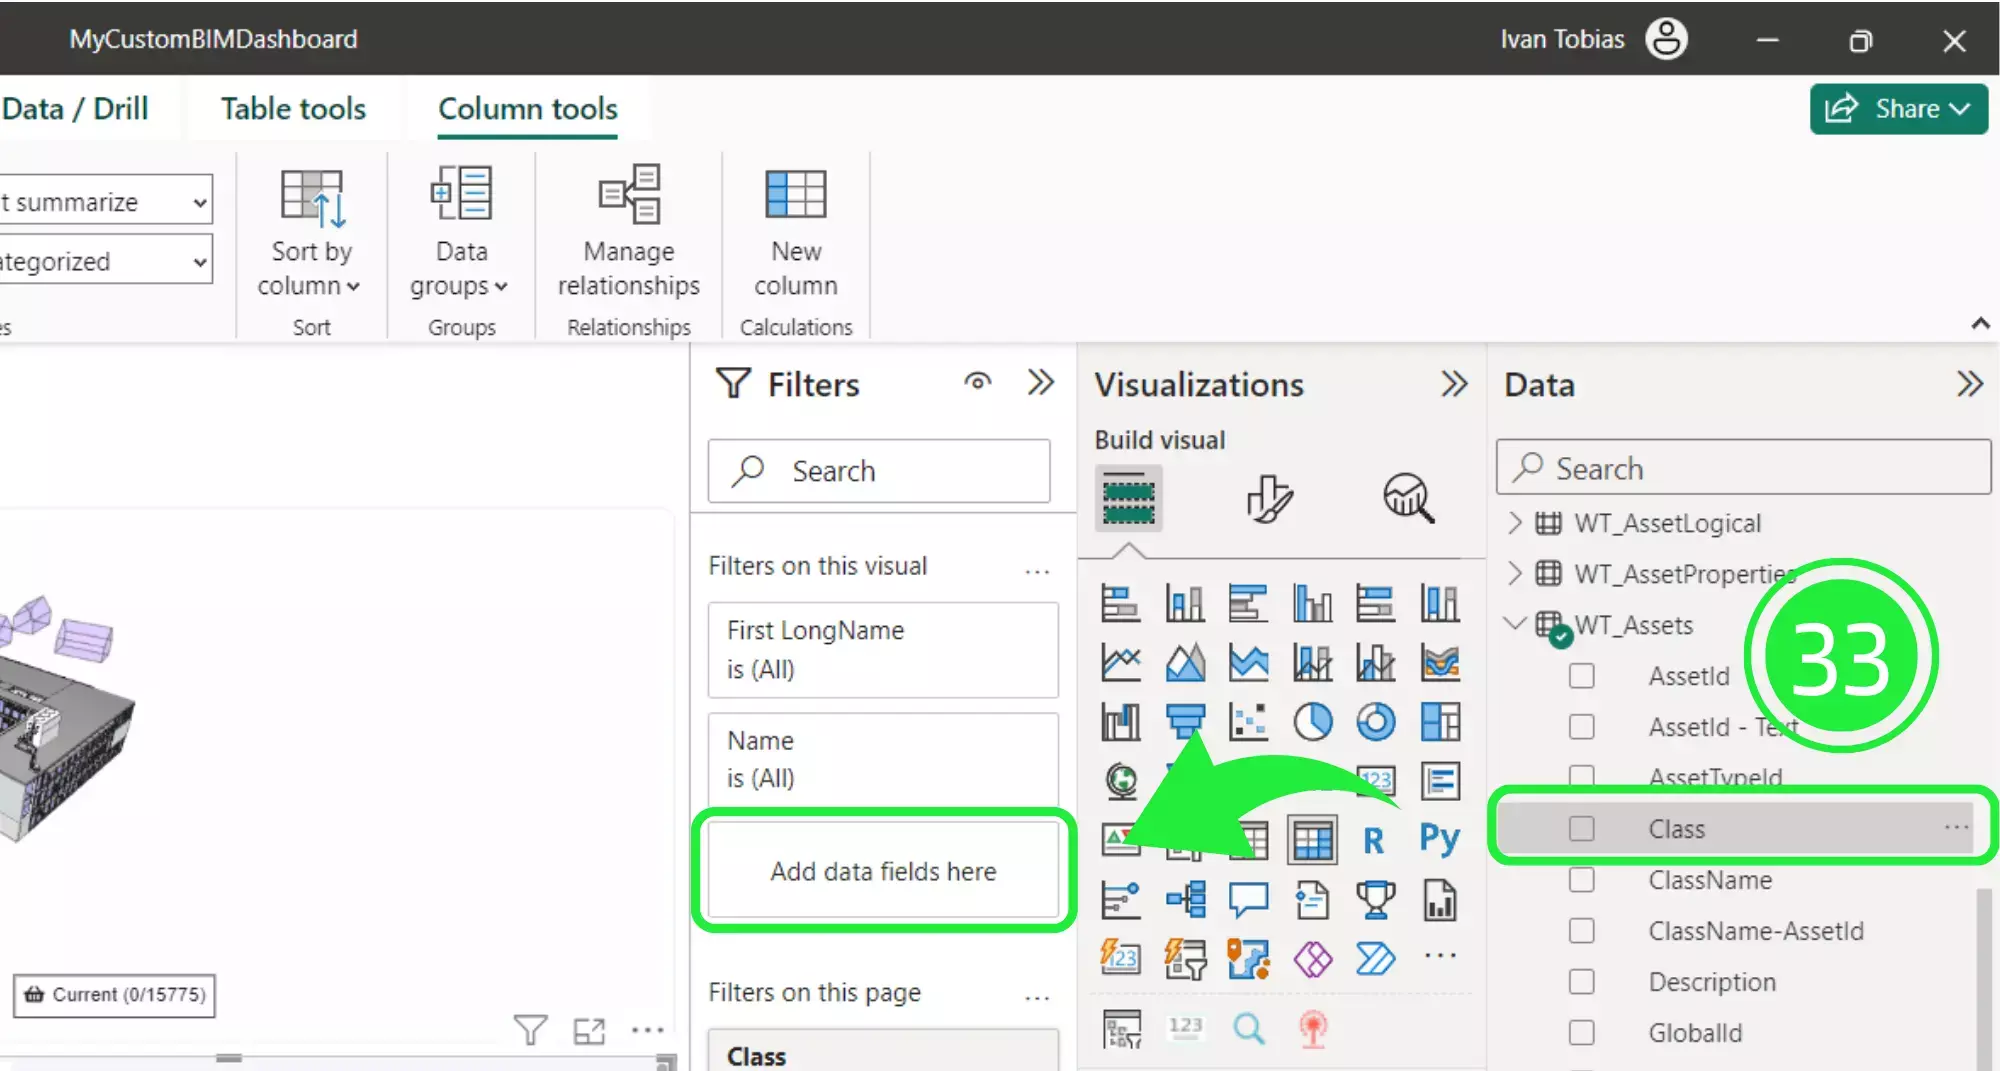
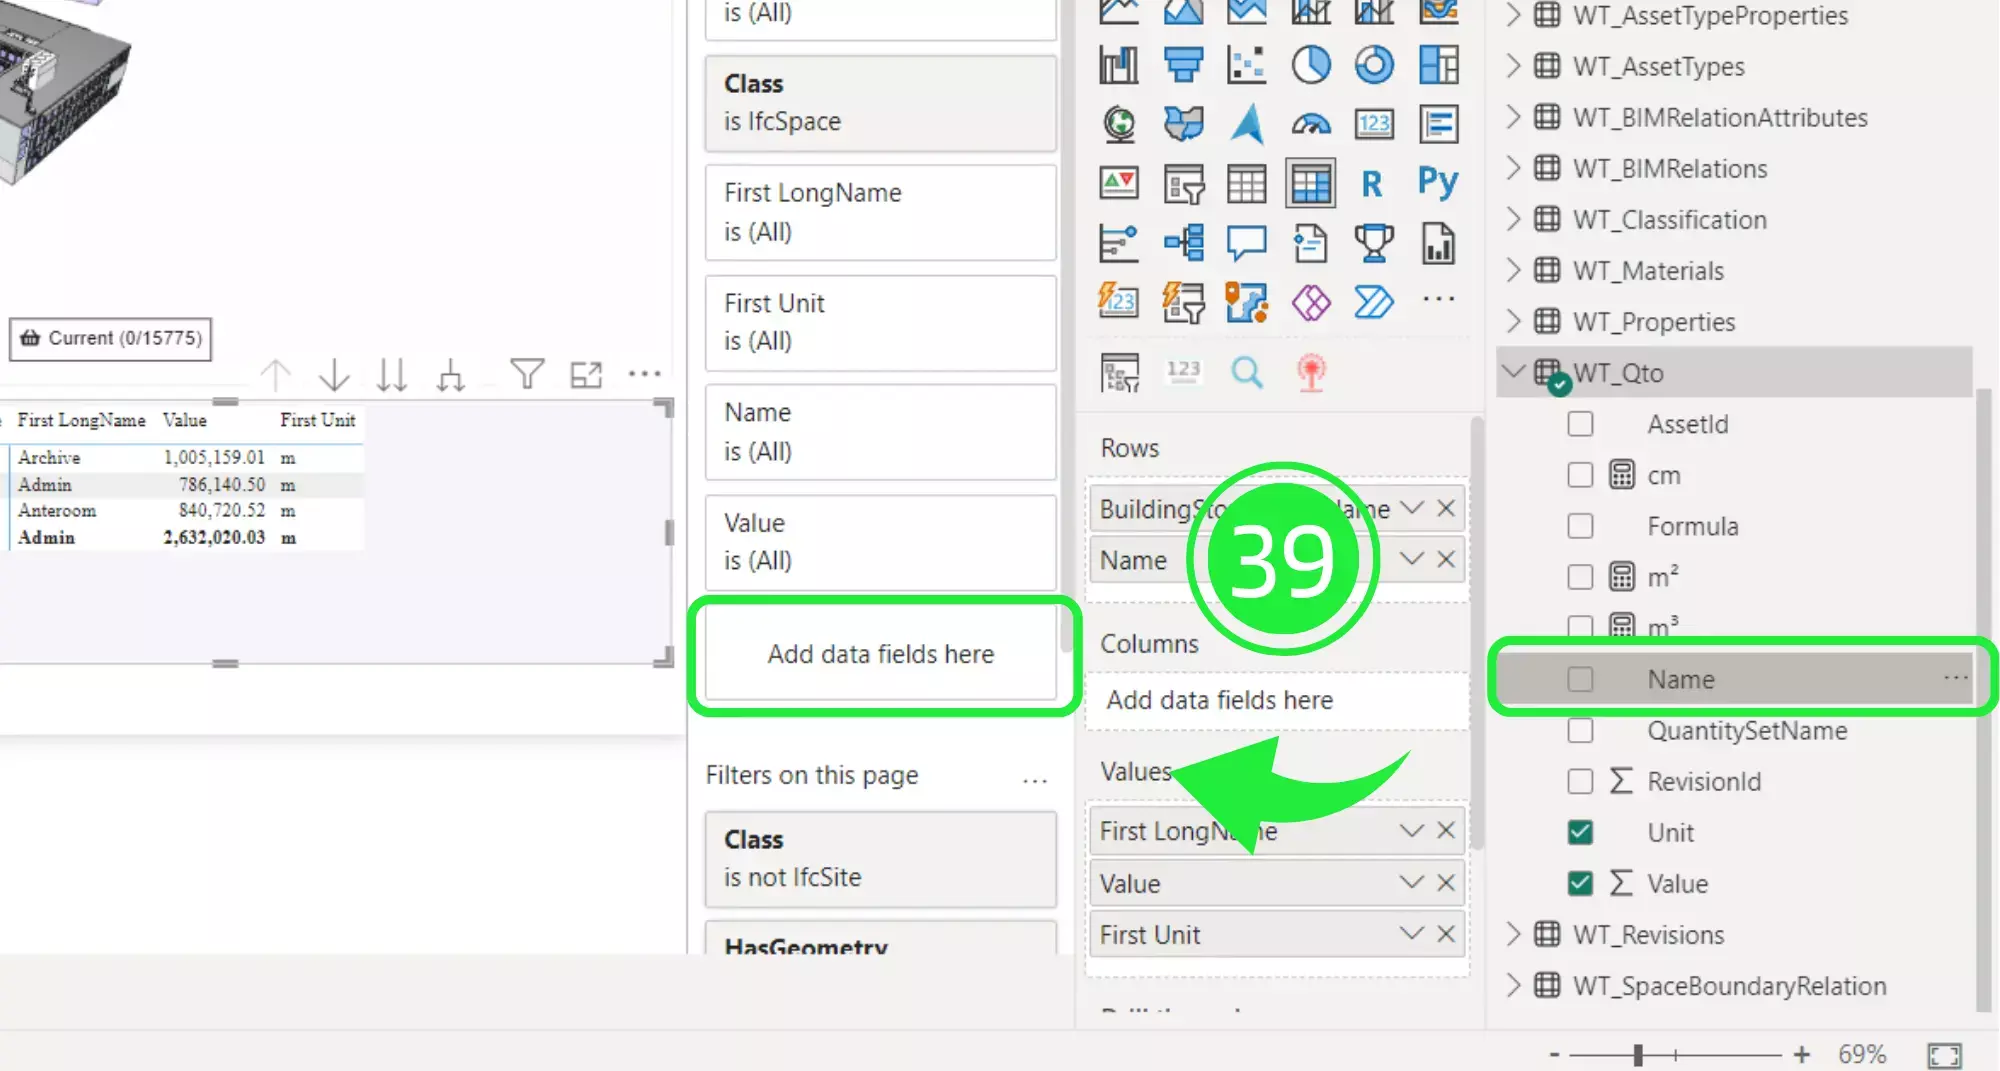
Drag and drop “Class” over to “Filters” so that it sits just below “Name”.
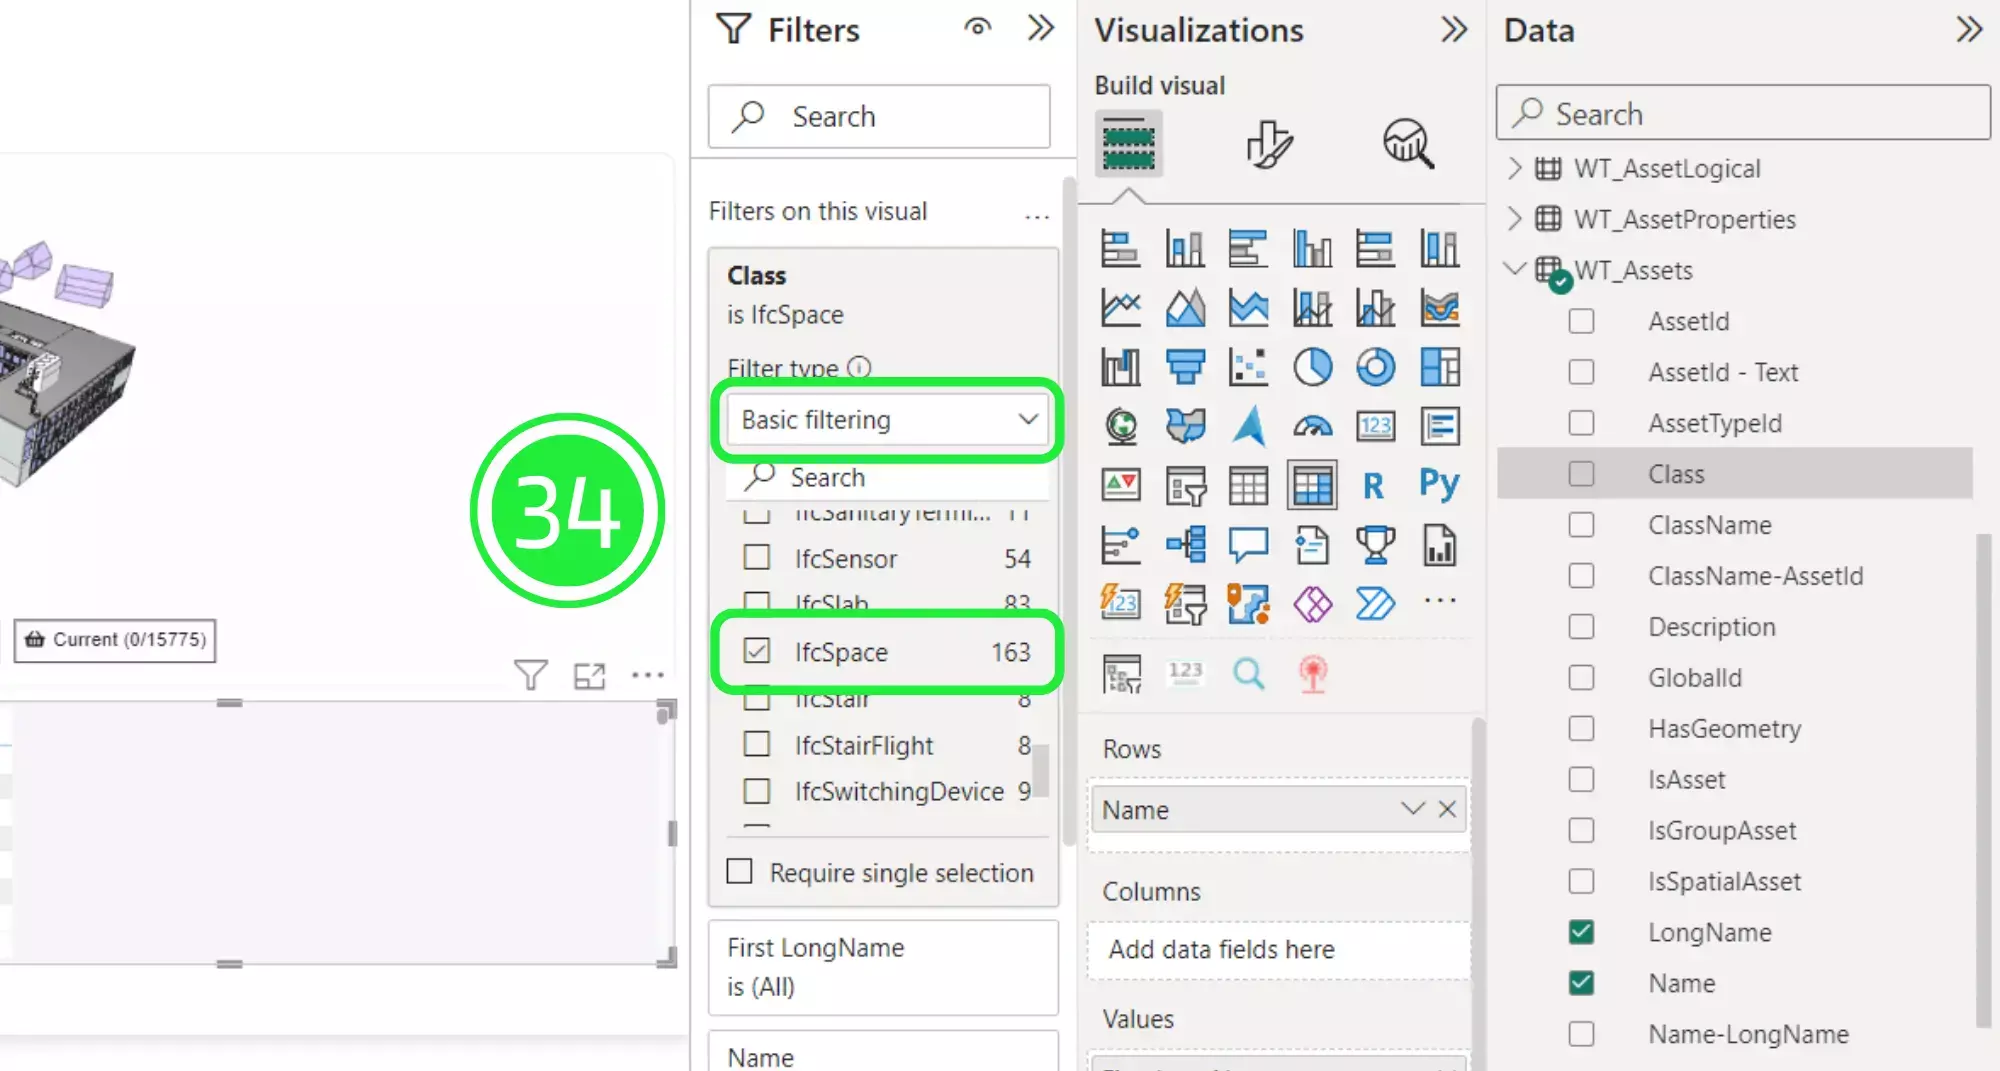
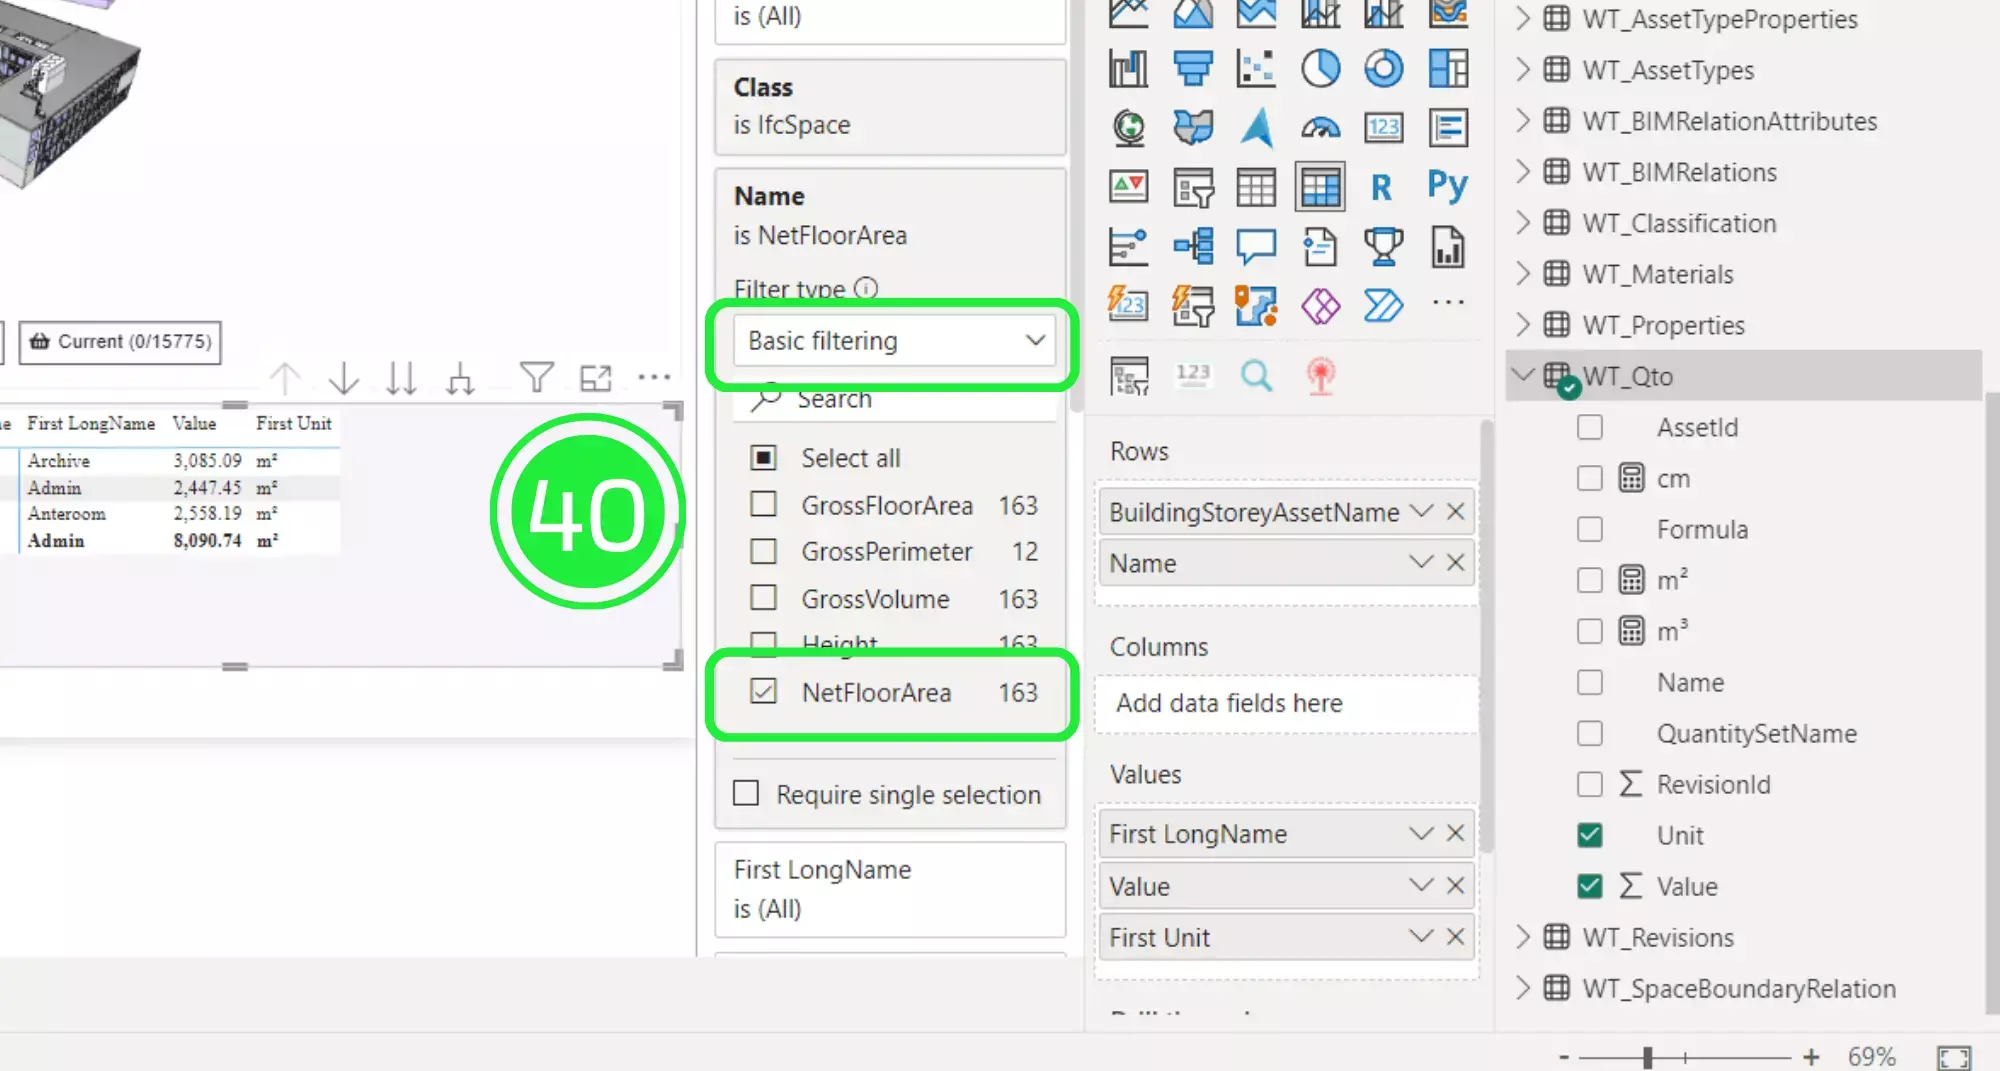
Make sure that it’s set to “Basic Filtering” under “Filter Type” and then scroll down and select “ifcspace”. This will ensure that this table will only show space related information.
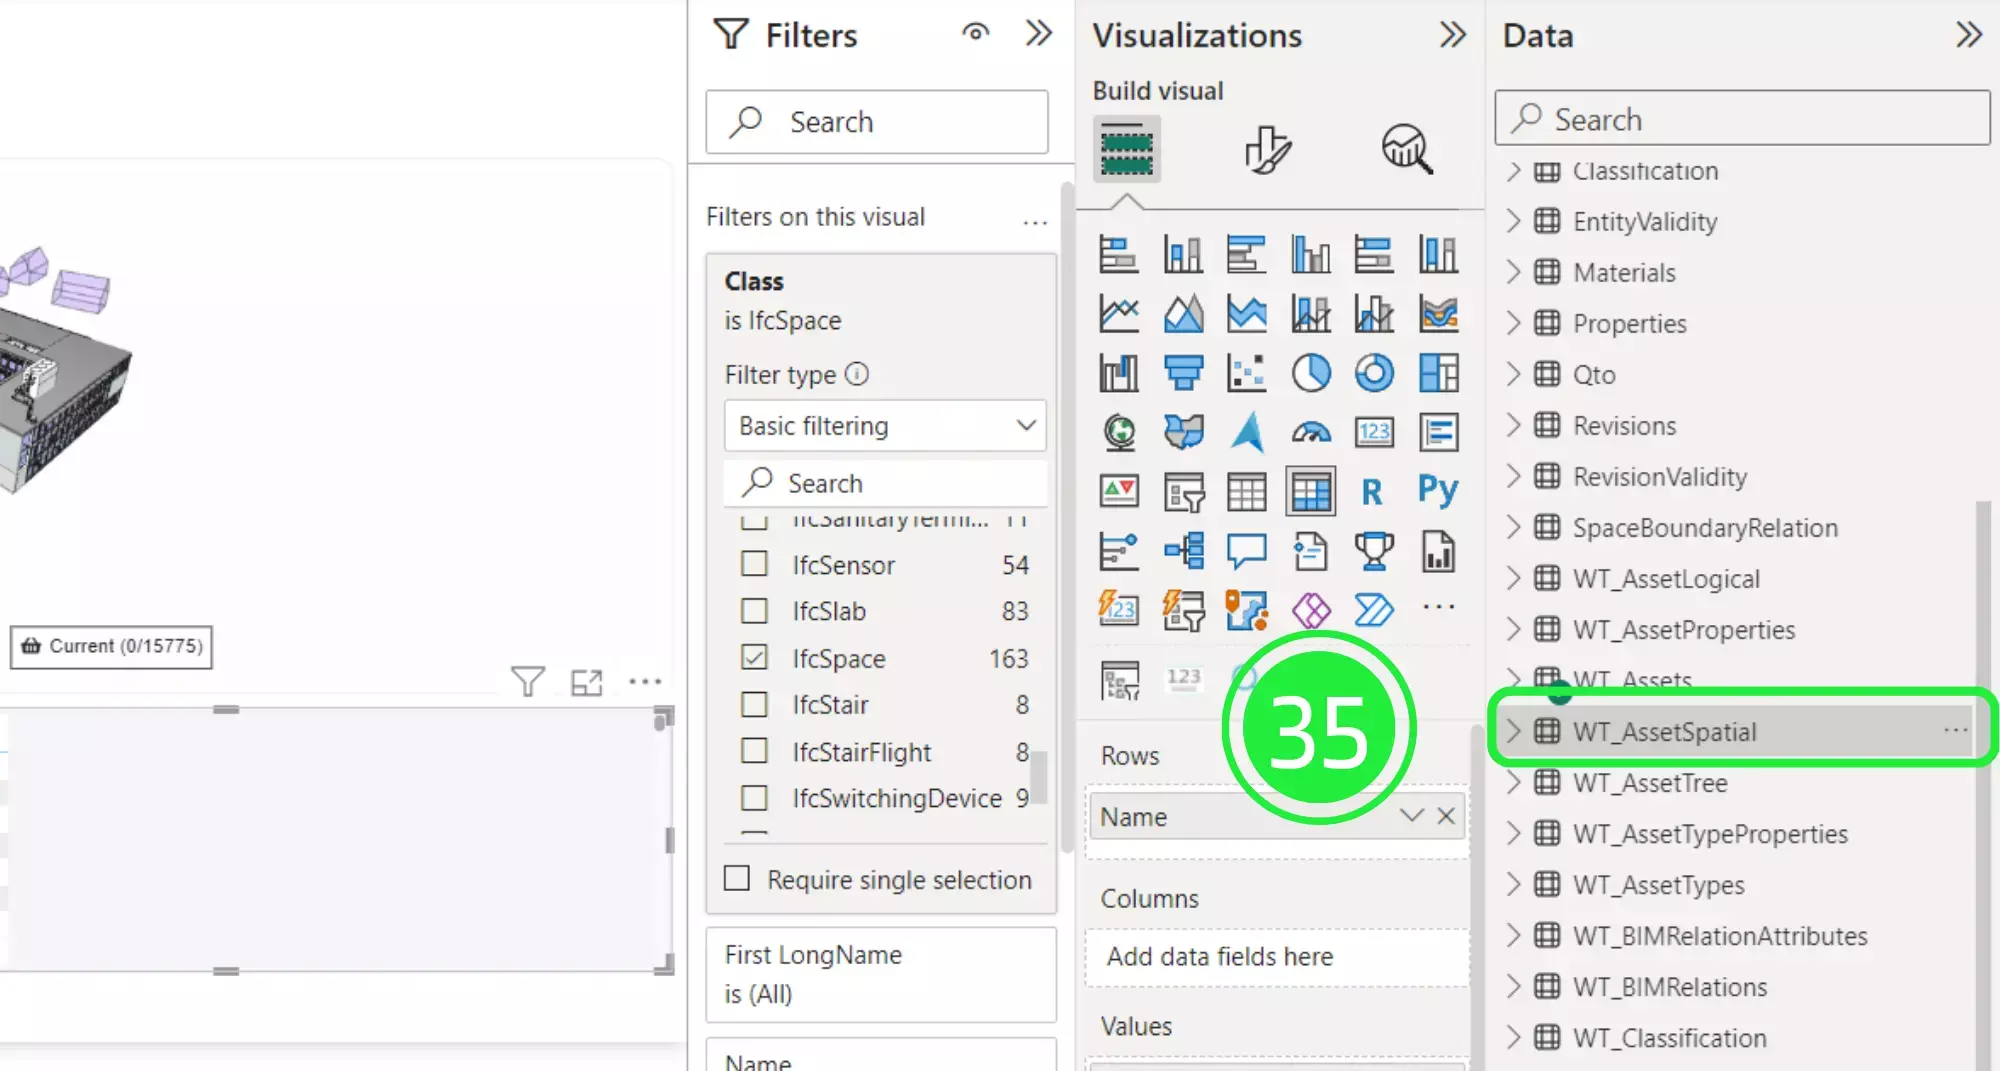
Under the Data pane, click on the drop down button on “WT_AssetSpatial” to expand the menu, enhancing the optimization space are per level in SeveUp BIM data.
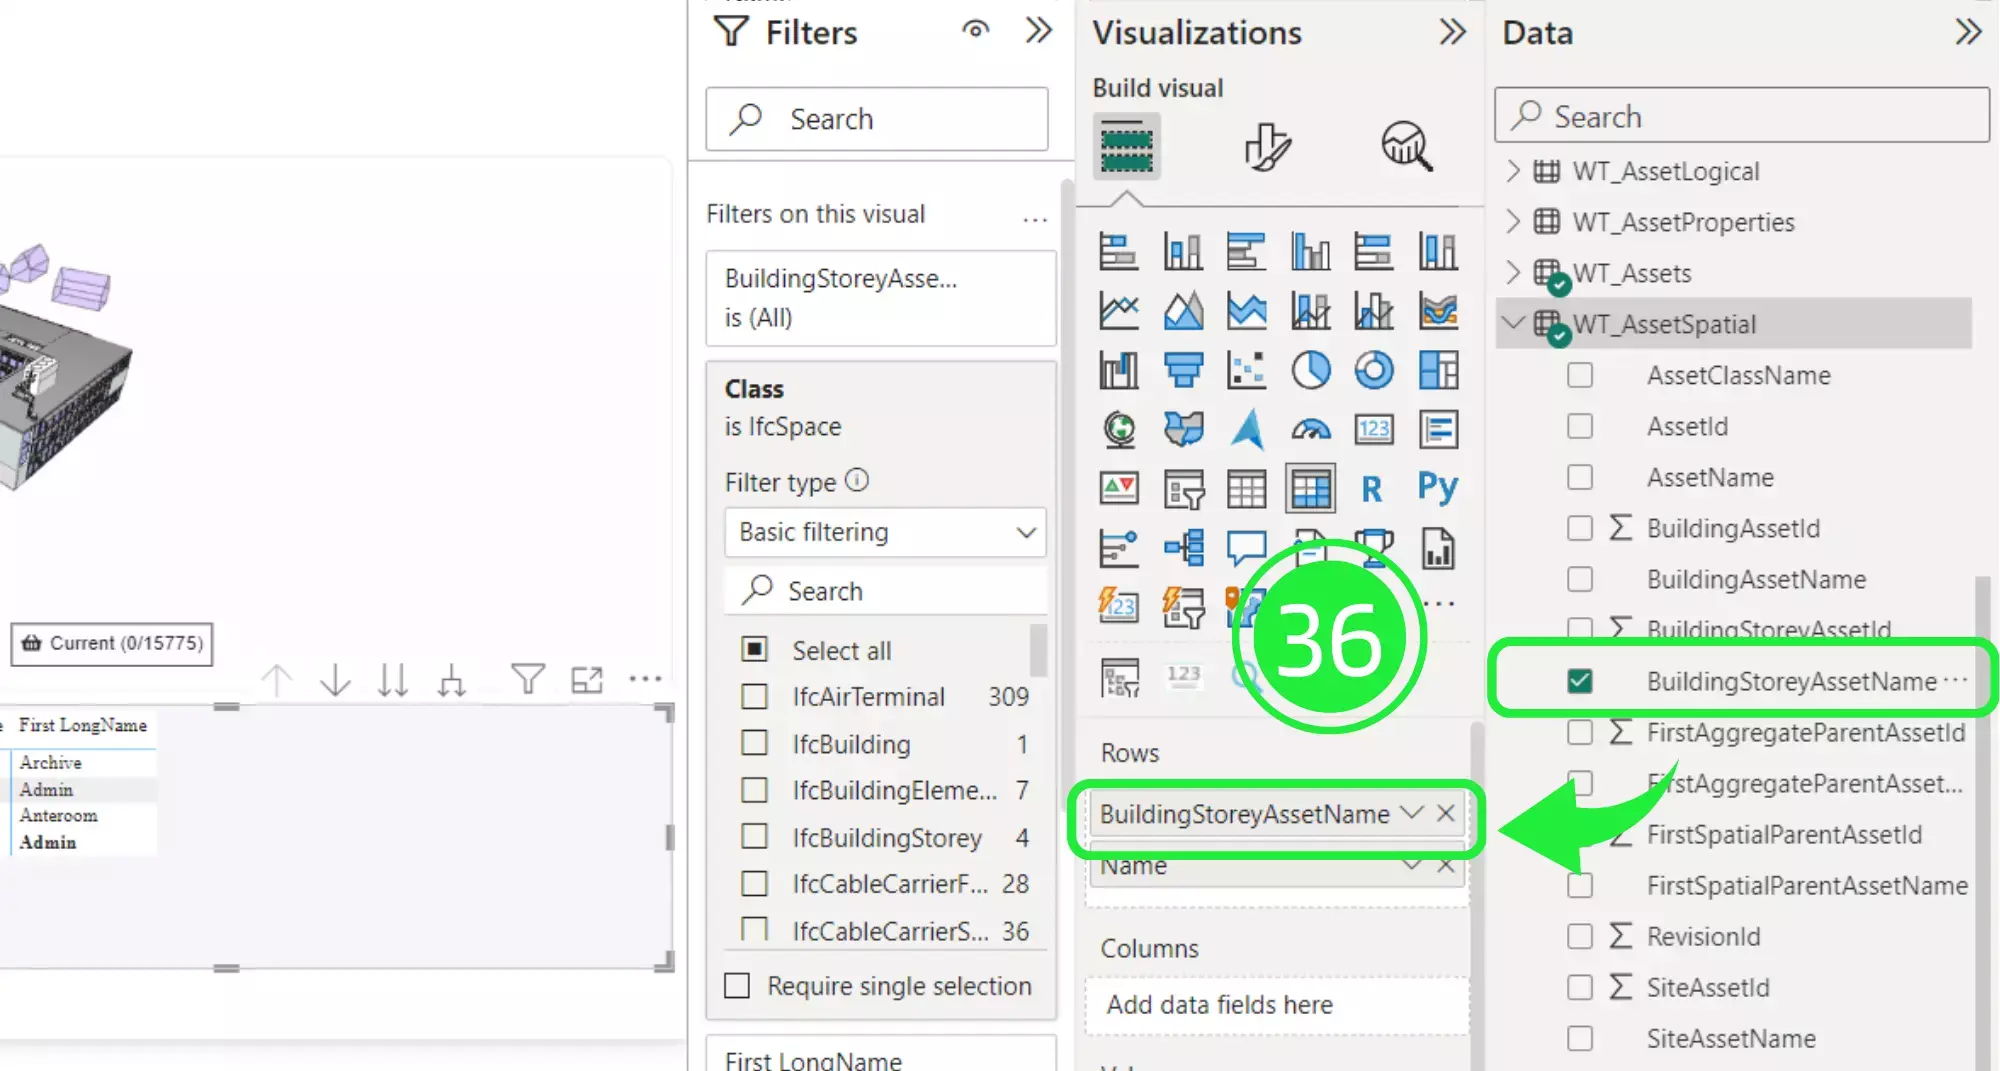
Drag and drop “BuildingStoreyAssetName” over to the “Rows” field so it sits above “Name”. Make sure it sits above ‘Name’ and not below it as this does affect how the data is shown in the visual.
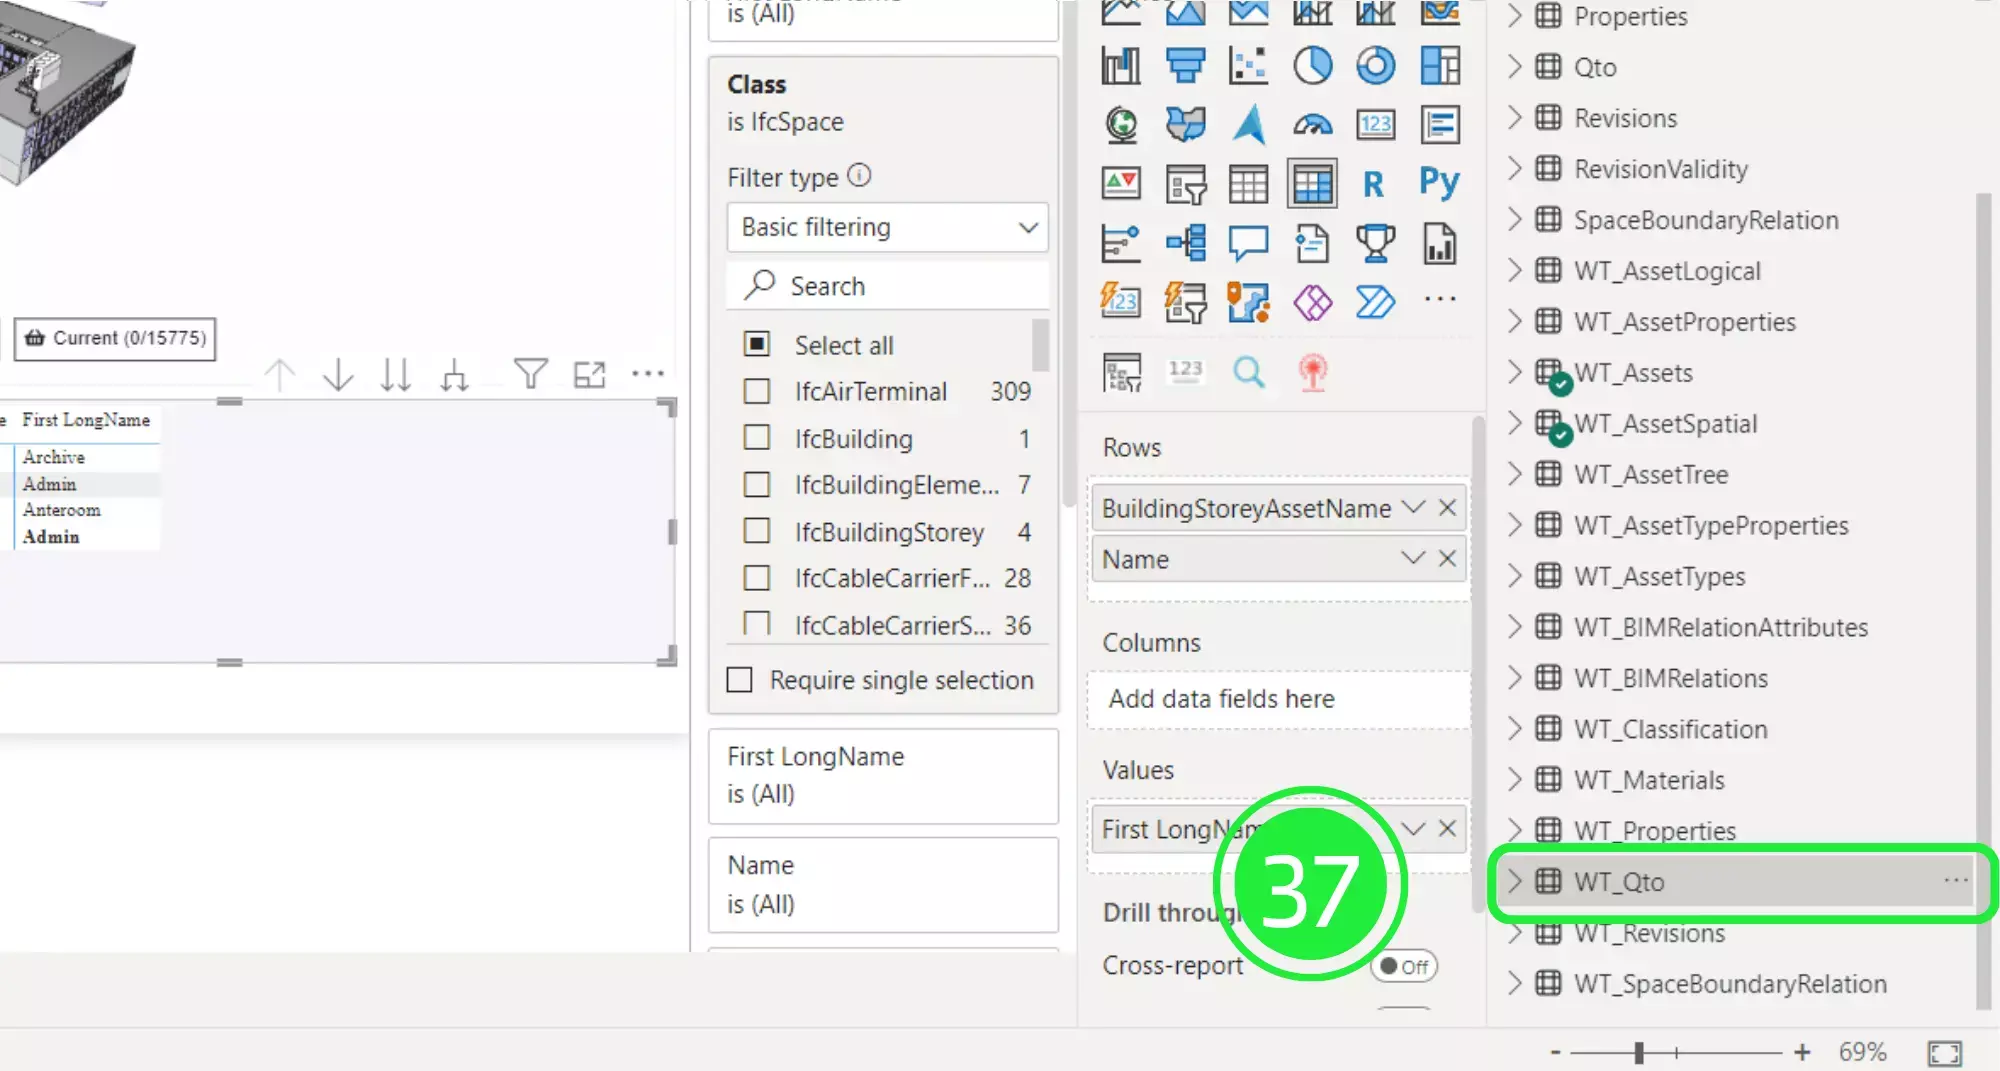
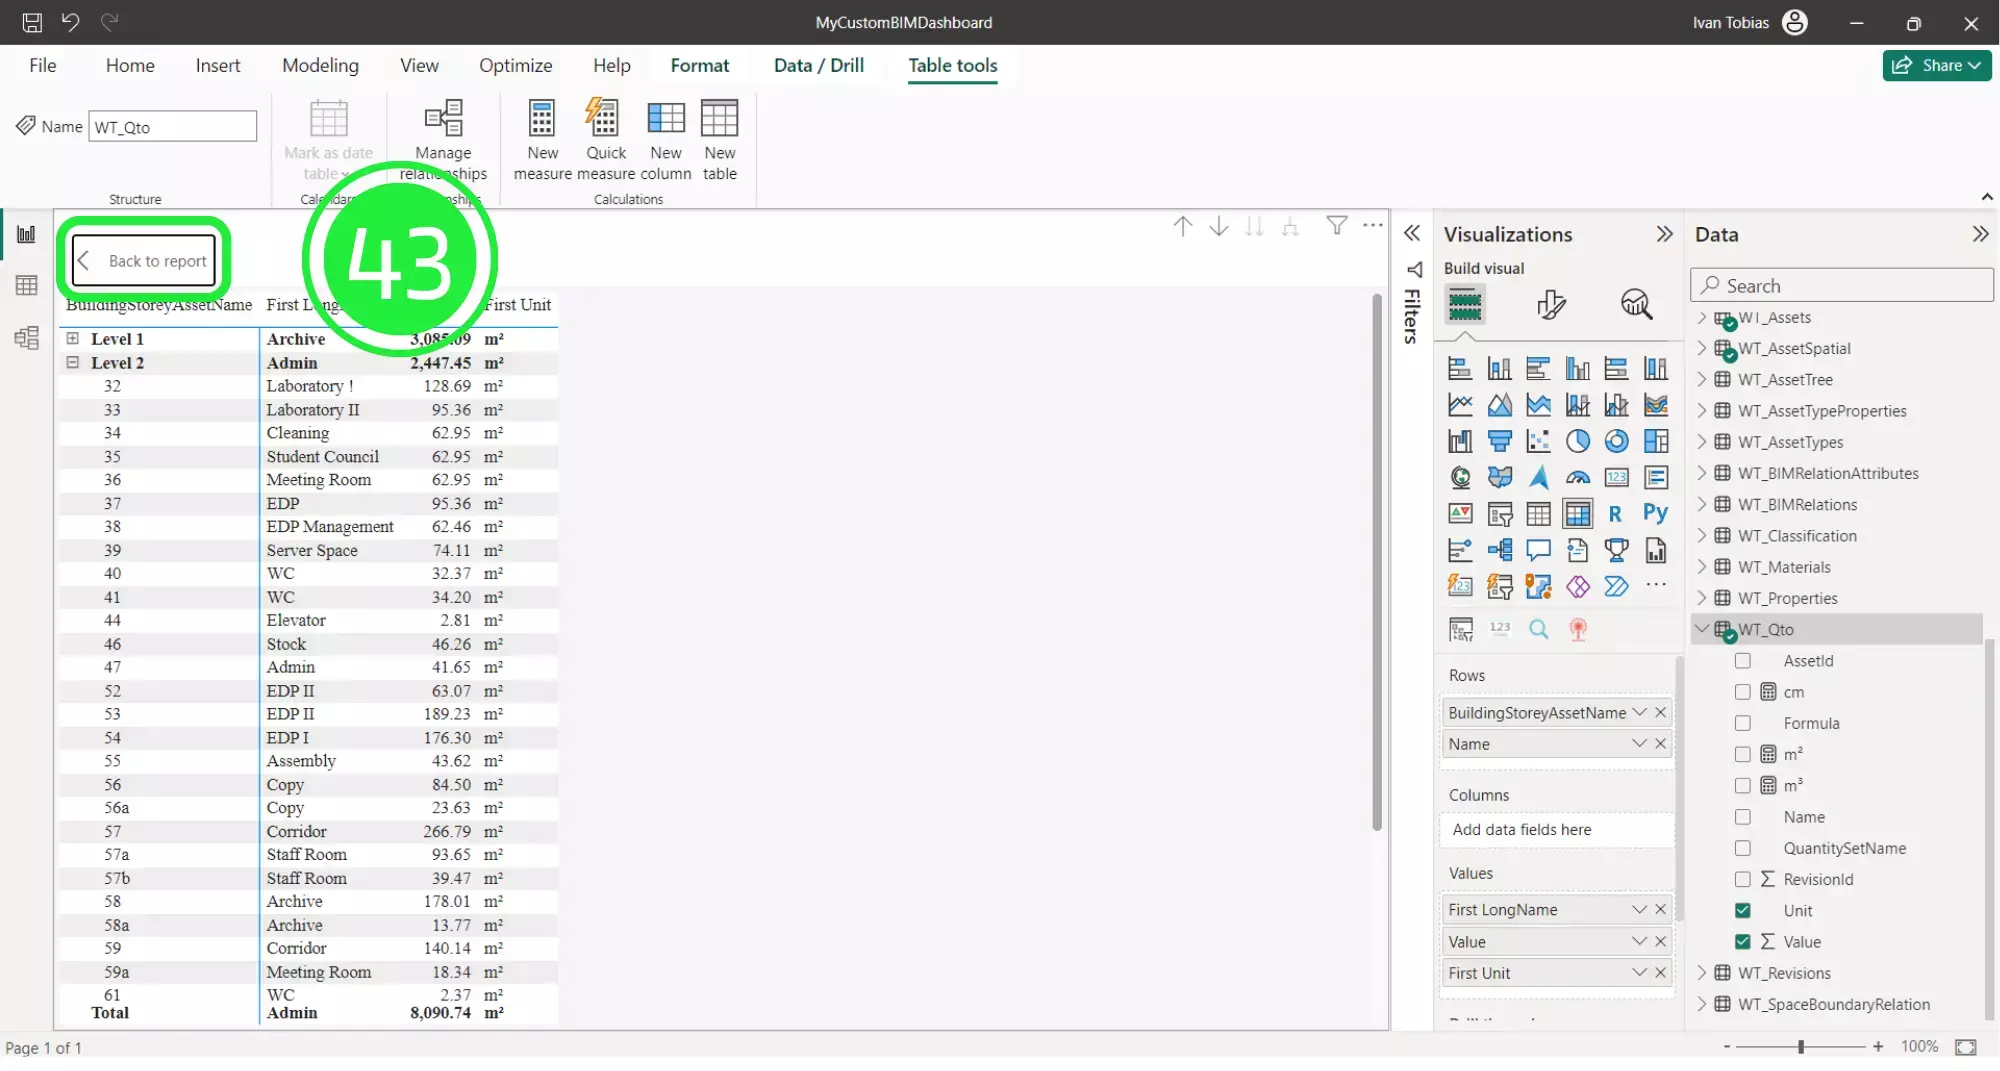
Under the Data pane, click on the drop down button on “WT_Qto” to expand the menu.
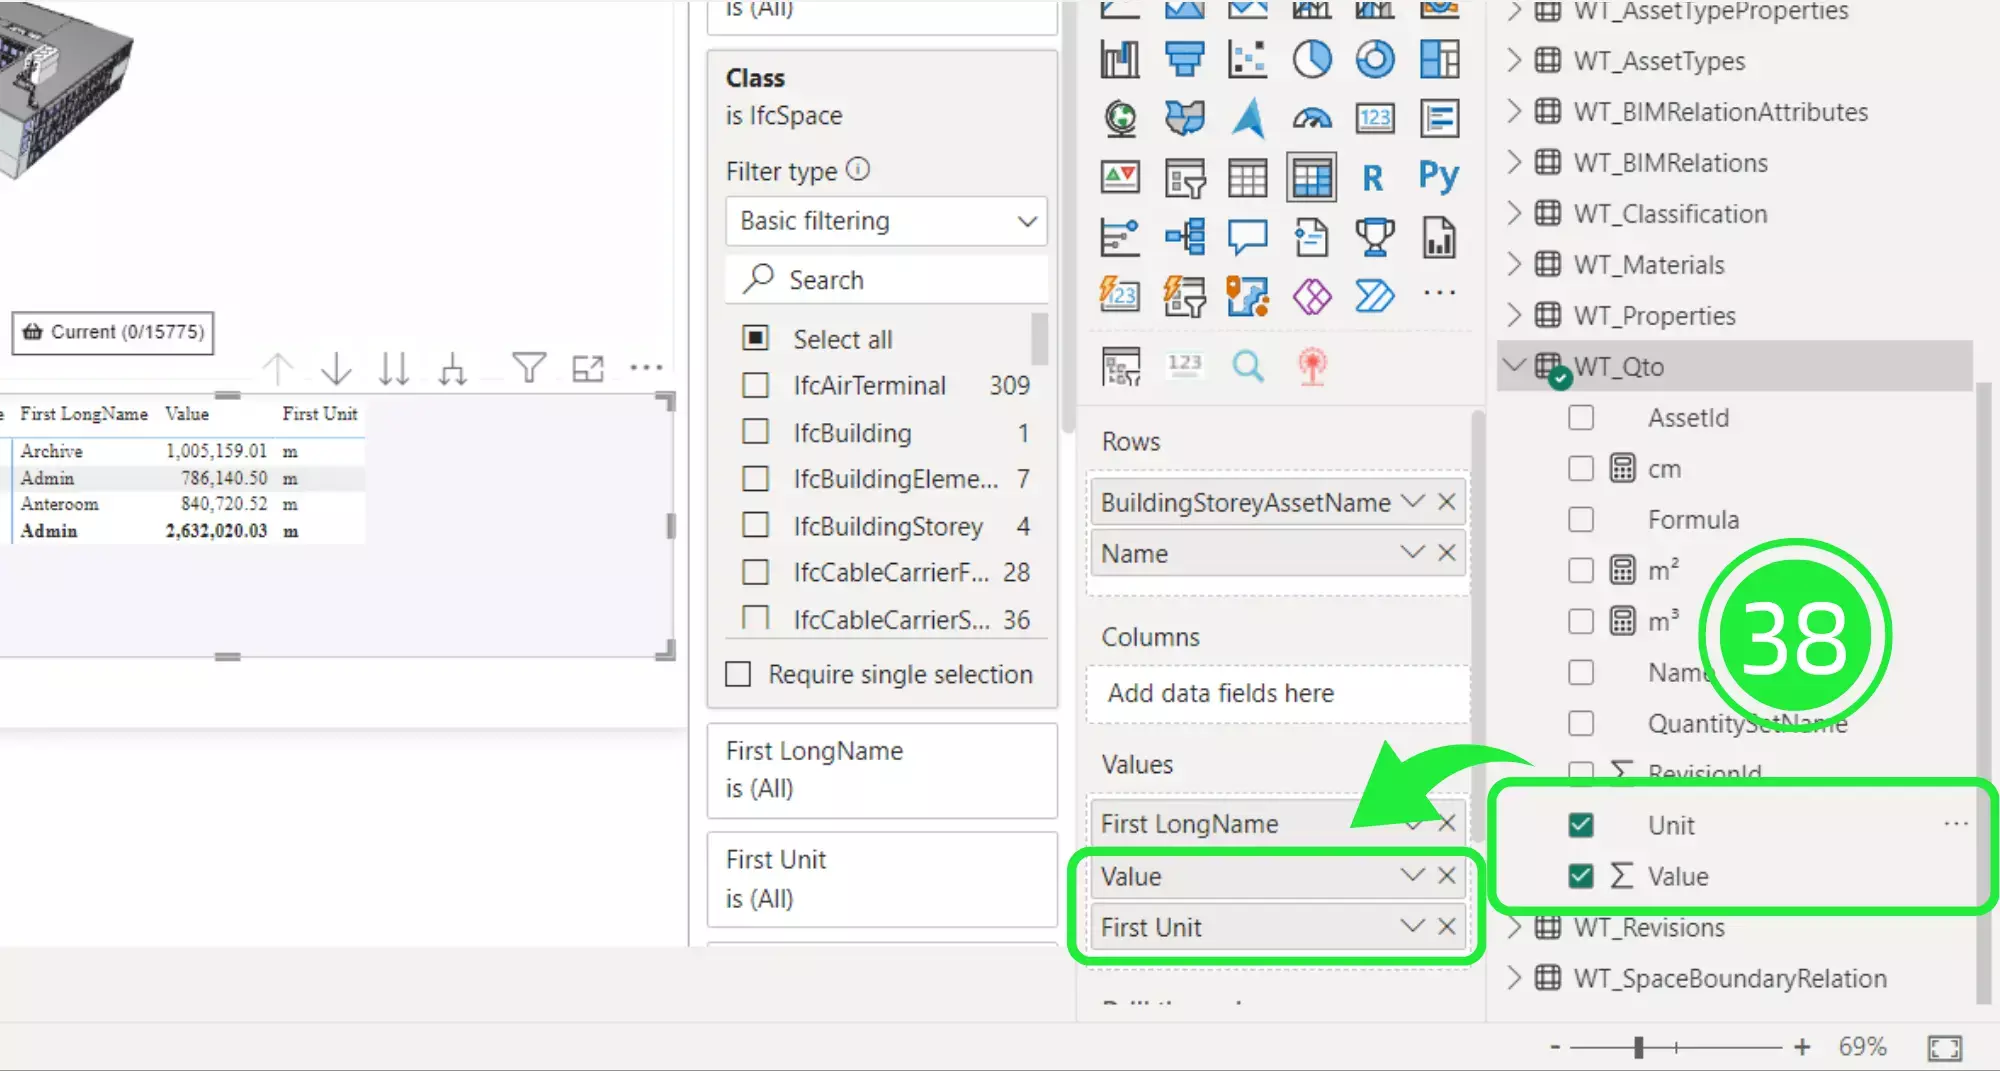
Drag and drop “Value” and then “Unit” over to the “Values” section so they sit underneath “FirstLongName”.
Drag and drop “Name” over to “Filters”.
Now move “Name” so it sits just below “Class”. Then under “Filter Type” select “NetFloorArea”. This visual matrix is now only displaying the NetFloorArea data for ifcSpace.
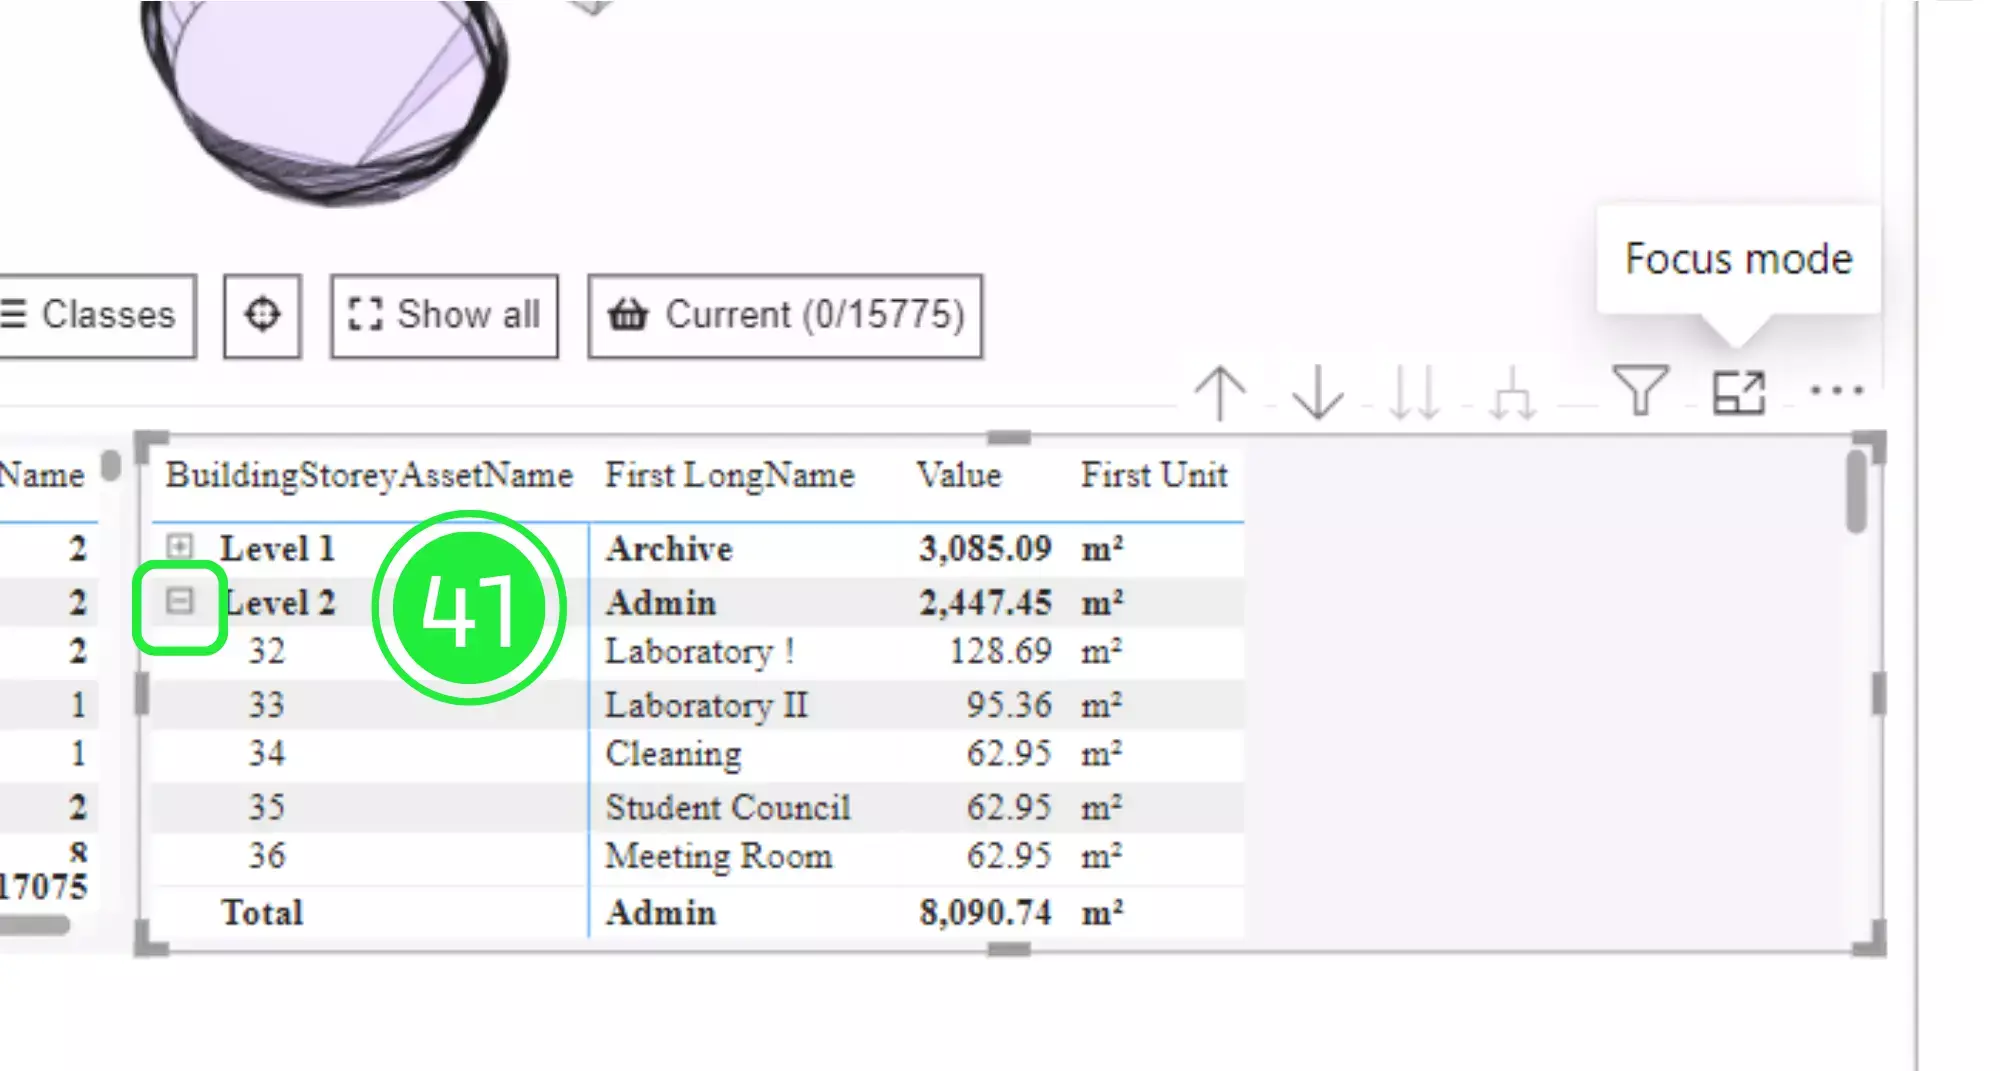
Click on the “+” icon next to Level 2 in the Matrix. This will drop the information so you can see more information with all of the values and names as well as the total.
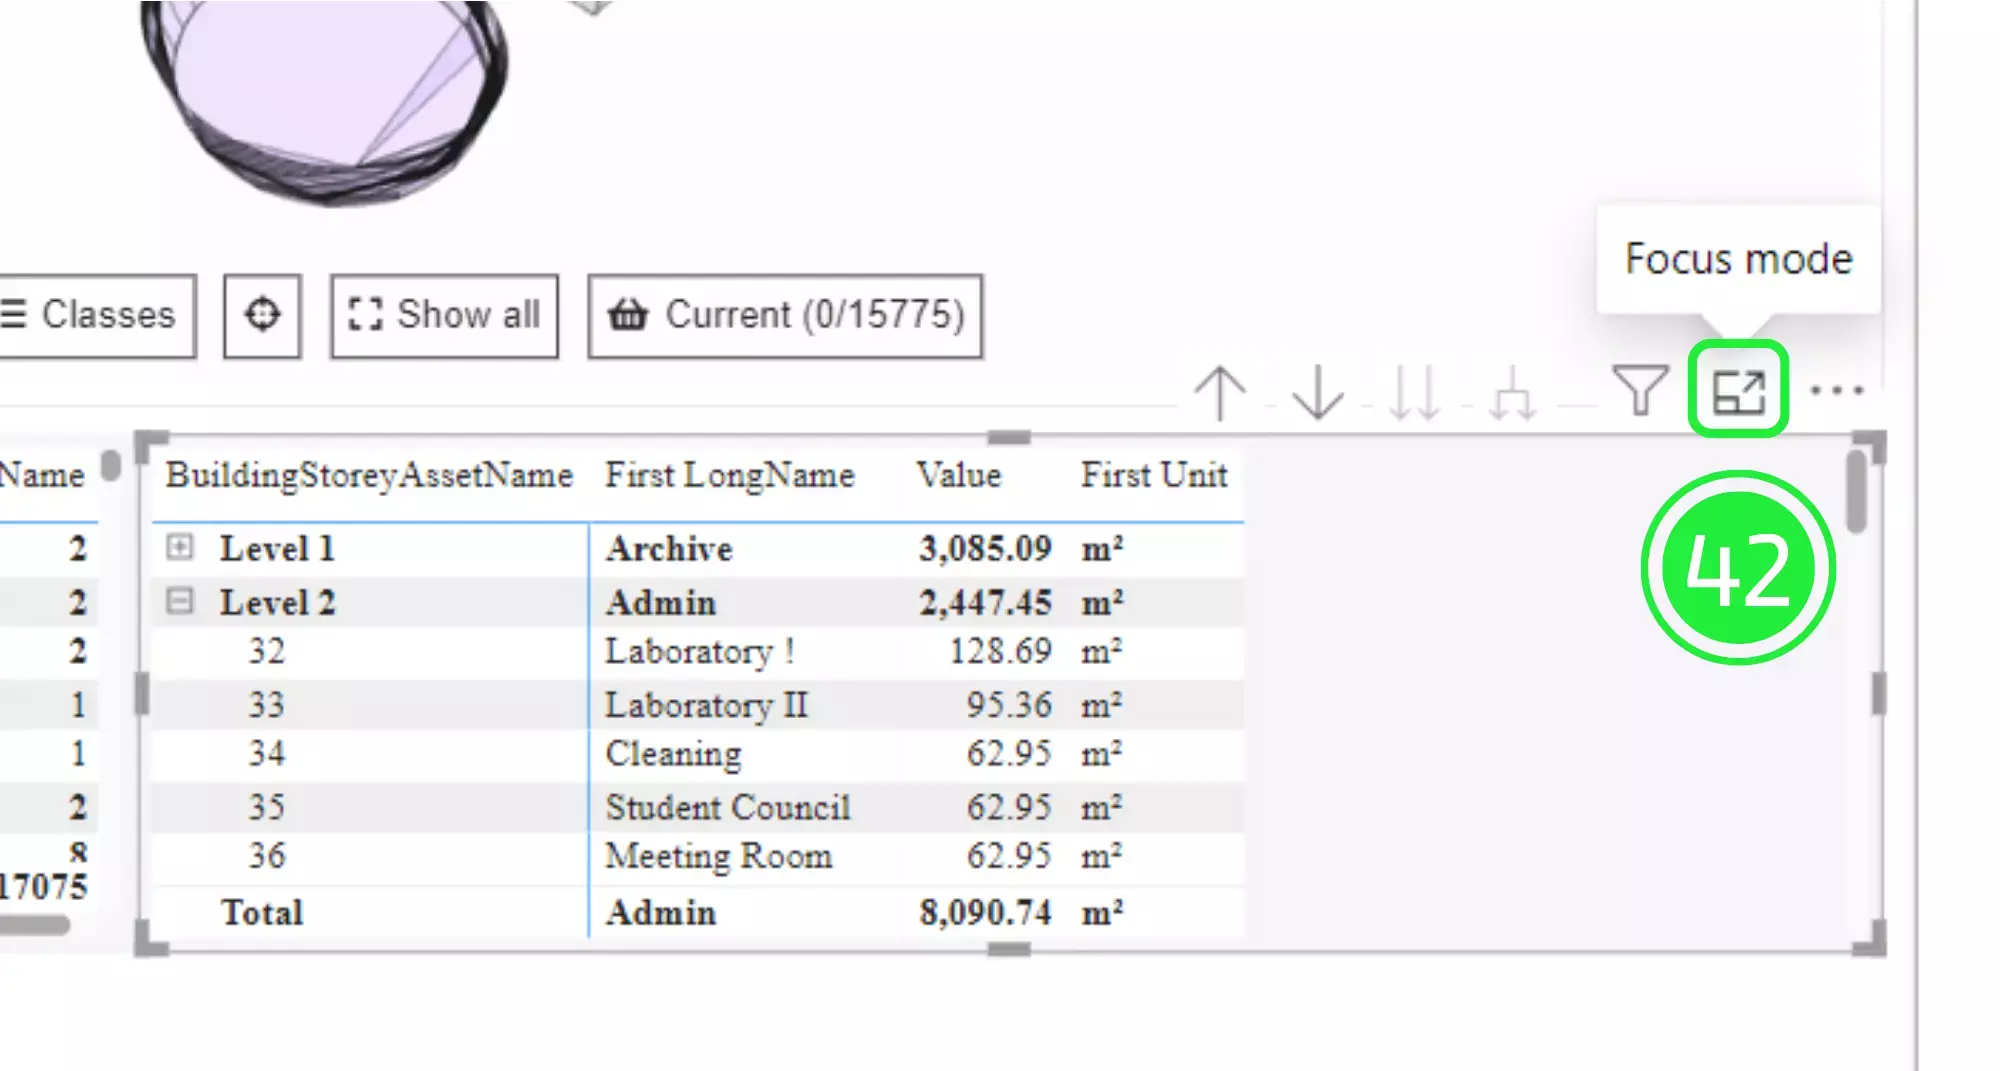
Click on “Focus” button in the top right of the “Matrix”. This will allow you to see it as a full table dedicated to the parameters you’ve just set.
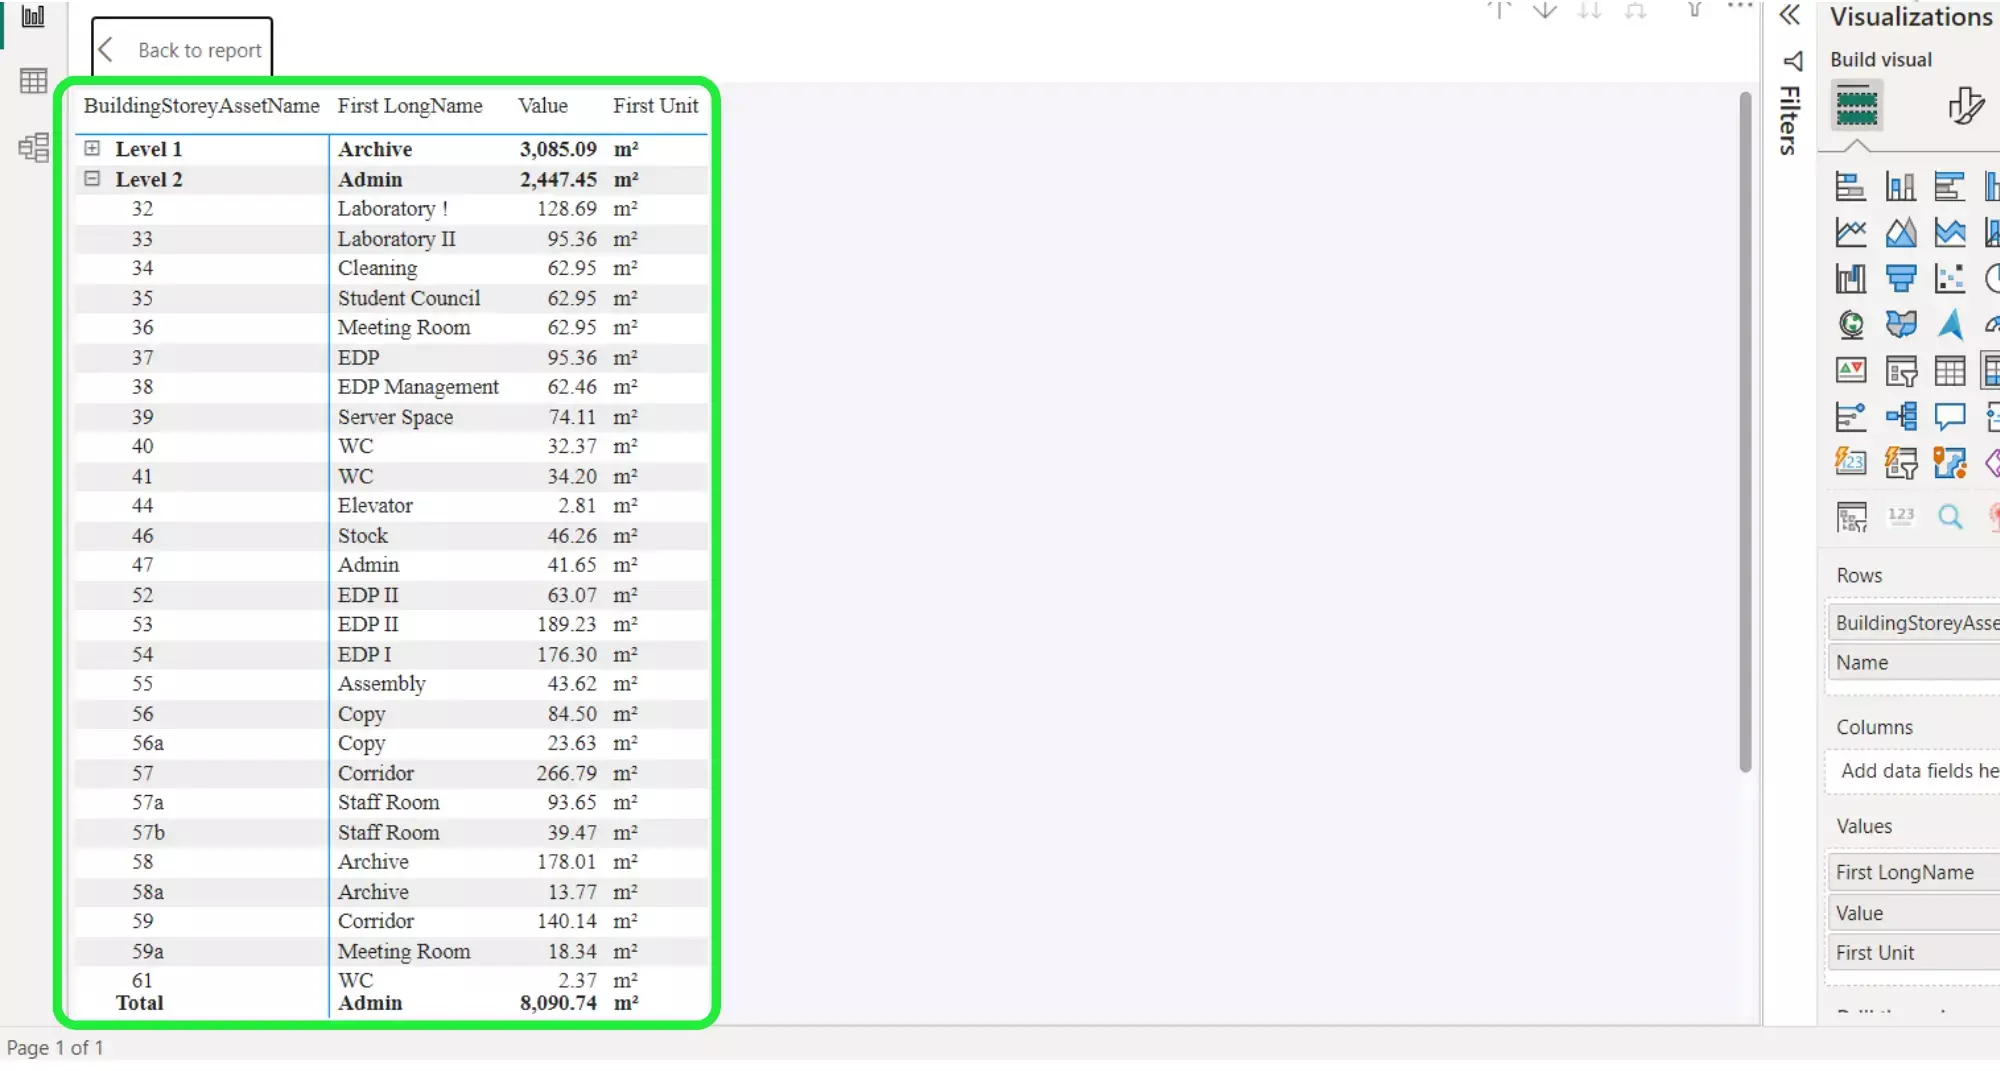
Click on “Back to Report” to go back to the dashboard.
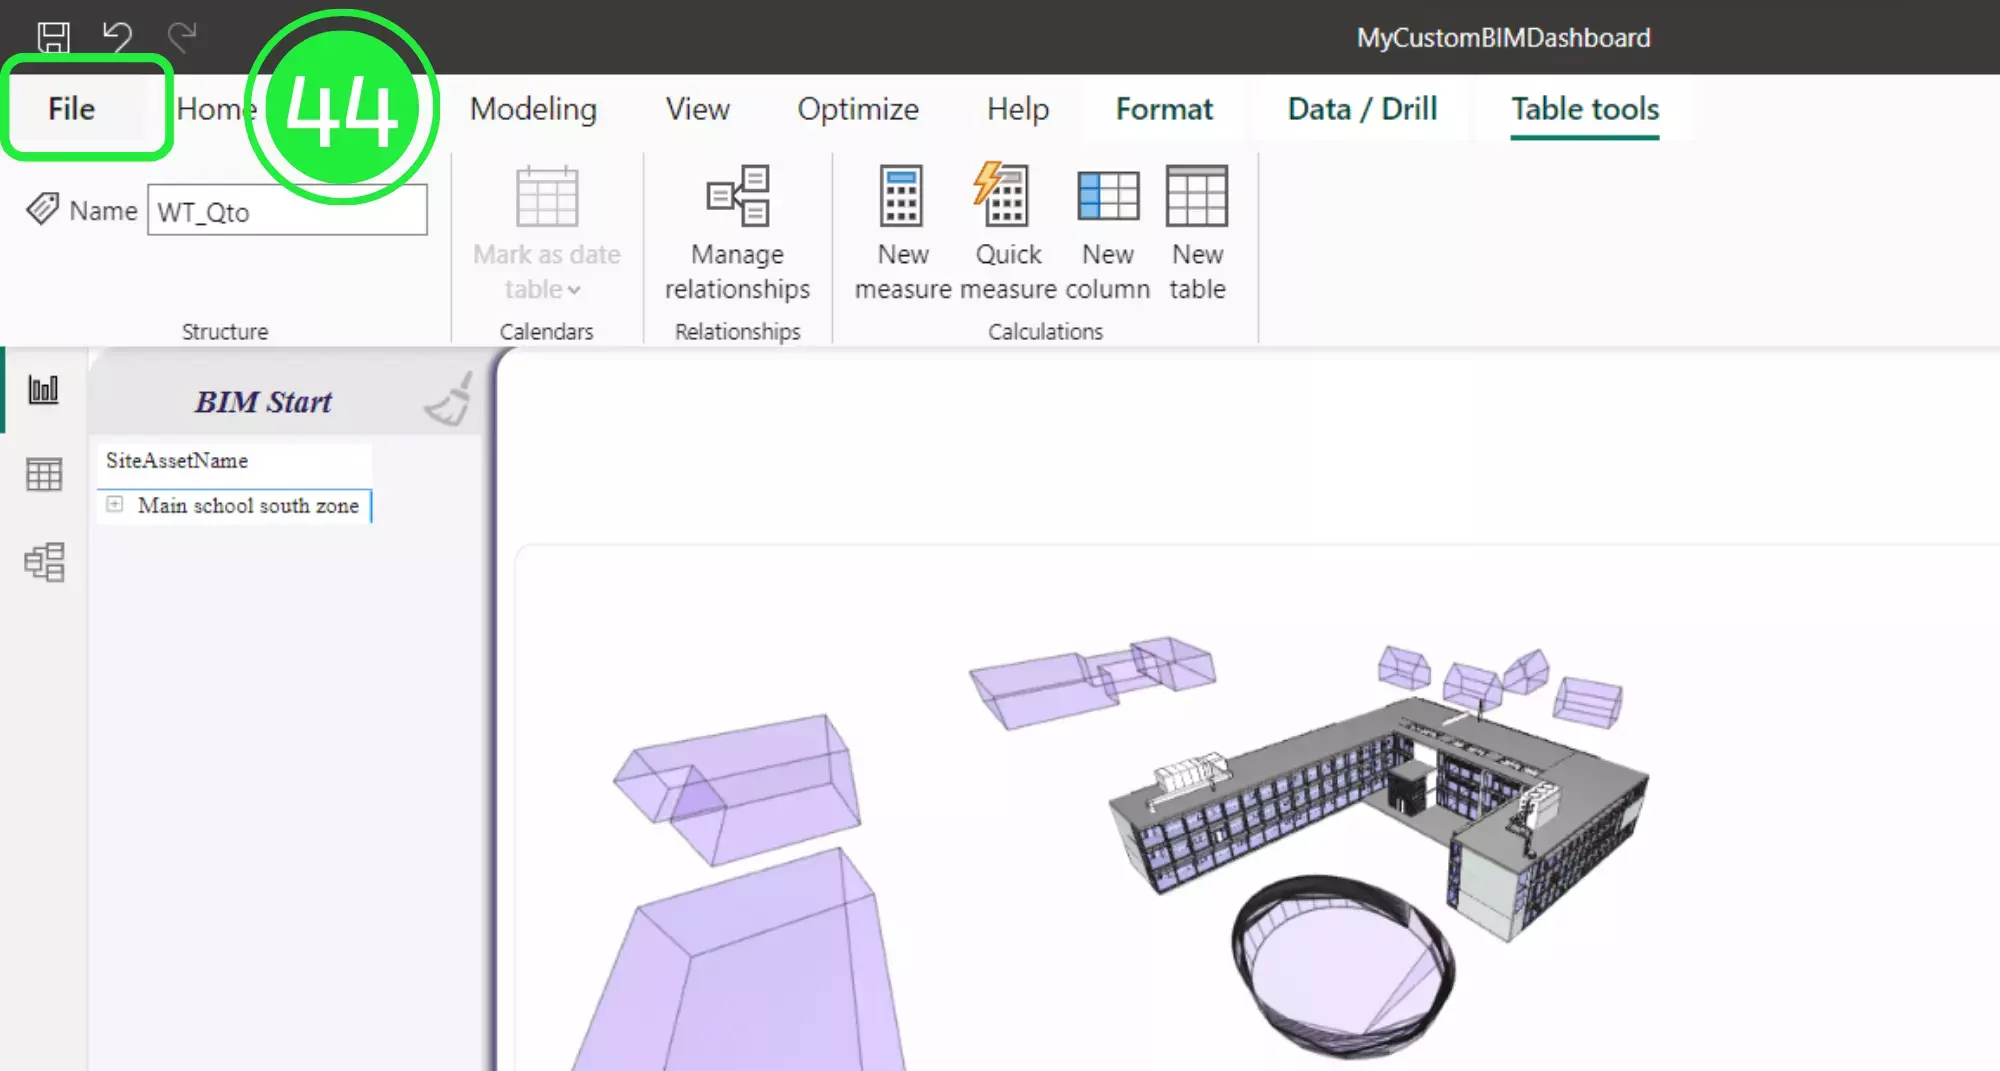
Before uploading the Power BI custom template back into the SeveUp app, it needs to be saved as a template file with the extension .PBIT. To do this click on ‘File’ in the top left corner.
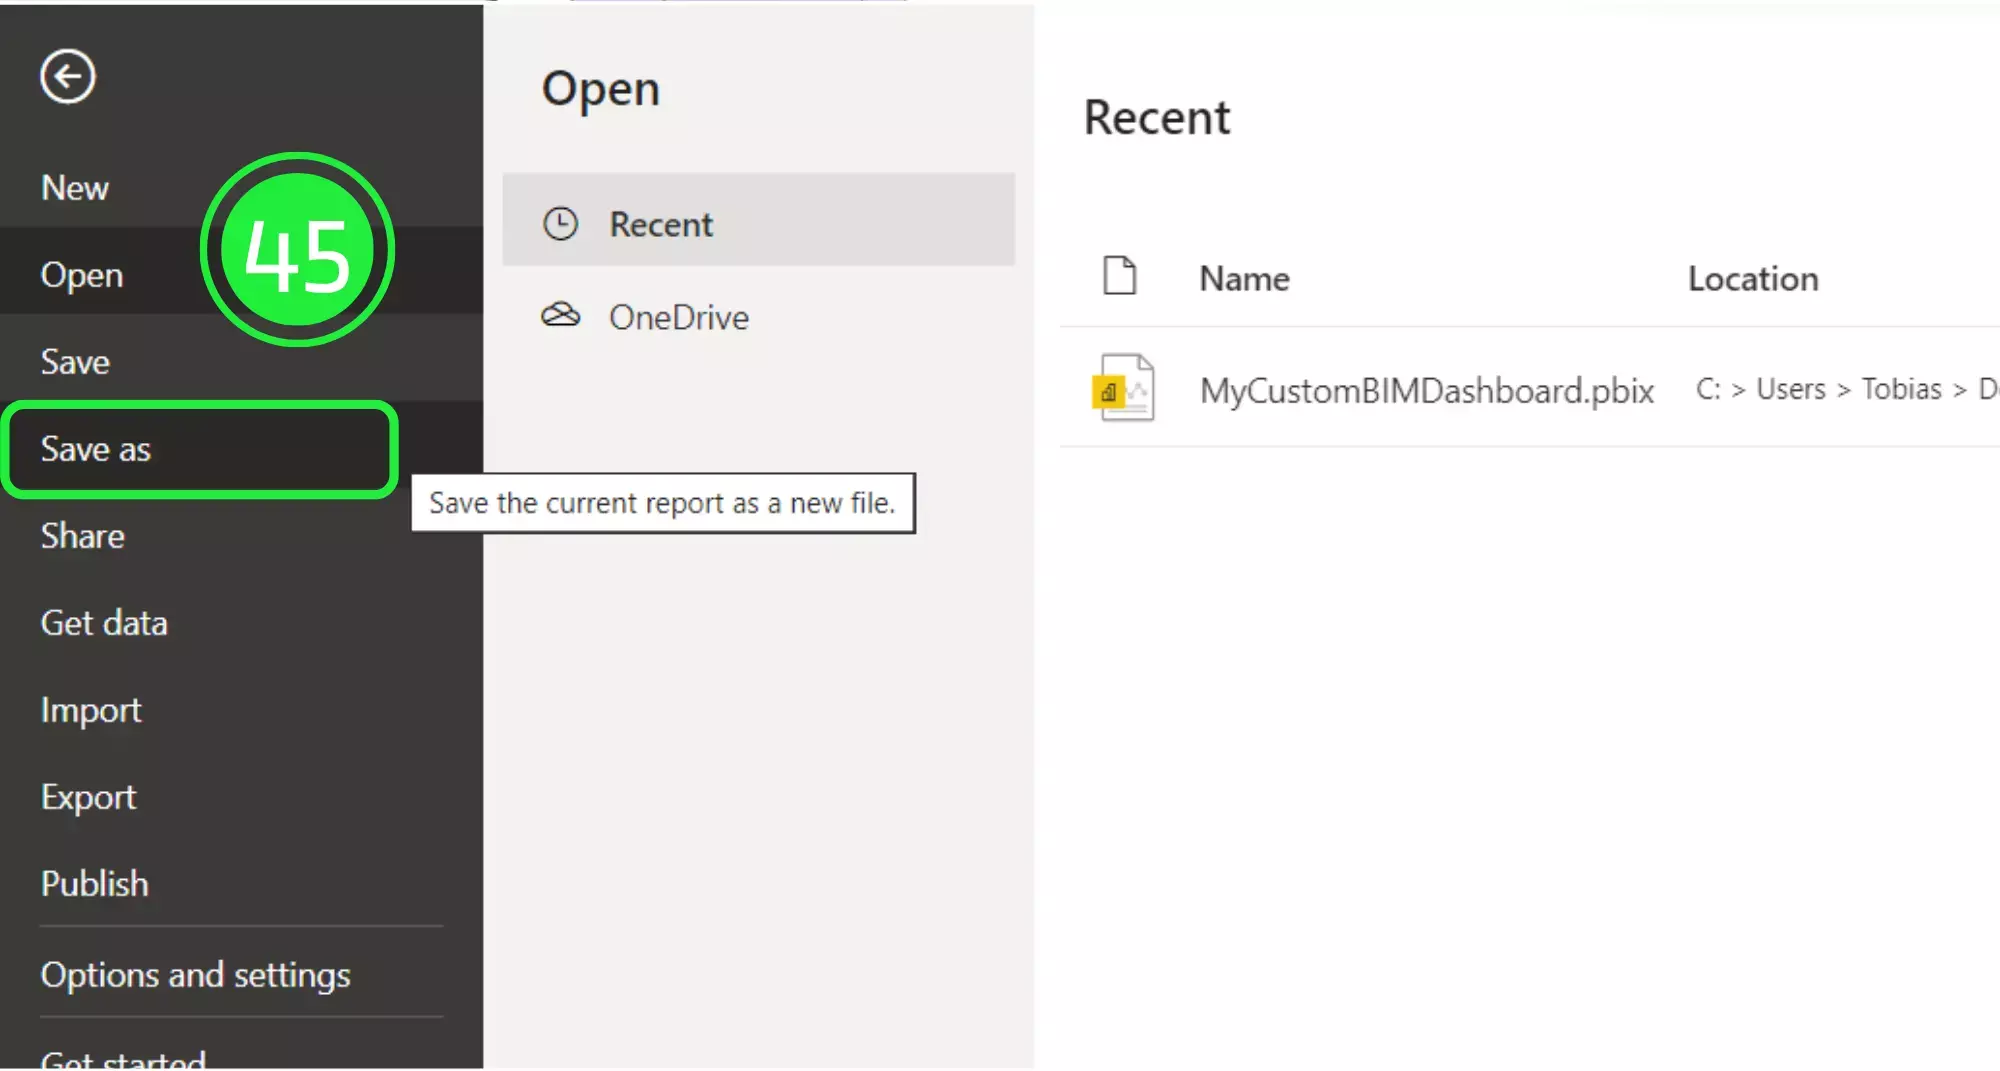
Select “Save As” from the drop down menu.
Click on “Browse this device” at the bottom of the screen.
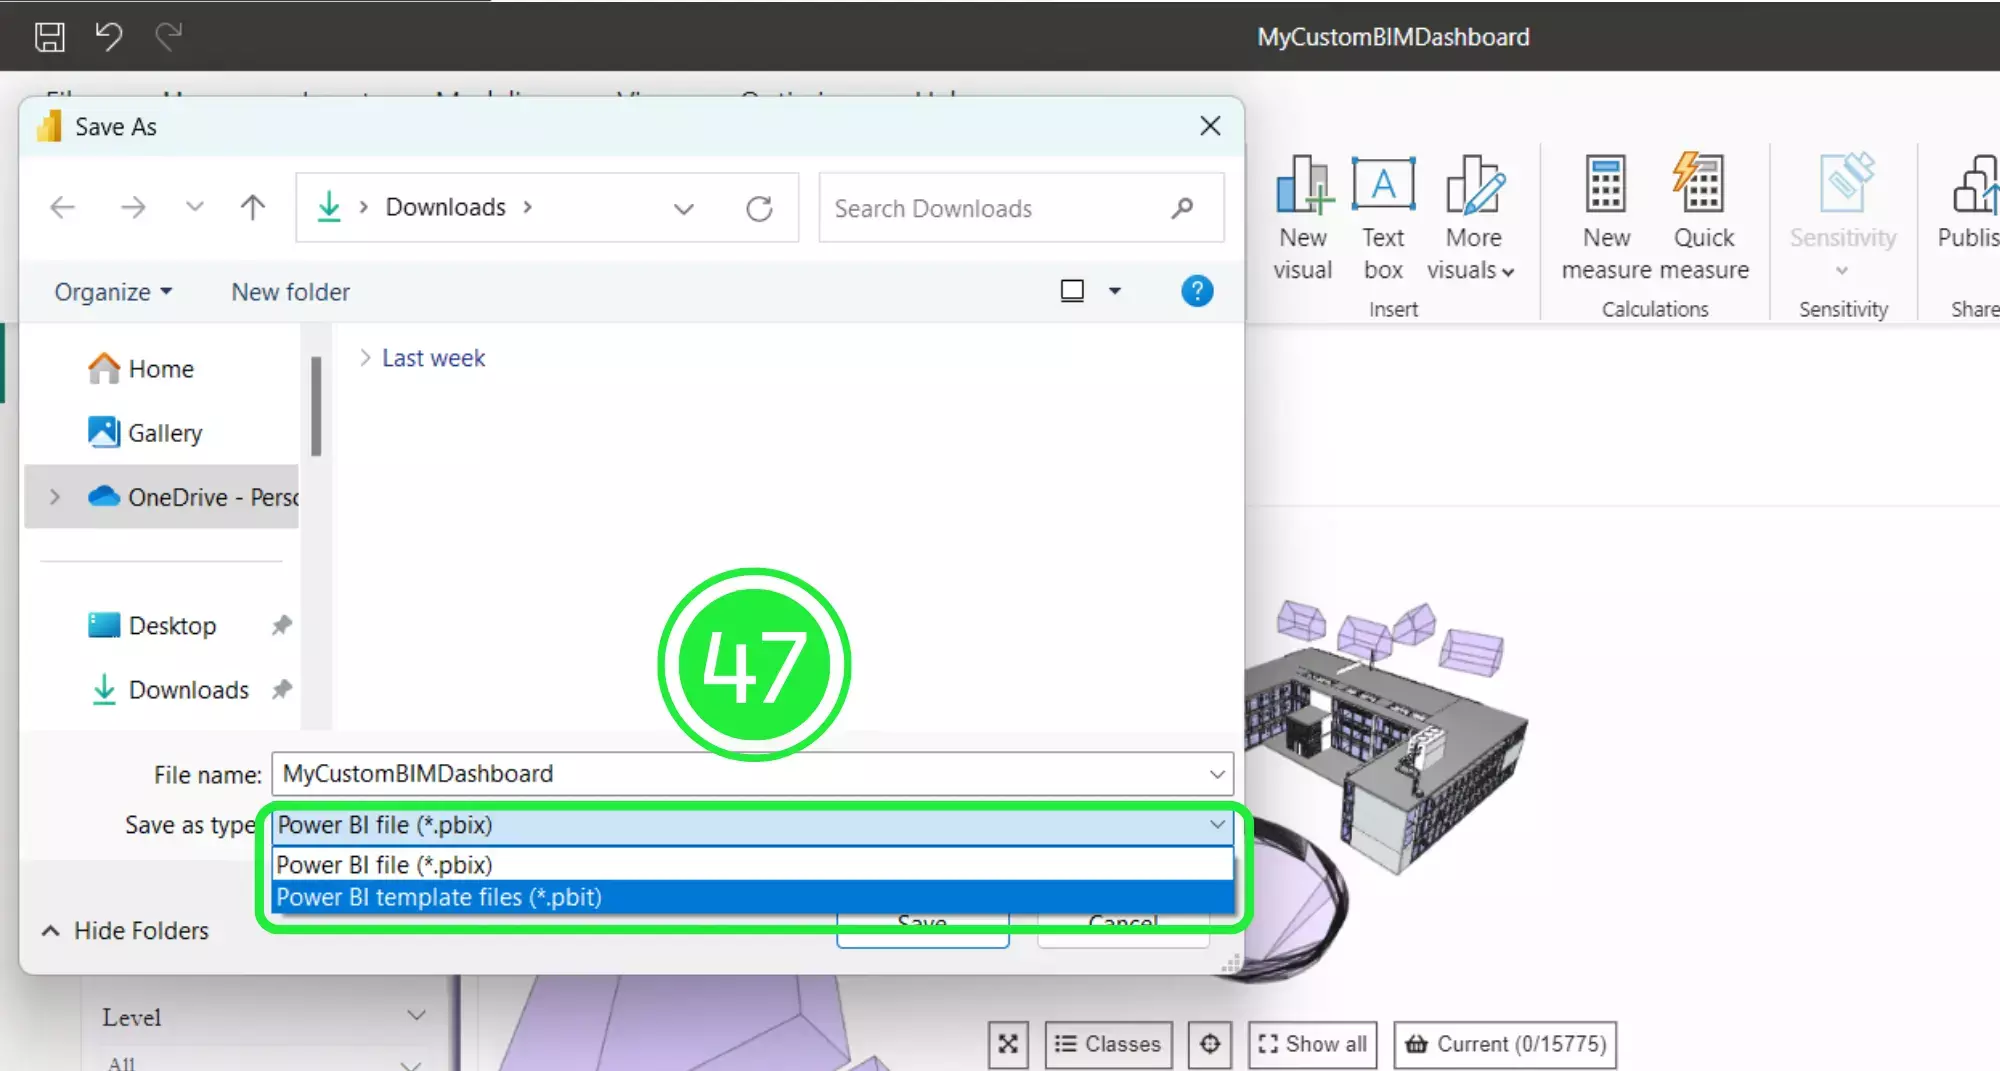
Choose to save the file as a Power BI template file (.pbit).
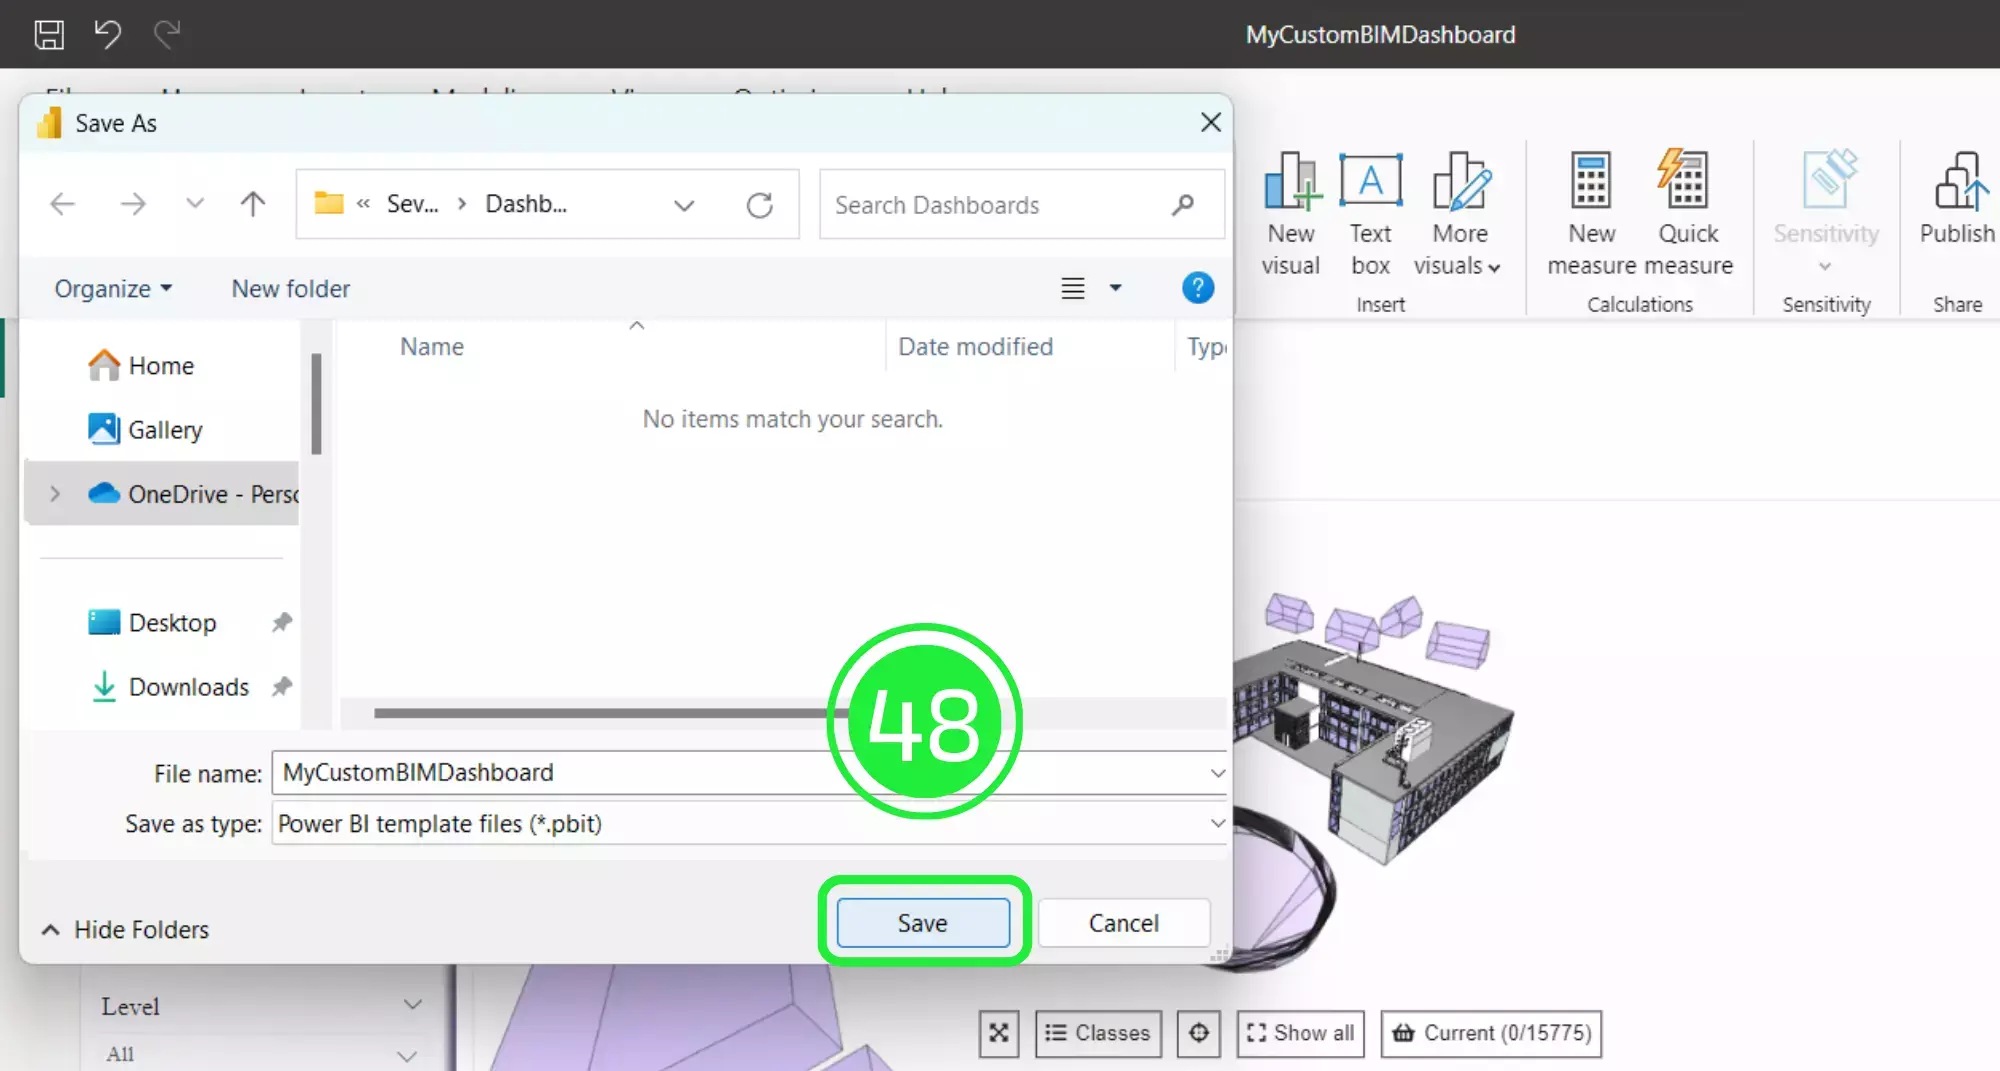
Click on the “Save” button to save your project to your computer.
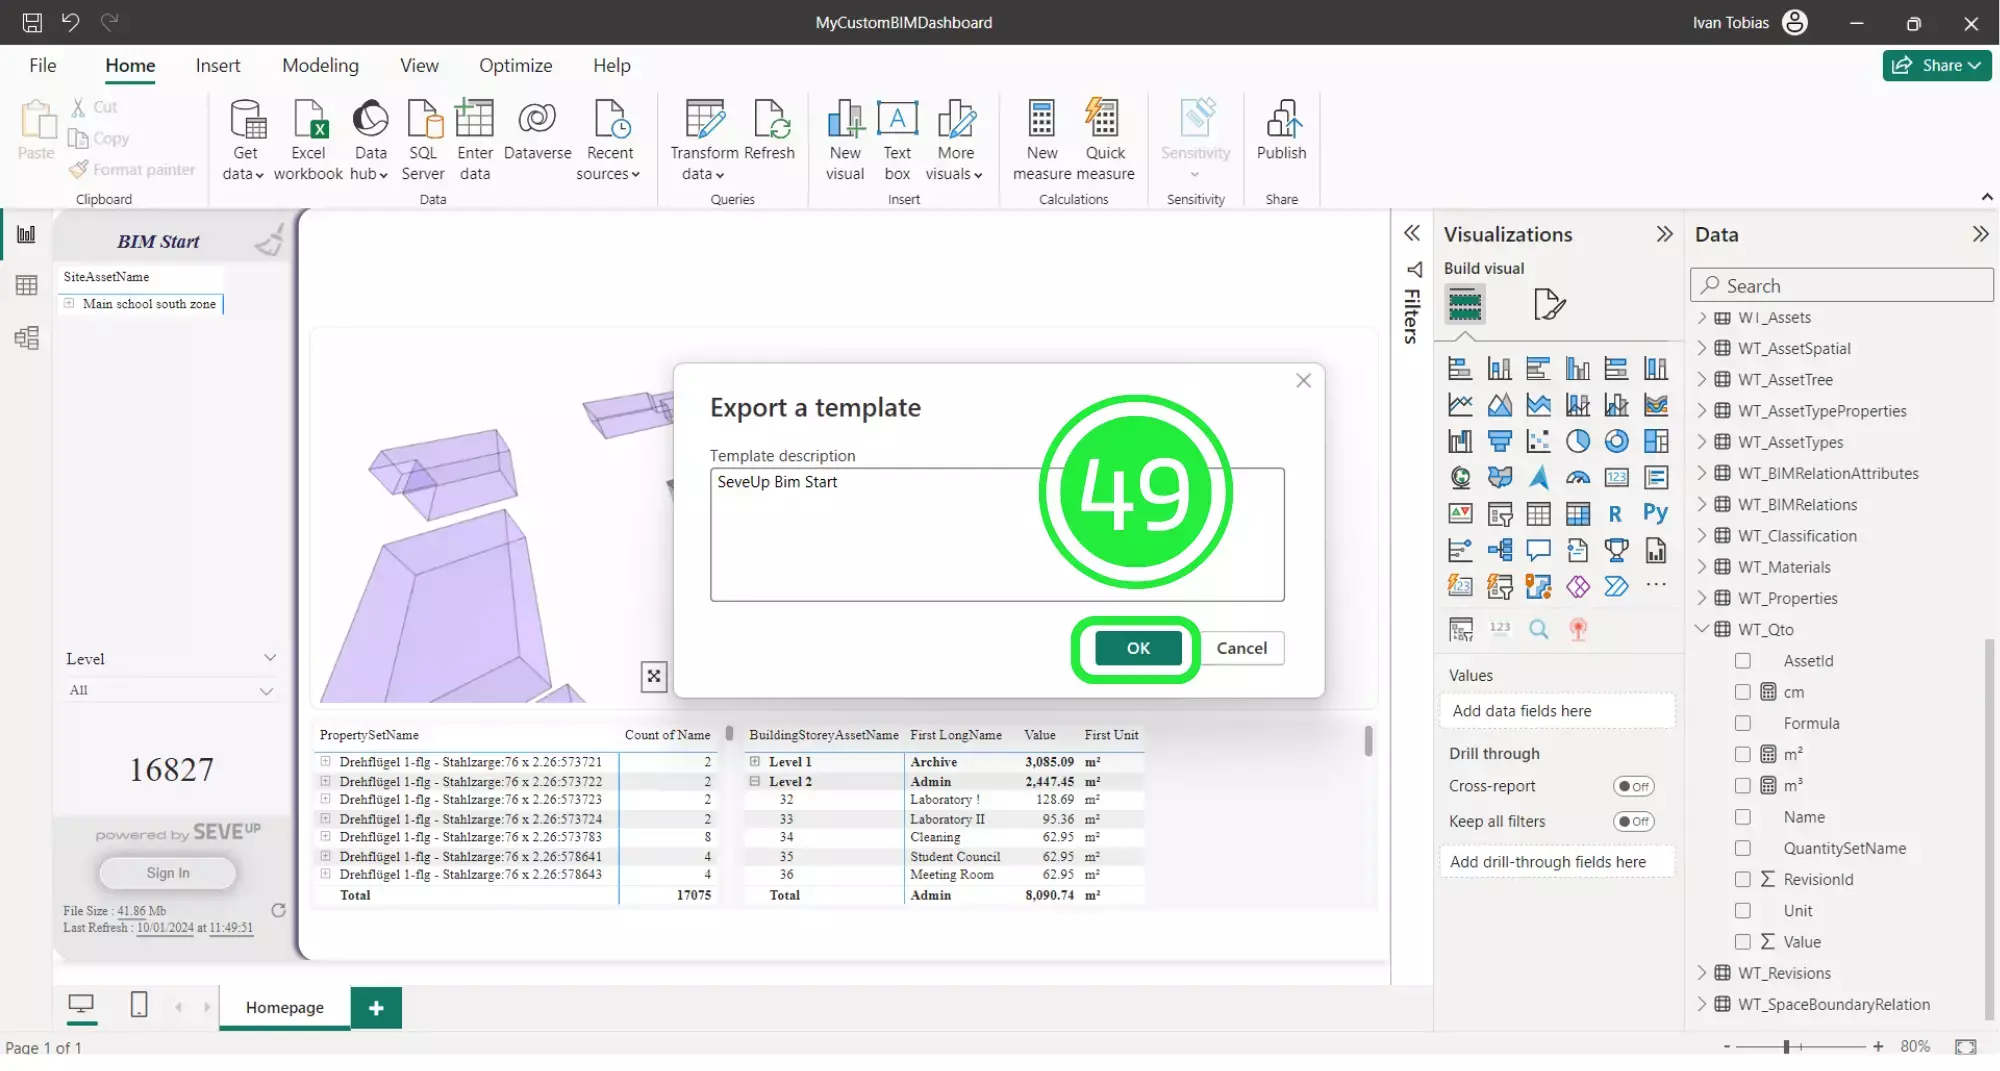
Press on “ok” when the “Export a Template” popup appears.
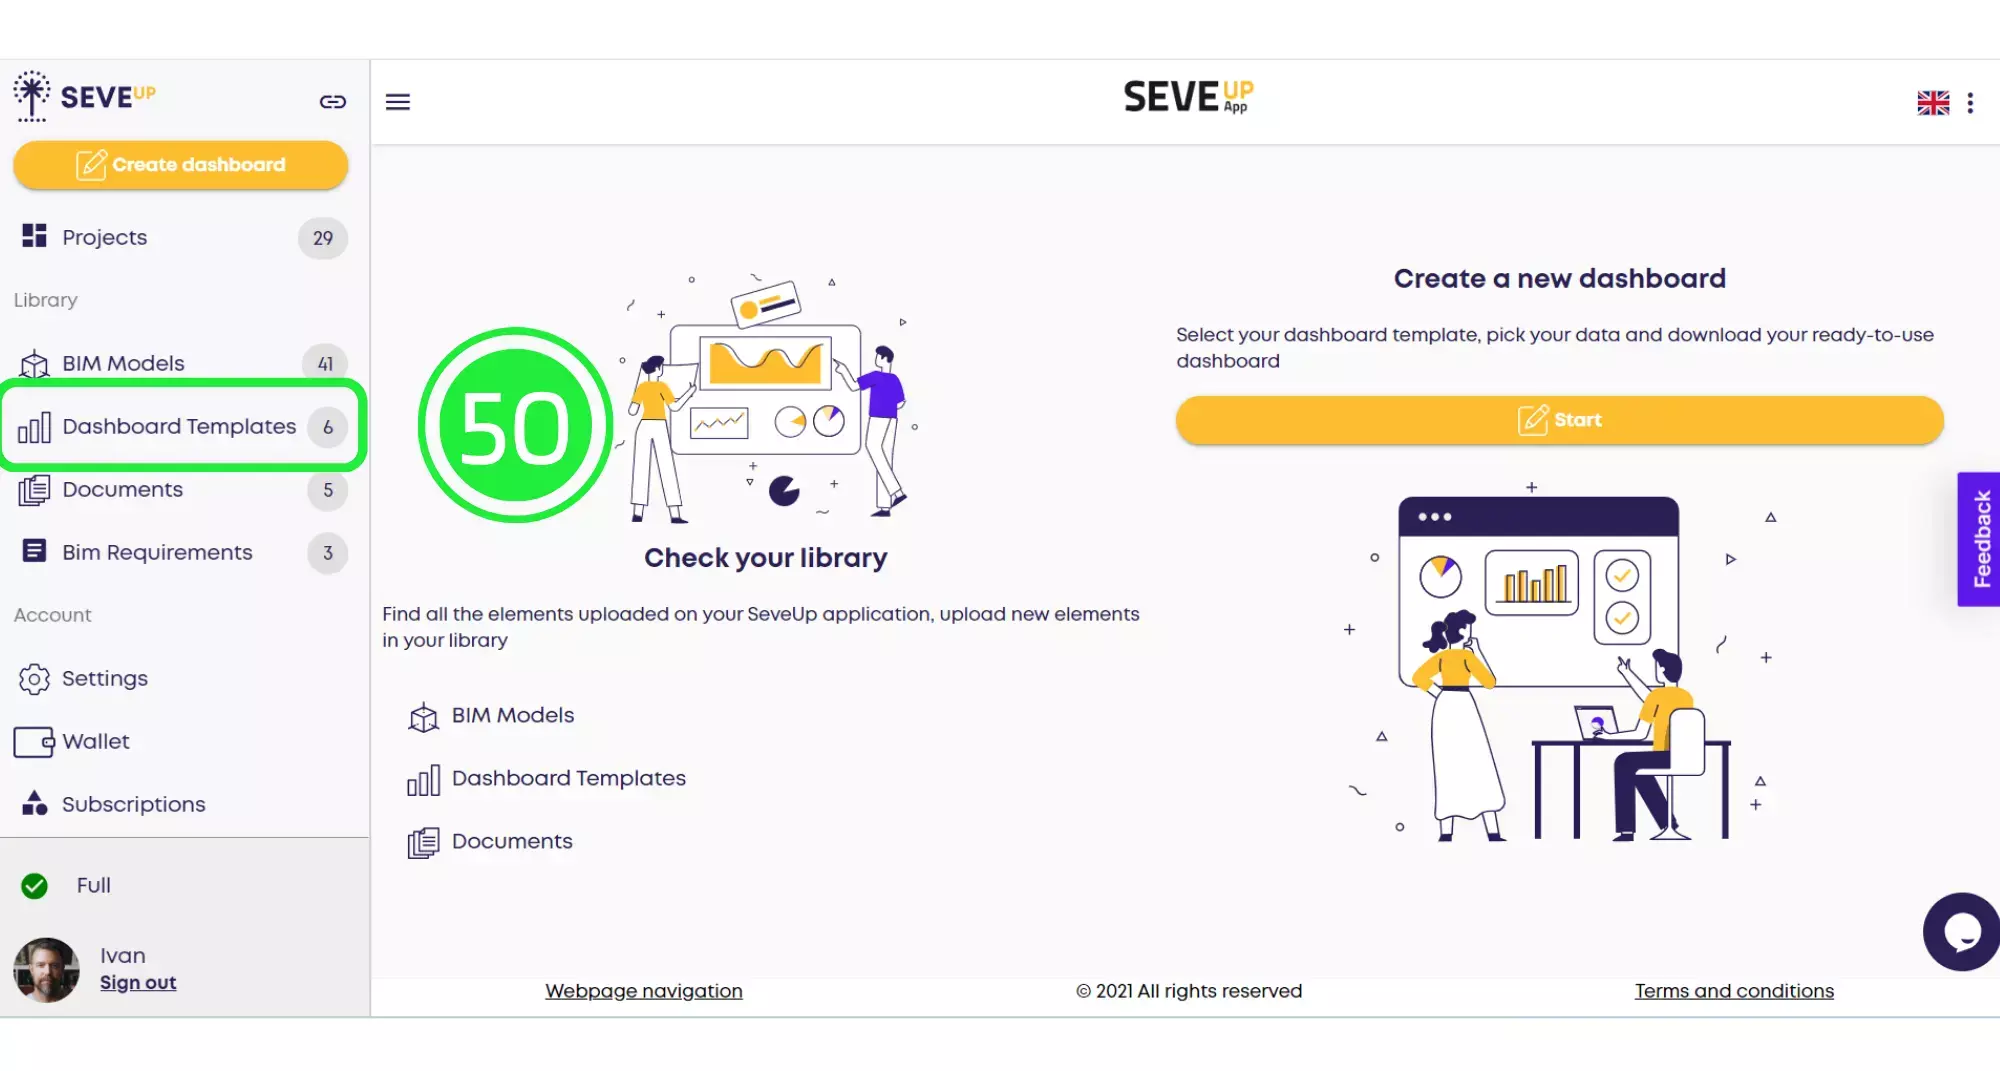
Open the SeveUp App again and click on “Dashboard Templates” on the left hand side.
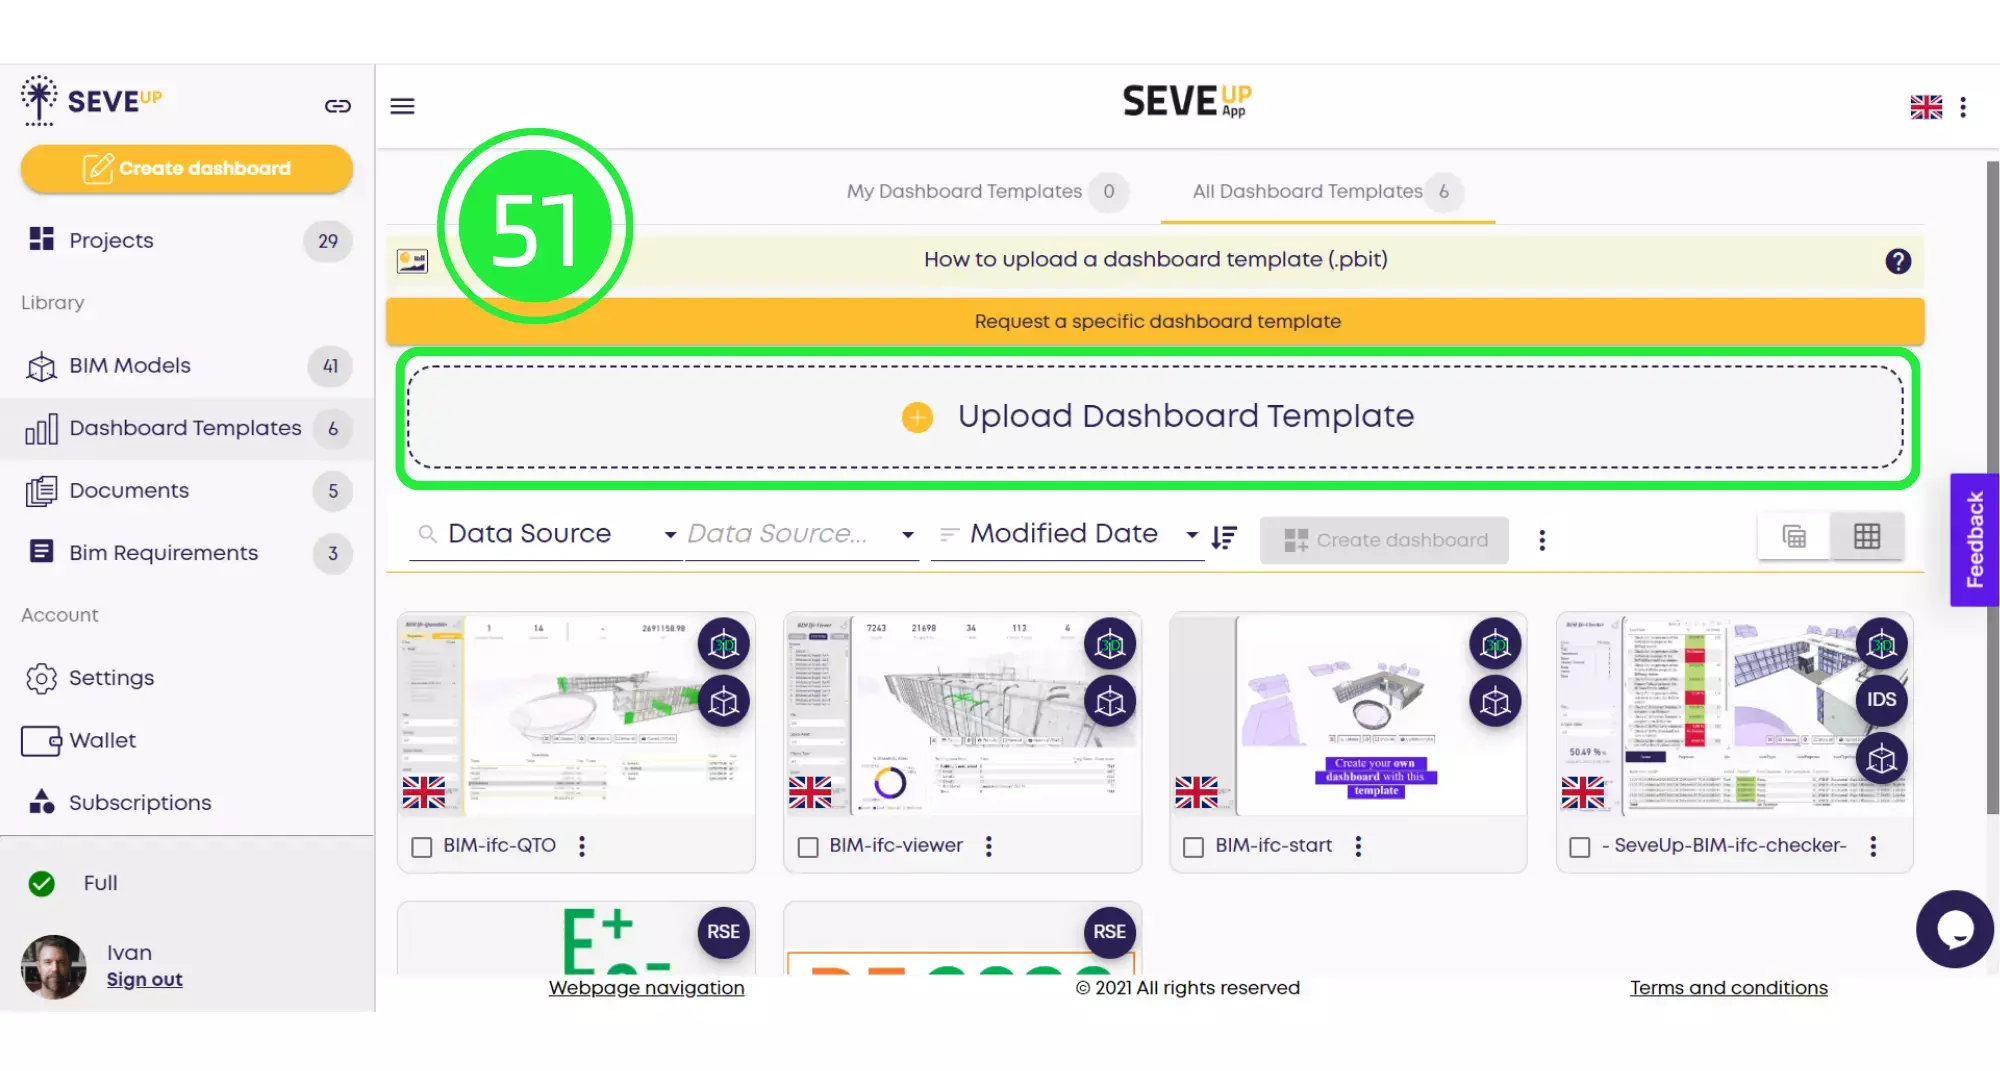
Click on the large “Upload Dashboard Template” button in the centre of the folder.
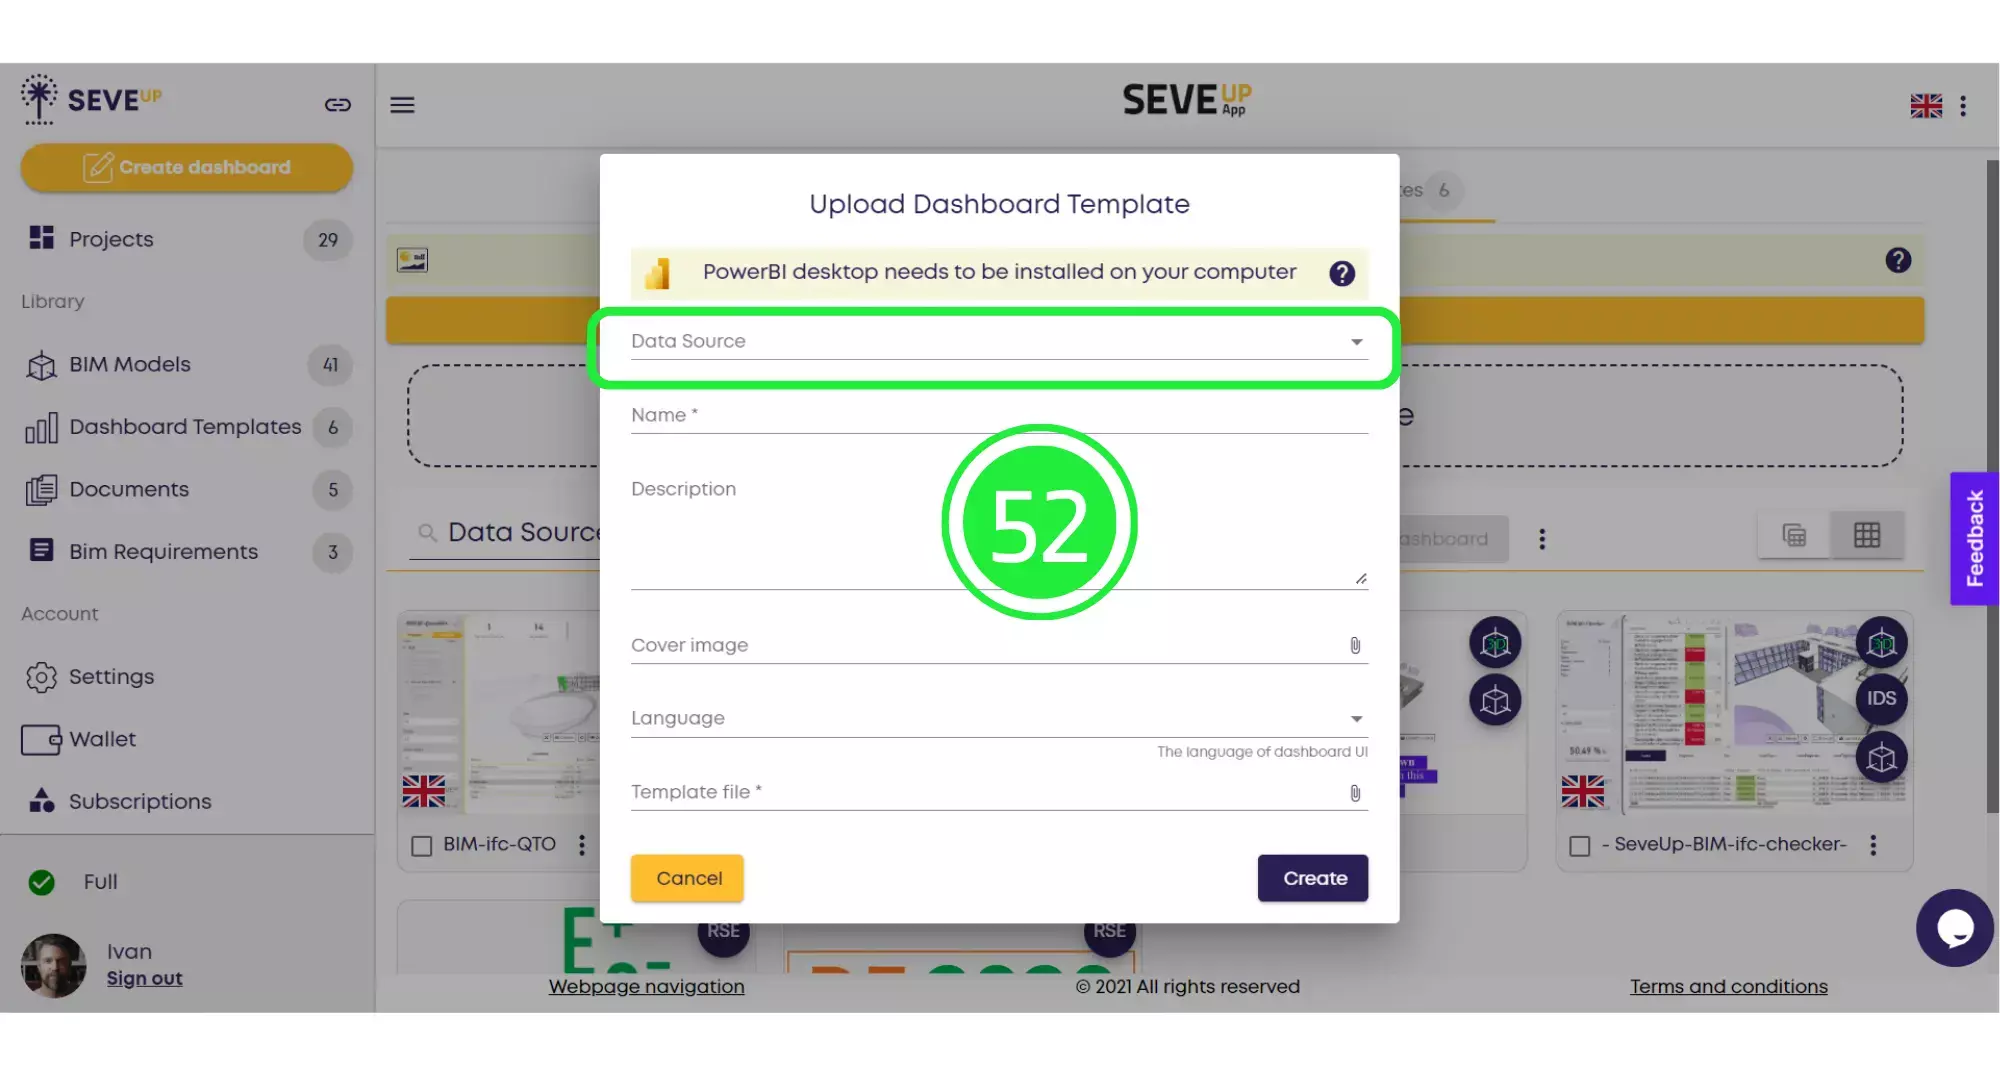
When the pop-up appears, click on “Data Source”.
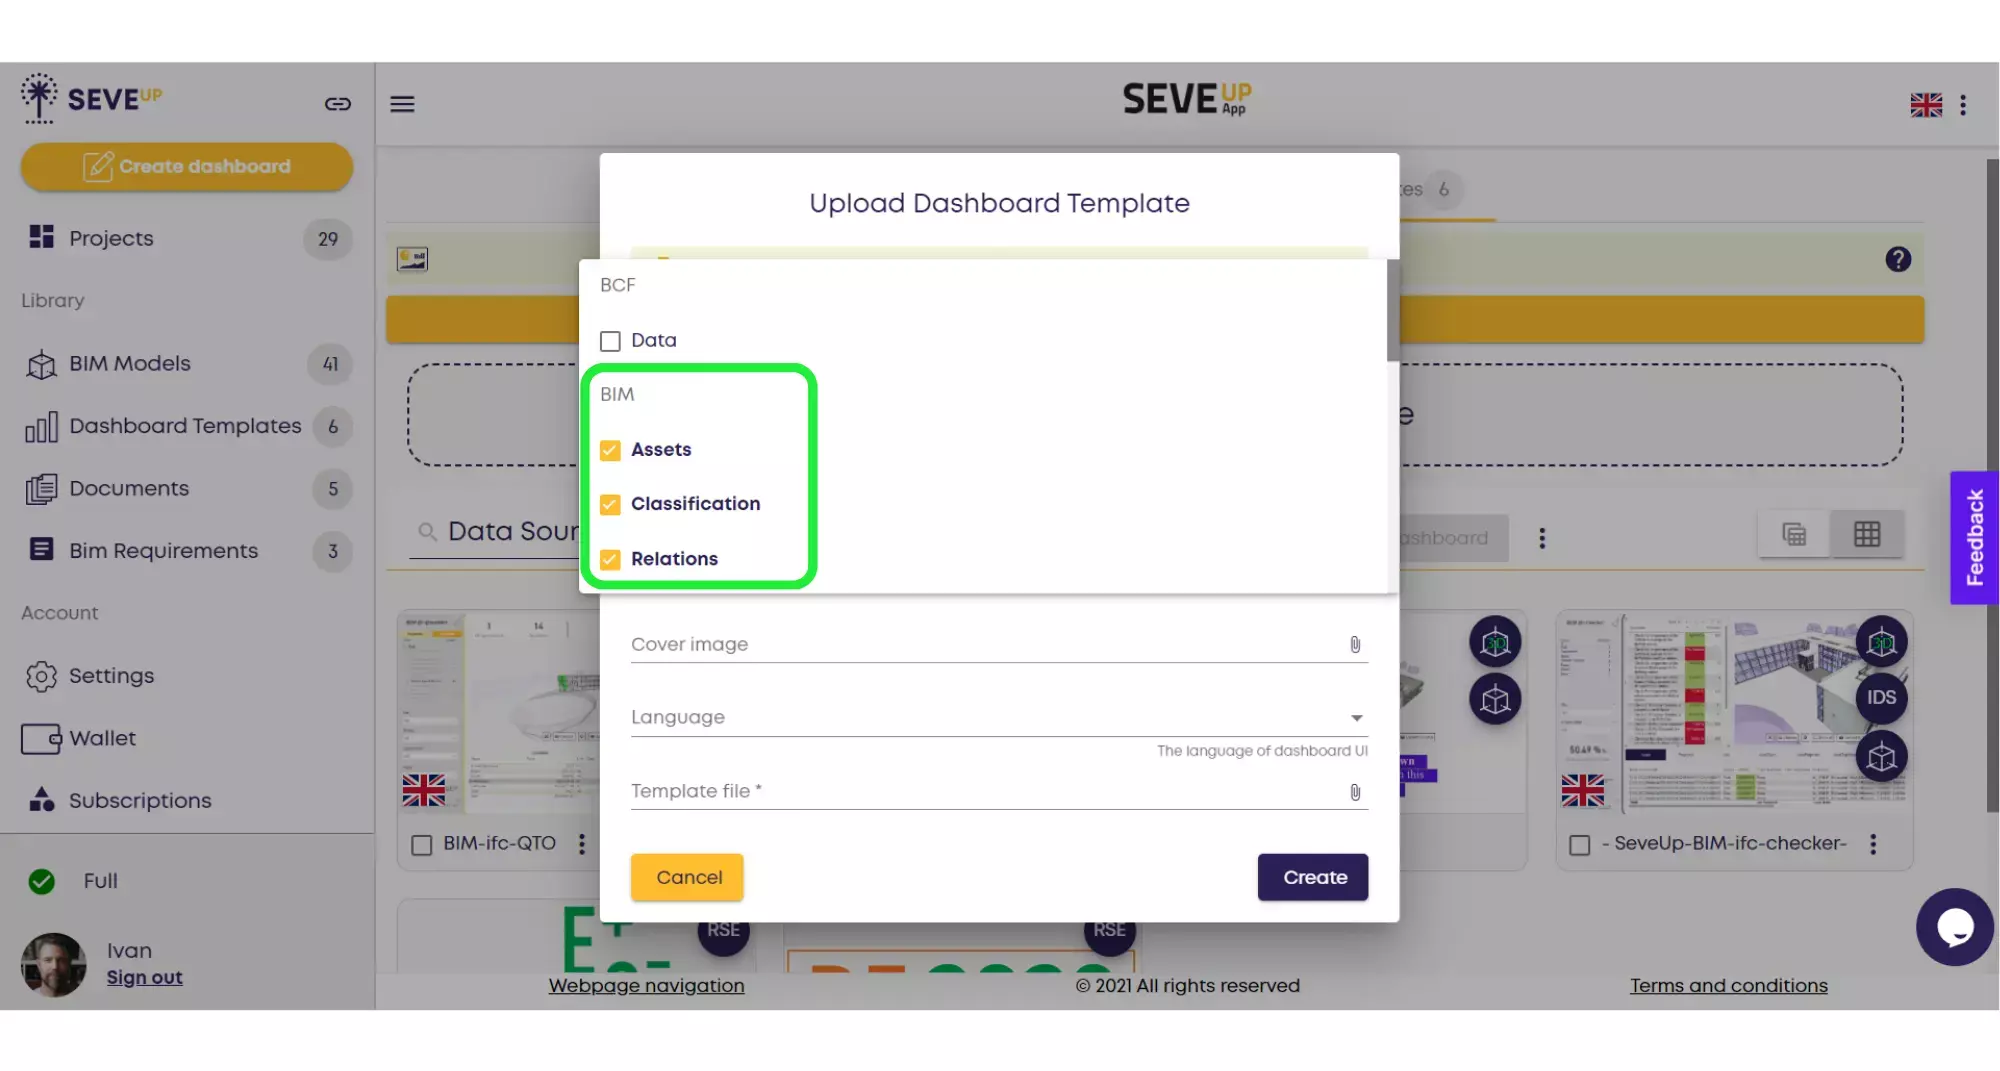
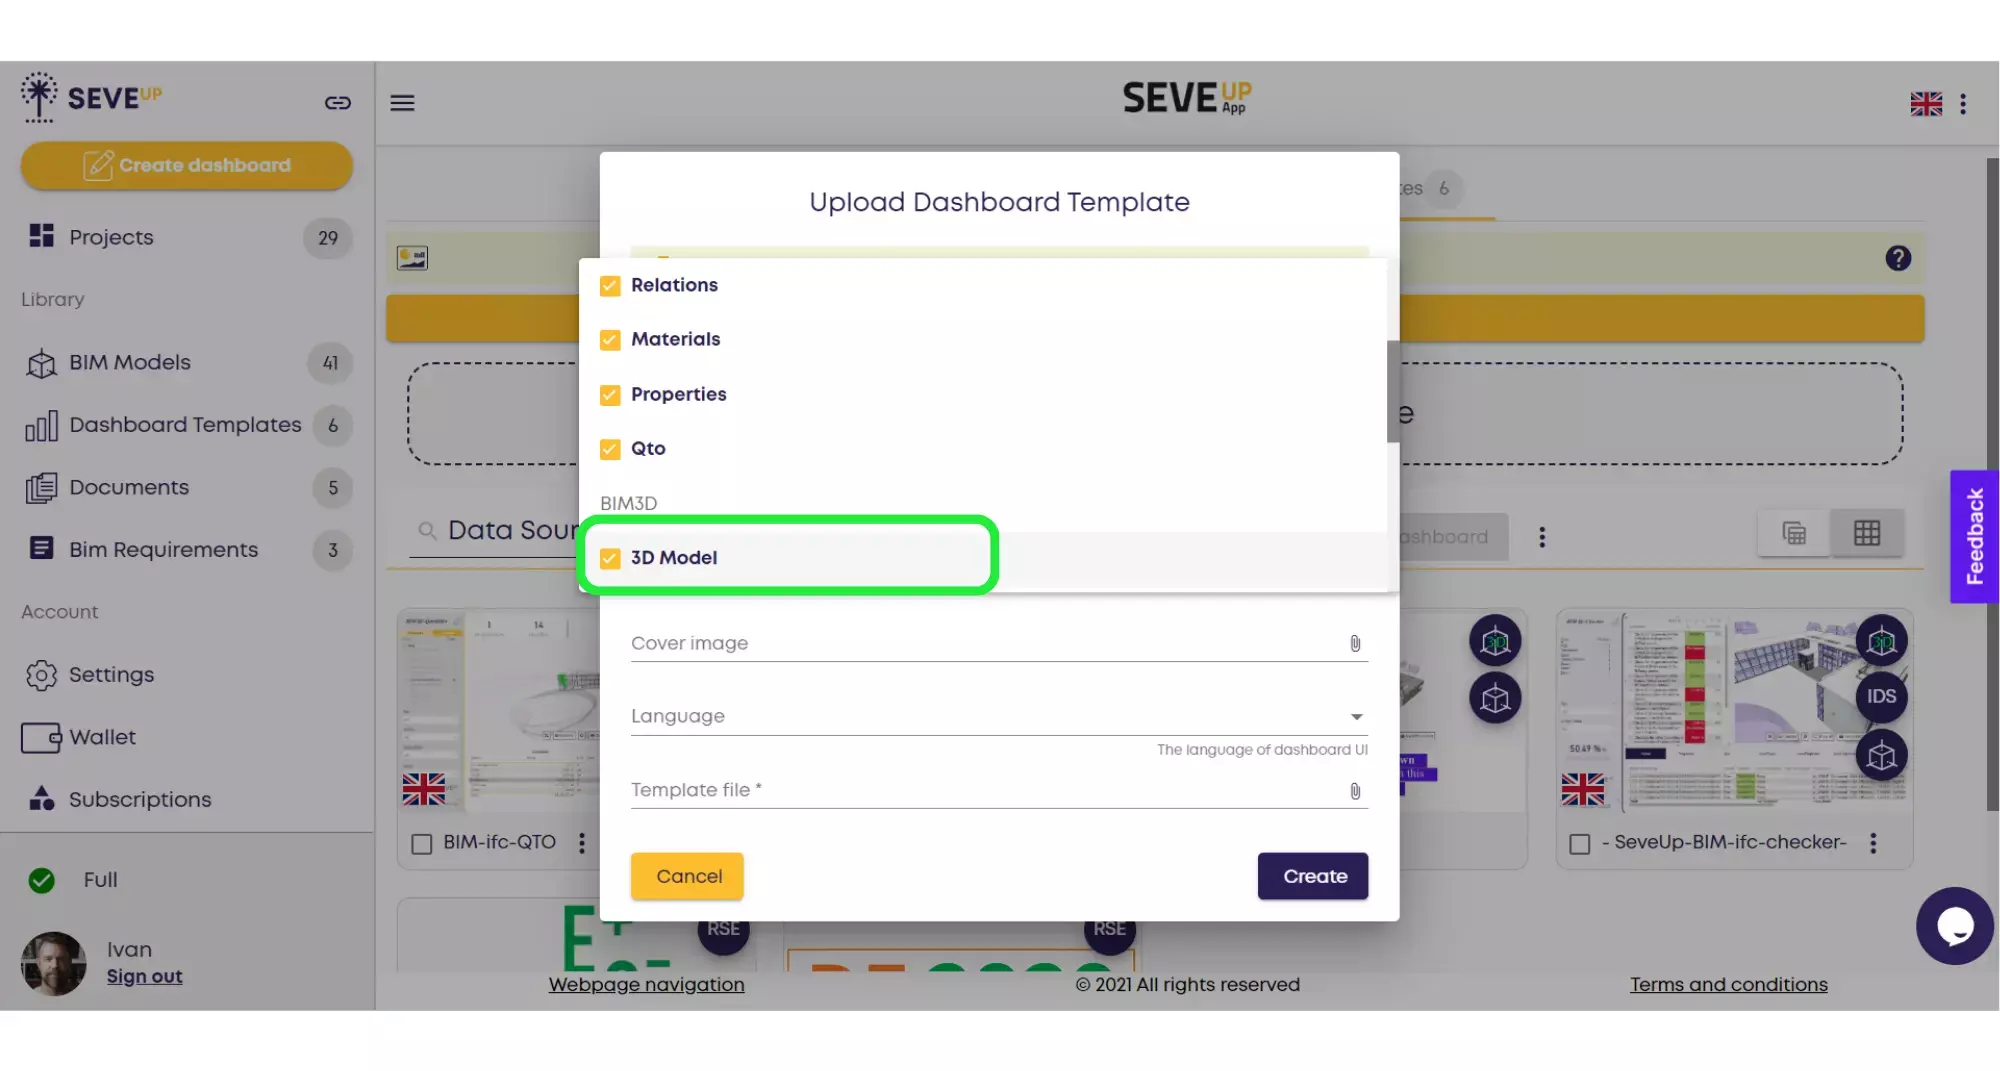
Check off all of the groups of tables under BIM and also make sure to check the BIM 3D option so that the 3D model is included as well.
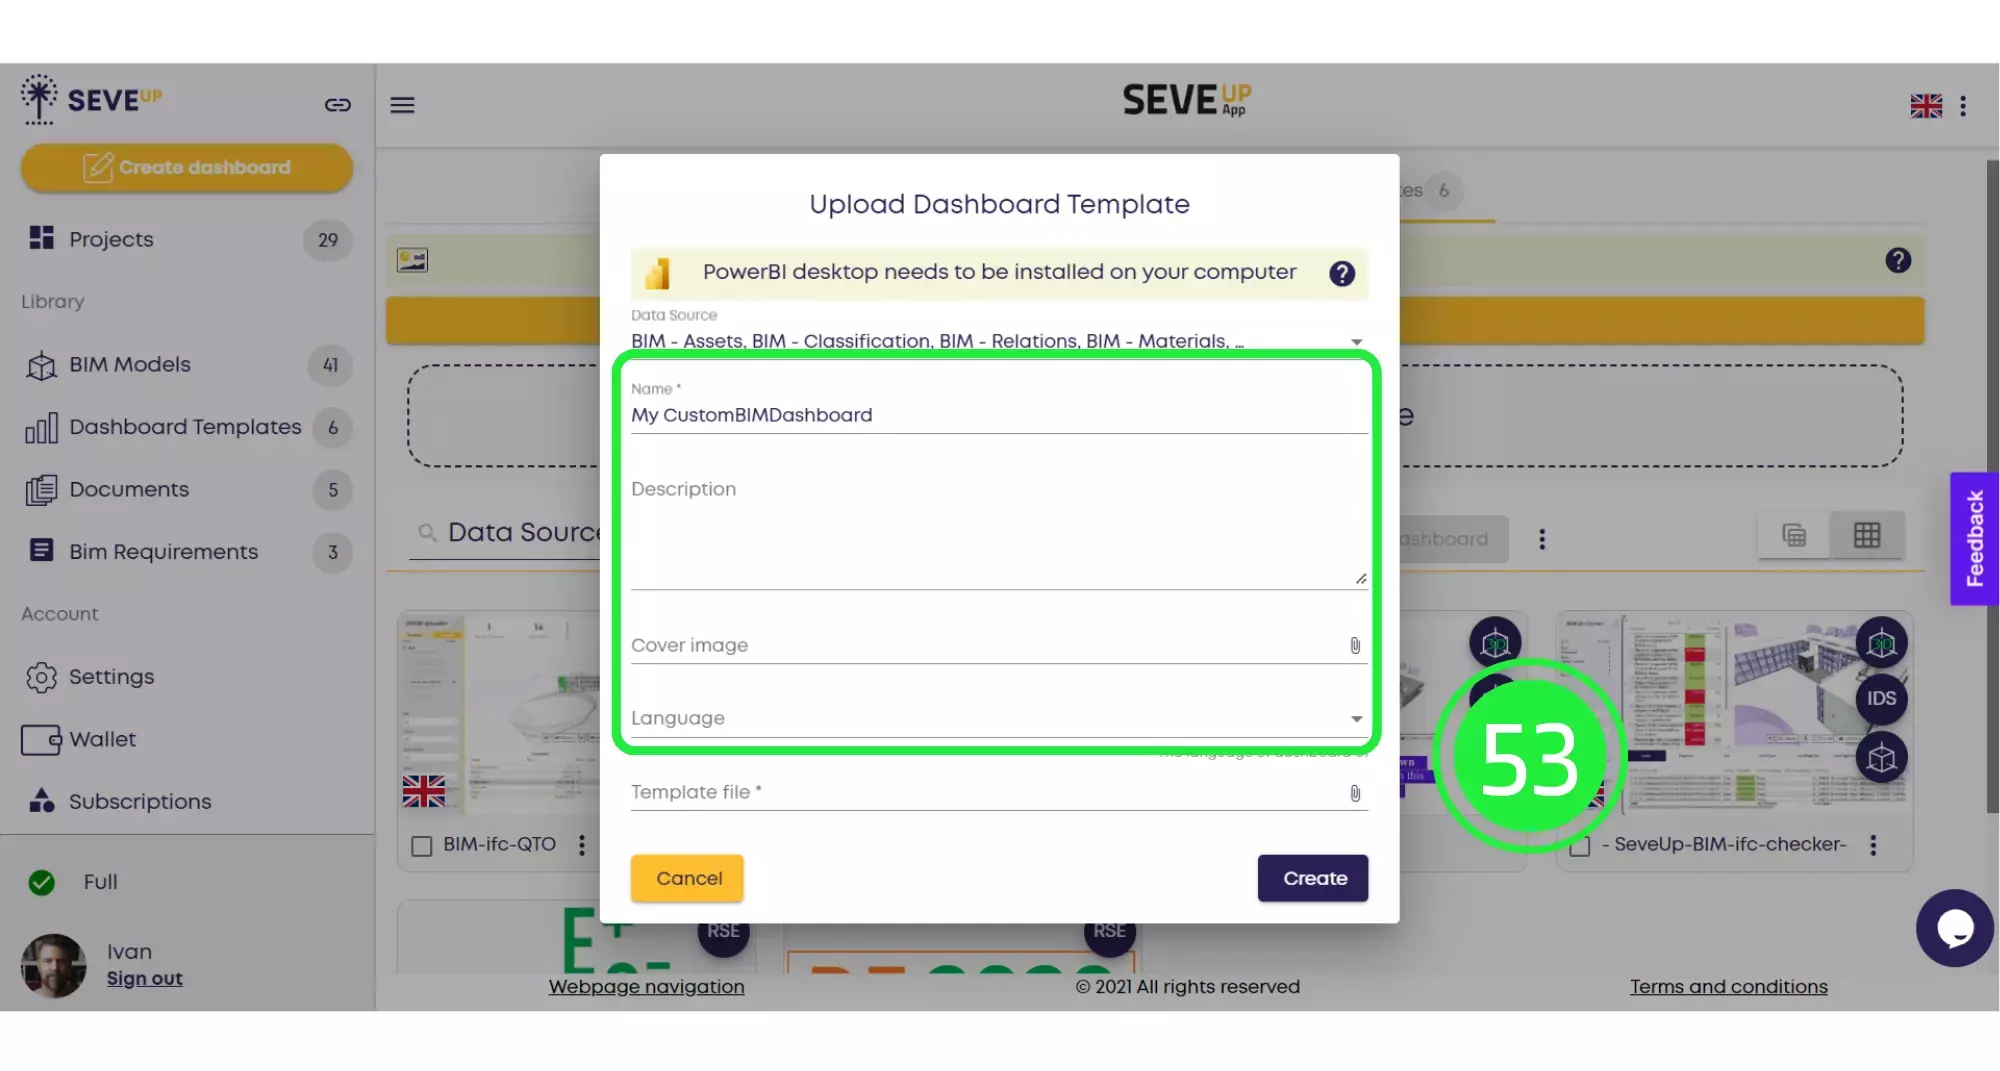
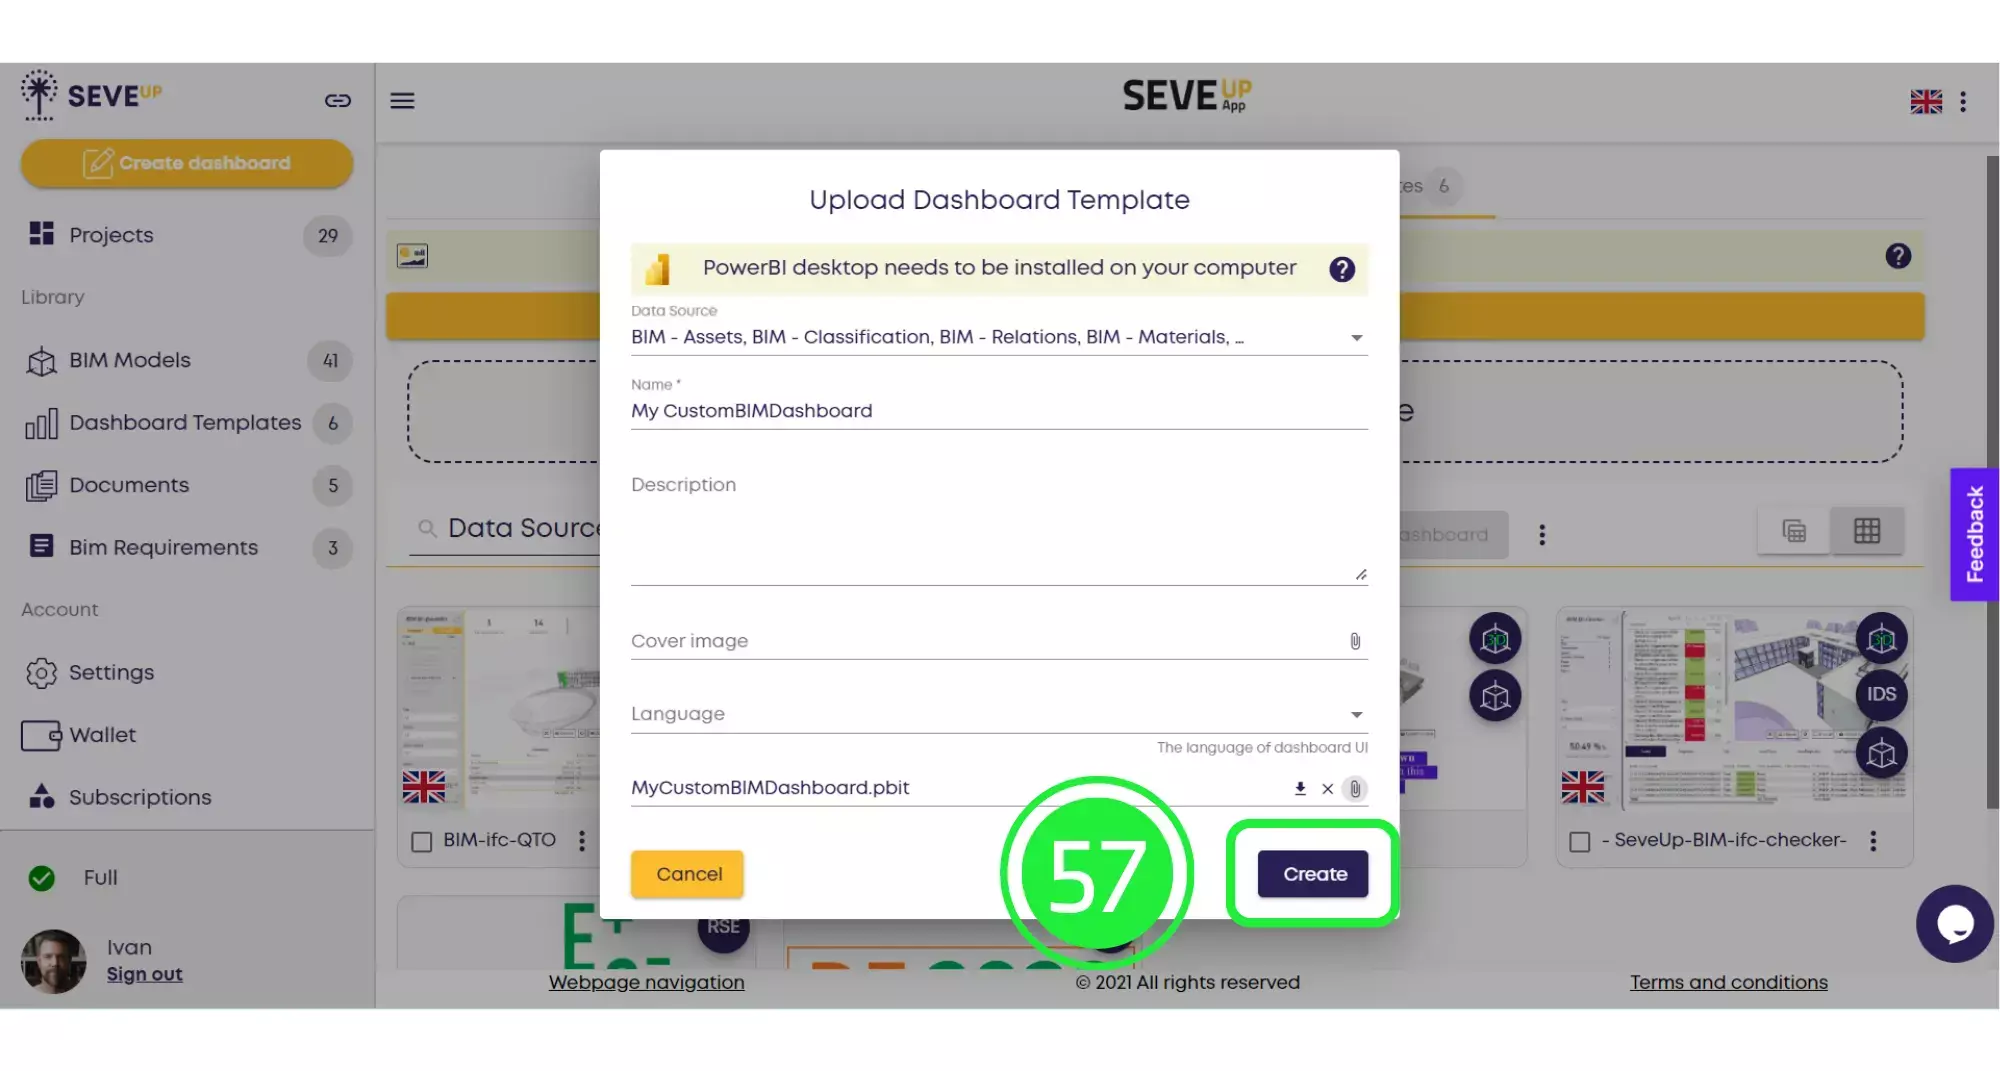
Enter the name and description of your project. You can also attach a cover image or choose a different language.
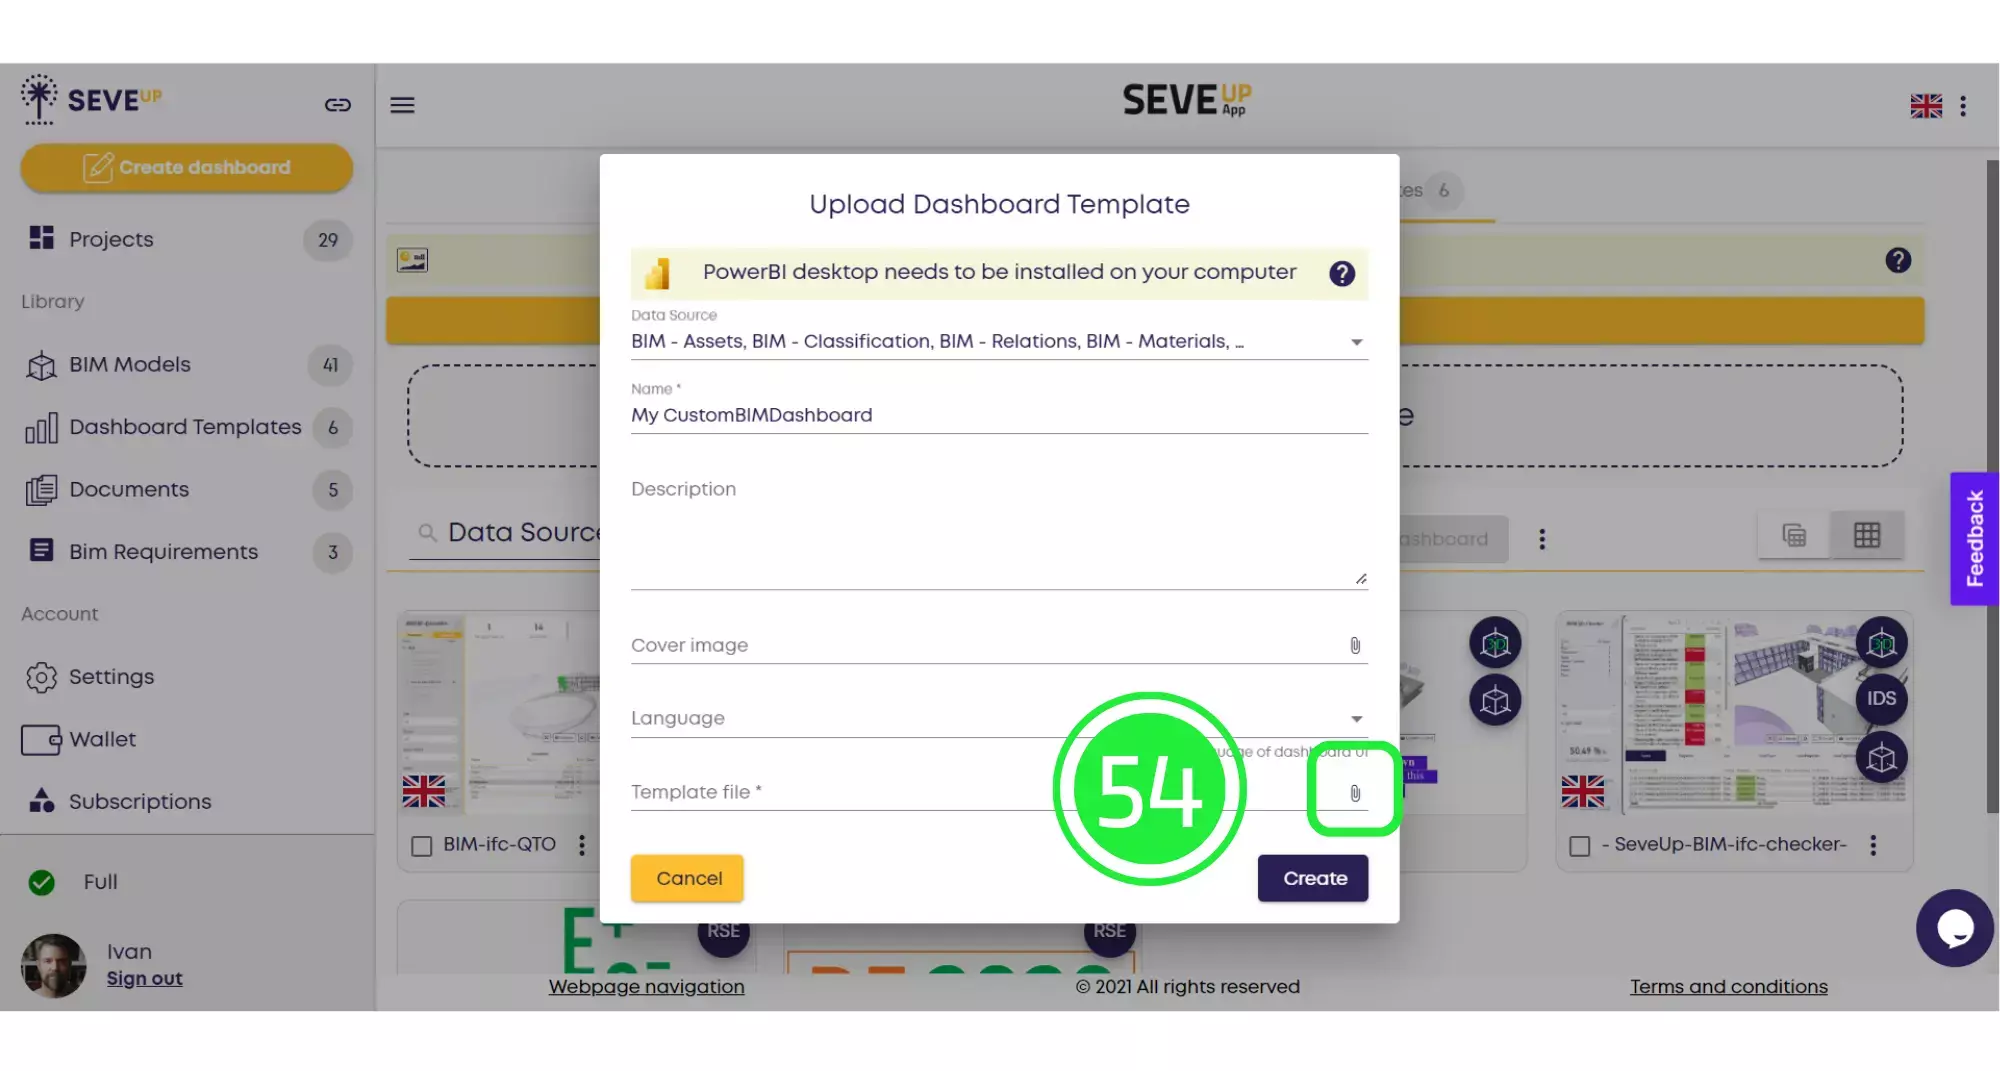
Click on the “Attach File” icon on the “Template File” line.
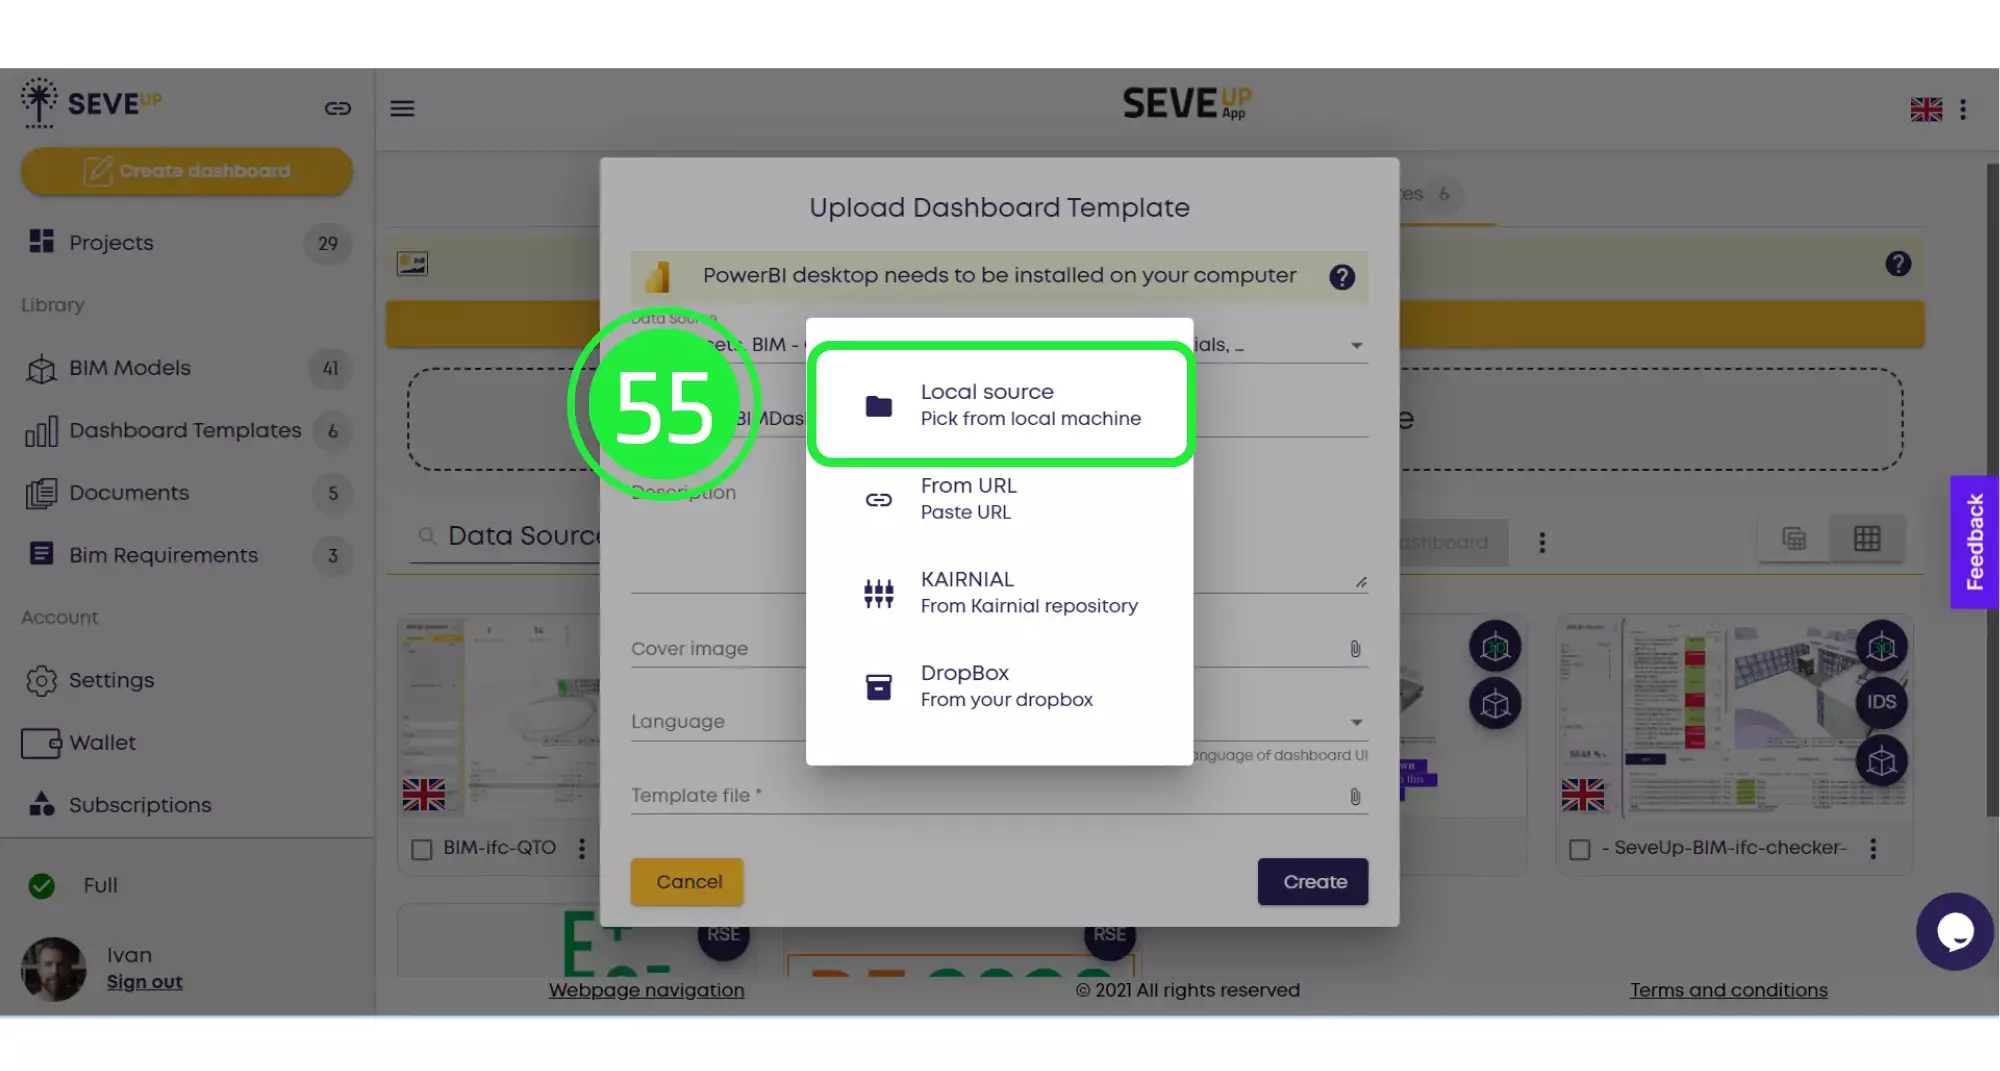
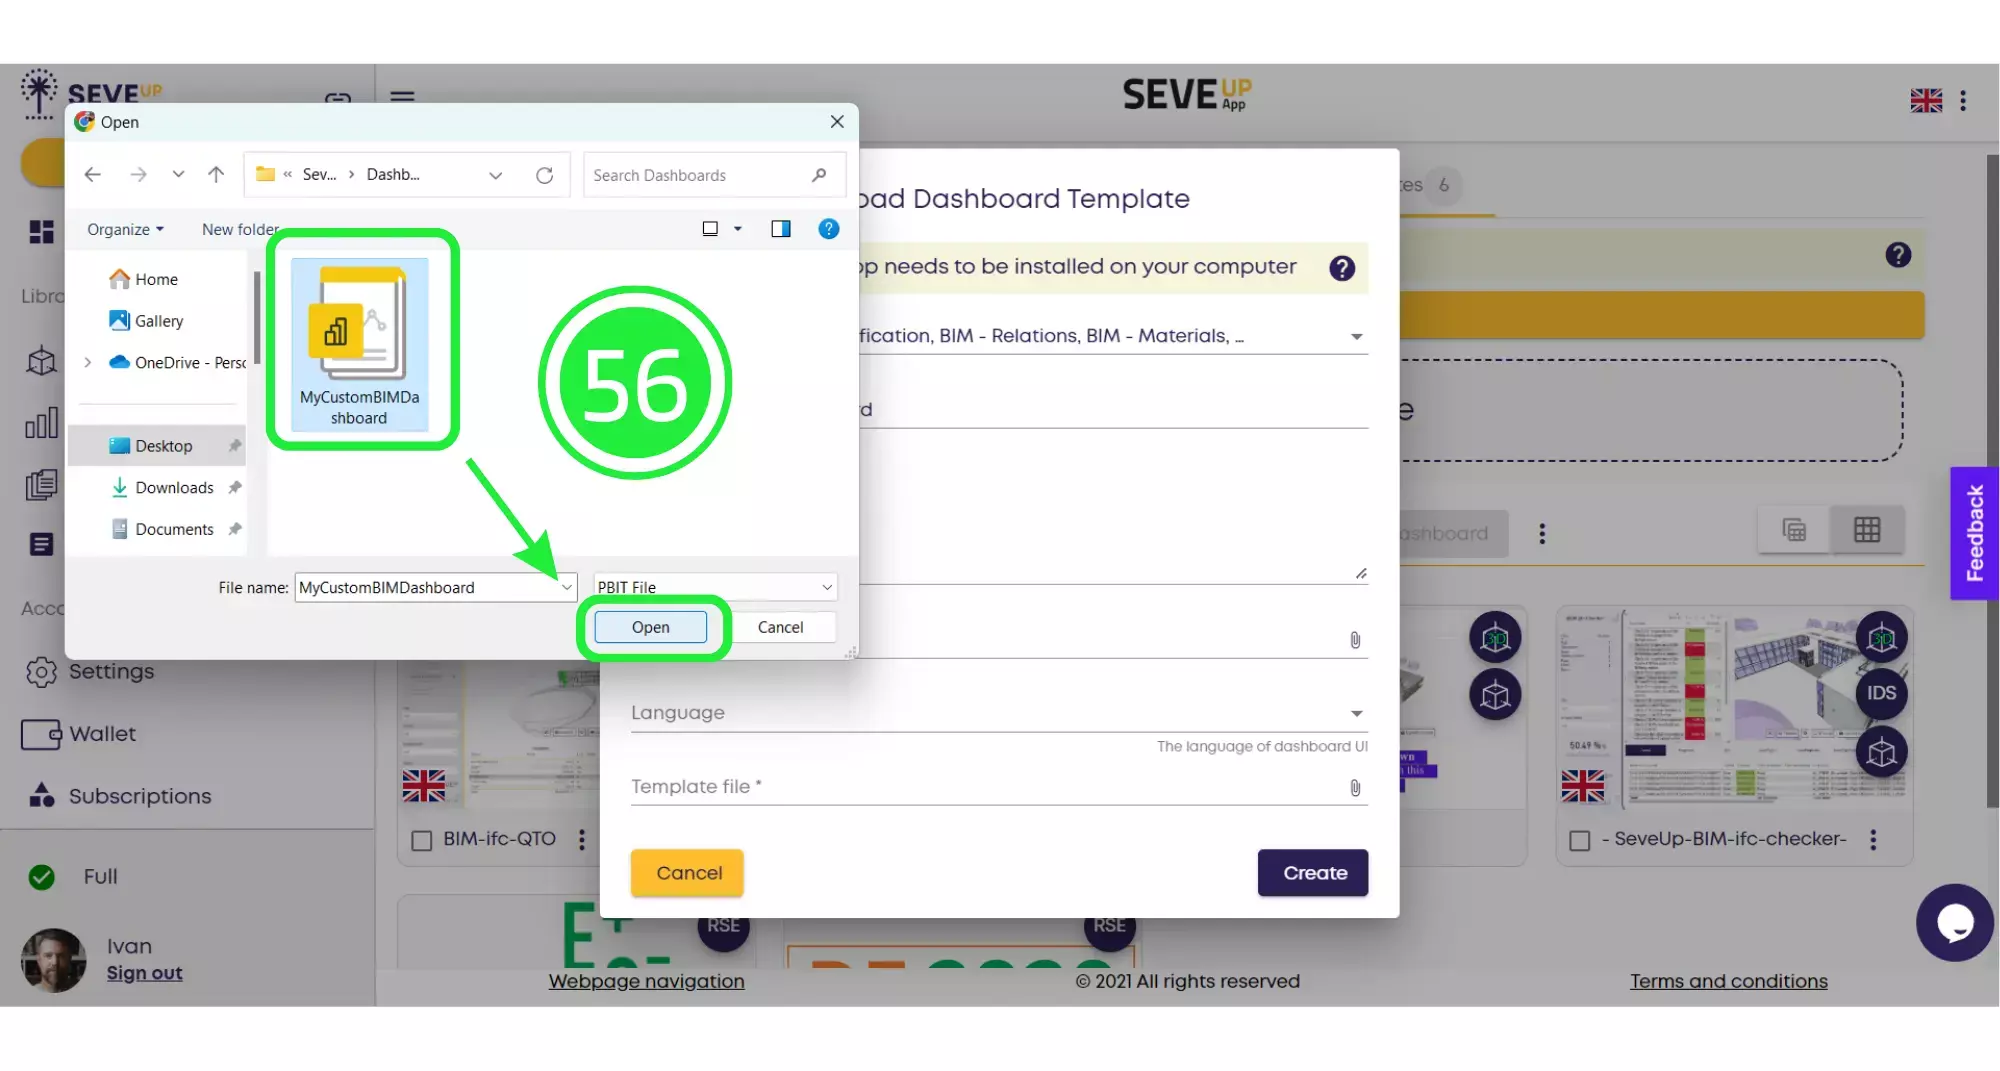
From the pop-up menu choose “Local Source” to attach the file from your computer.
Select your template and click on “Open”.
Click on “Create” to finish uploading your template into the SeveUp app.
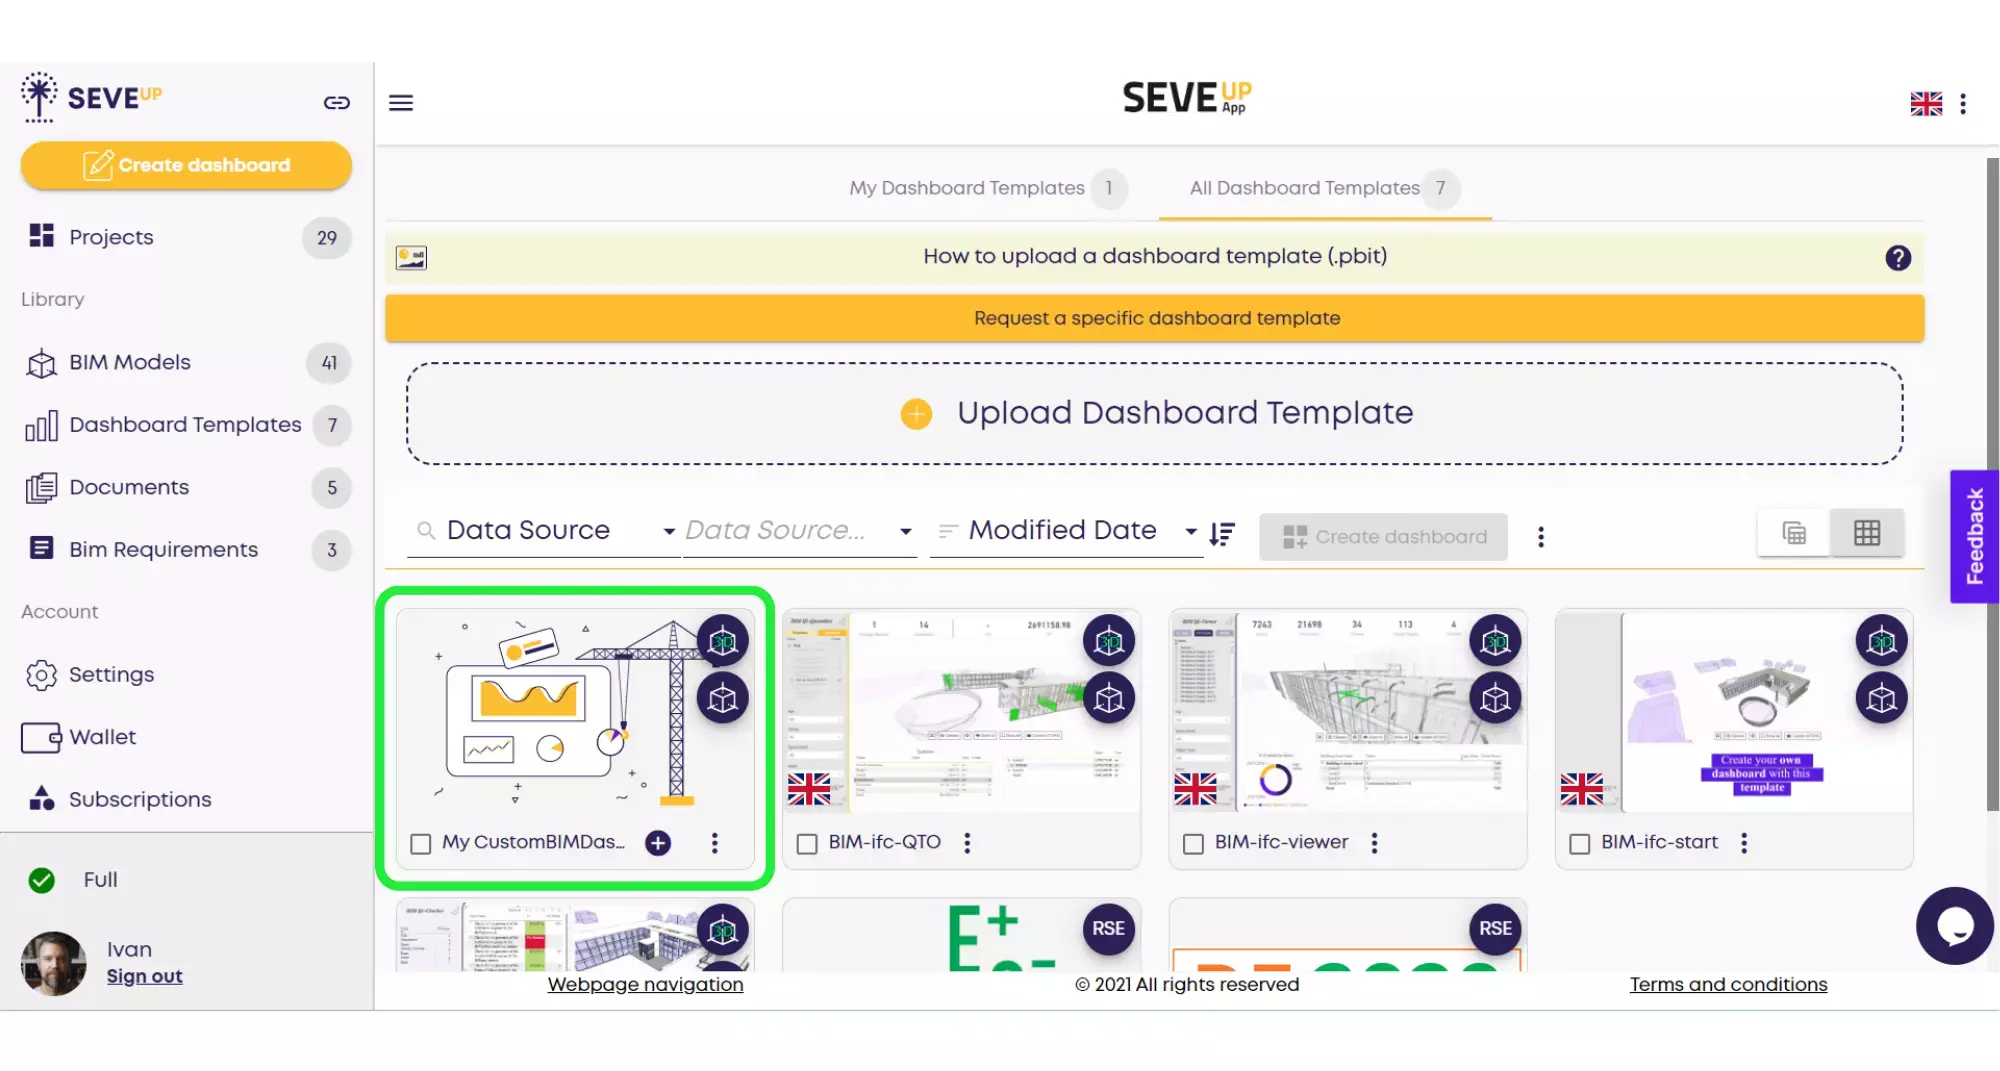
Your newly created template file will now appear in the Dashboard Templates folder and it can be used in any number of projects without the need to create a brand new template each time.
Want to get started with your very own BIM project? You’ll be surprised by just how easy it is. Create your own free account is SeveUp today and give it a try.


Want to get started with your very own BIM project? You’ll be surprised by just how easy it is. Create your own free account is SeveUp today and give it a try.

Unlock the power of your building data with SeveUp. Tailored dashboards, seamless integration
🎓 Free BIM Checker Training Learn how to automate your BIM model checks and get certified. Register for Free Click
Learn More🎓 Free BIM Checker Training Learn how to automate your BIM model checks and get certified. Register for Free Click
Learn More🎓 Free BIM Checker Training Learn how to automate your BIM model checks and get certified. Register for Free Choose
Learn More