Trusted by companies
all over the world:
Our comprehensive guide to Power BI Report Publishing explores the nuances of Power BI Dashboard Sharing and includes essential steps like signing in, opening dashboards, and publishing reports. It also delves into organizing reports in workspaces and accessing them in Power BI Service. The article integrates key insights on BIM dashboard creation, Life Cycle Assessment dashboard, and BIM viewer Power BI techniques. Stay updated with the latest Power BI Data Visualization trends and BI Dashboard Techniques to optimize your Power BI utilization. Discover the future of BIM in 2024, highlighting new trends like BIM automation and AI integration.
In the realm of Building Information Modeling (BIM), the integration of Power BI and SeveUp is transformative. This partnership leverages Power BI Service to publish detailed reports, essential for data-driven decisions in BIM projects. Power BI’s advanced visualization tools, combined with SeveUp’s BIM expertise, create a dynamic ecosystem. This blend boosts transparency, facilitates collaboration, and streamlines team communication. Additionally, creating an effective BIM dashboard in Power BI enhances project management significantly.
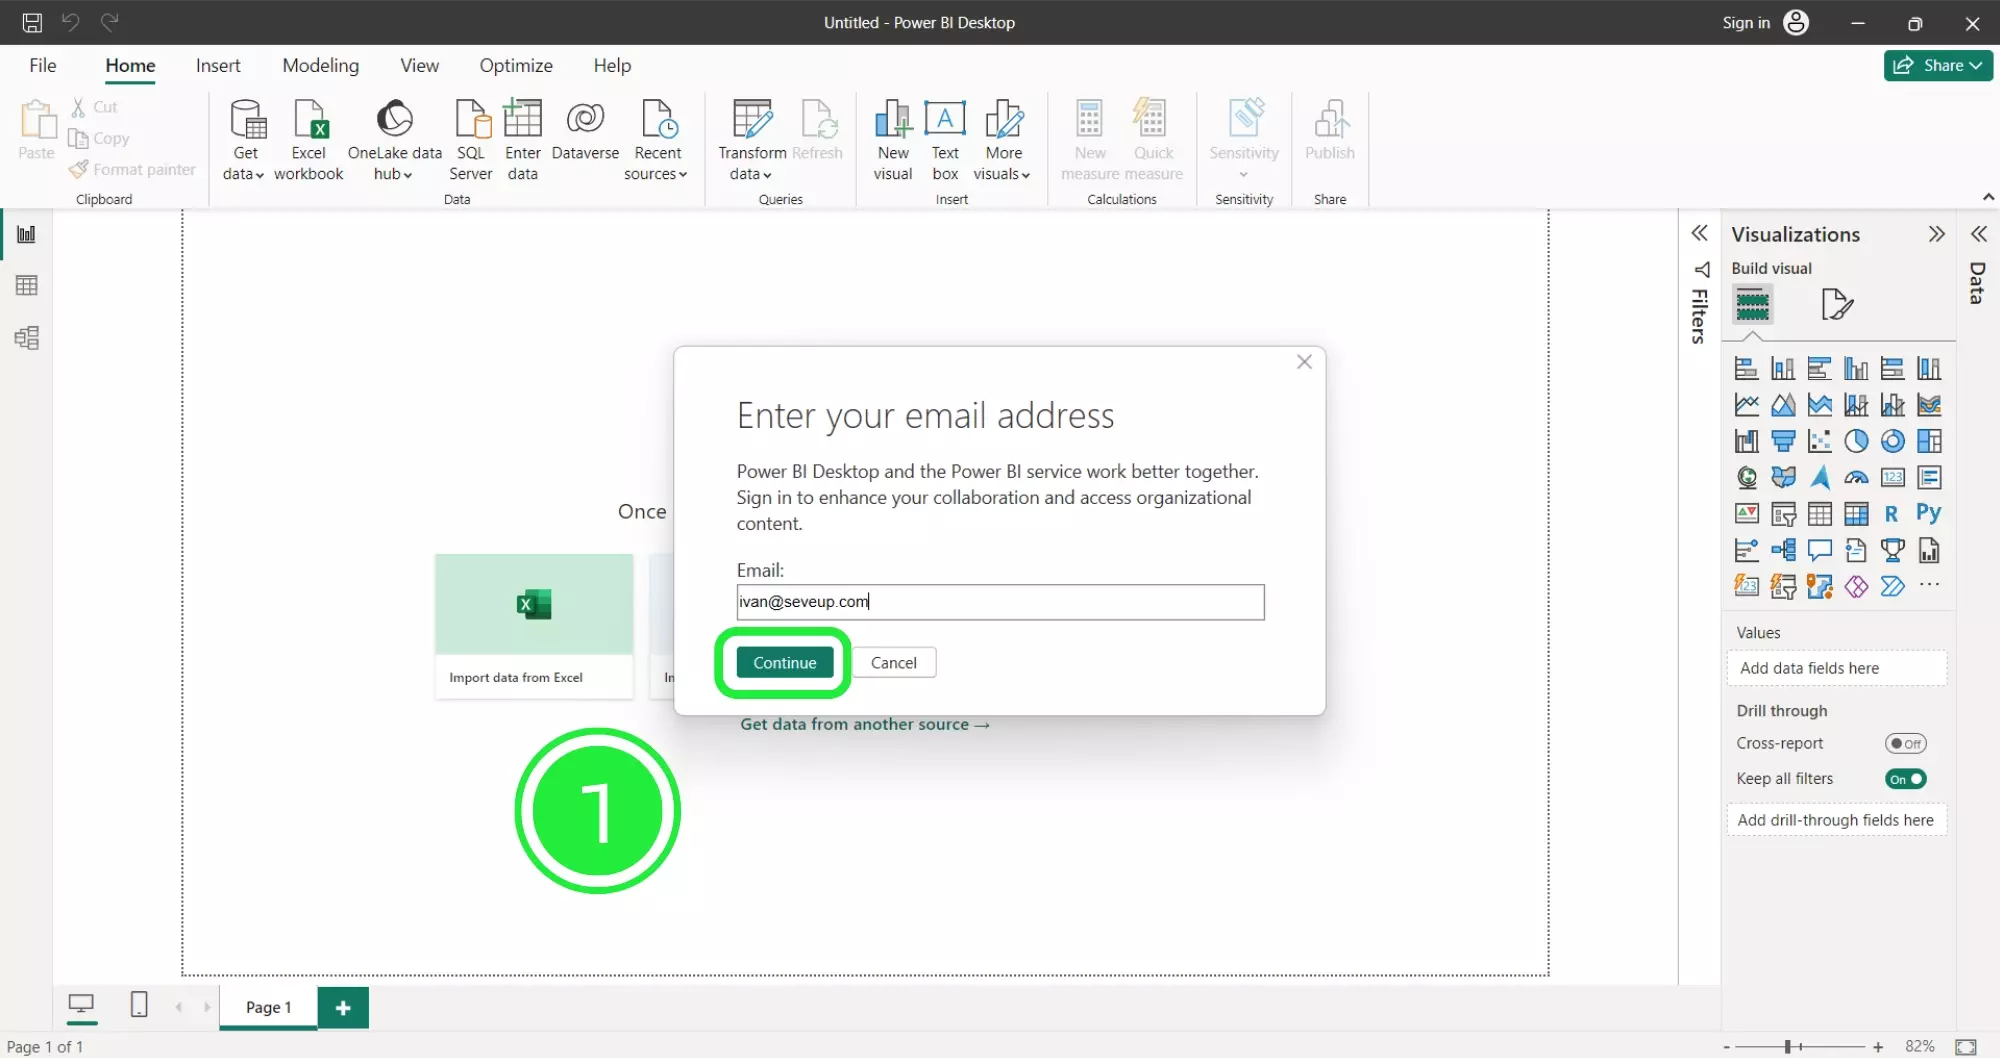
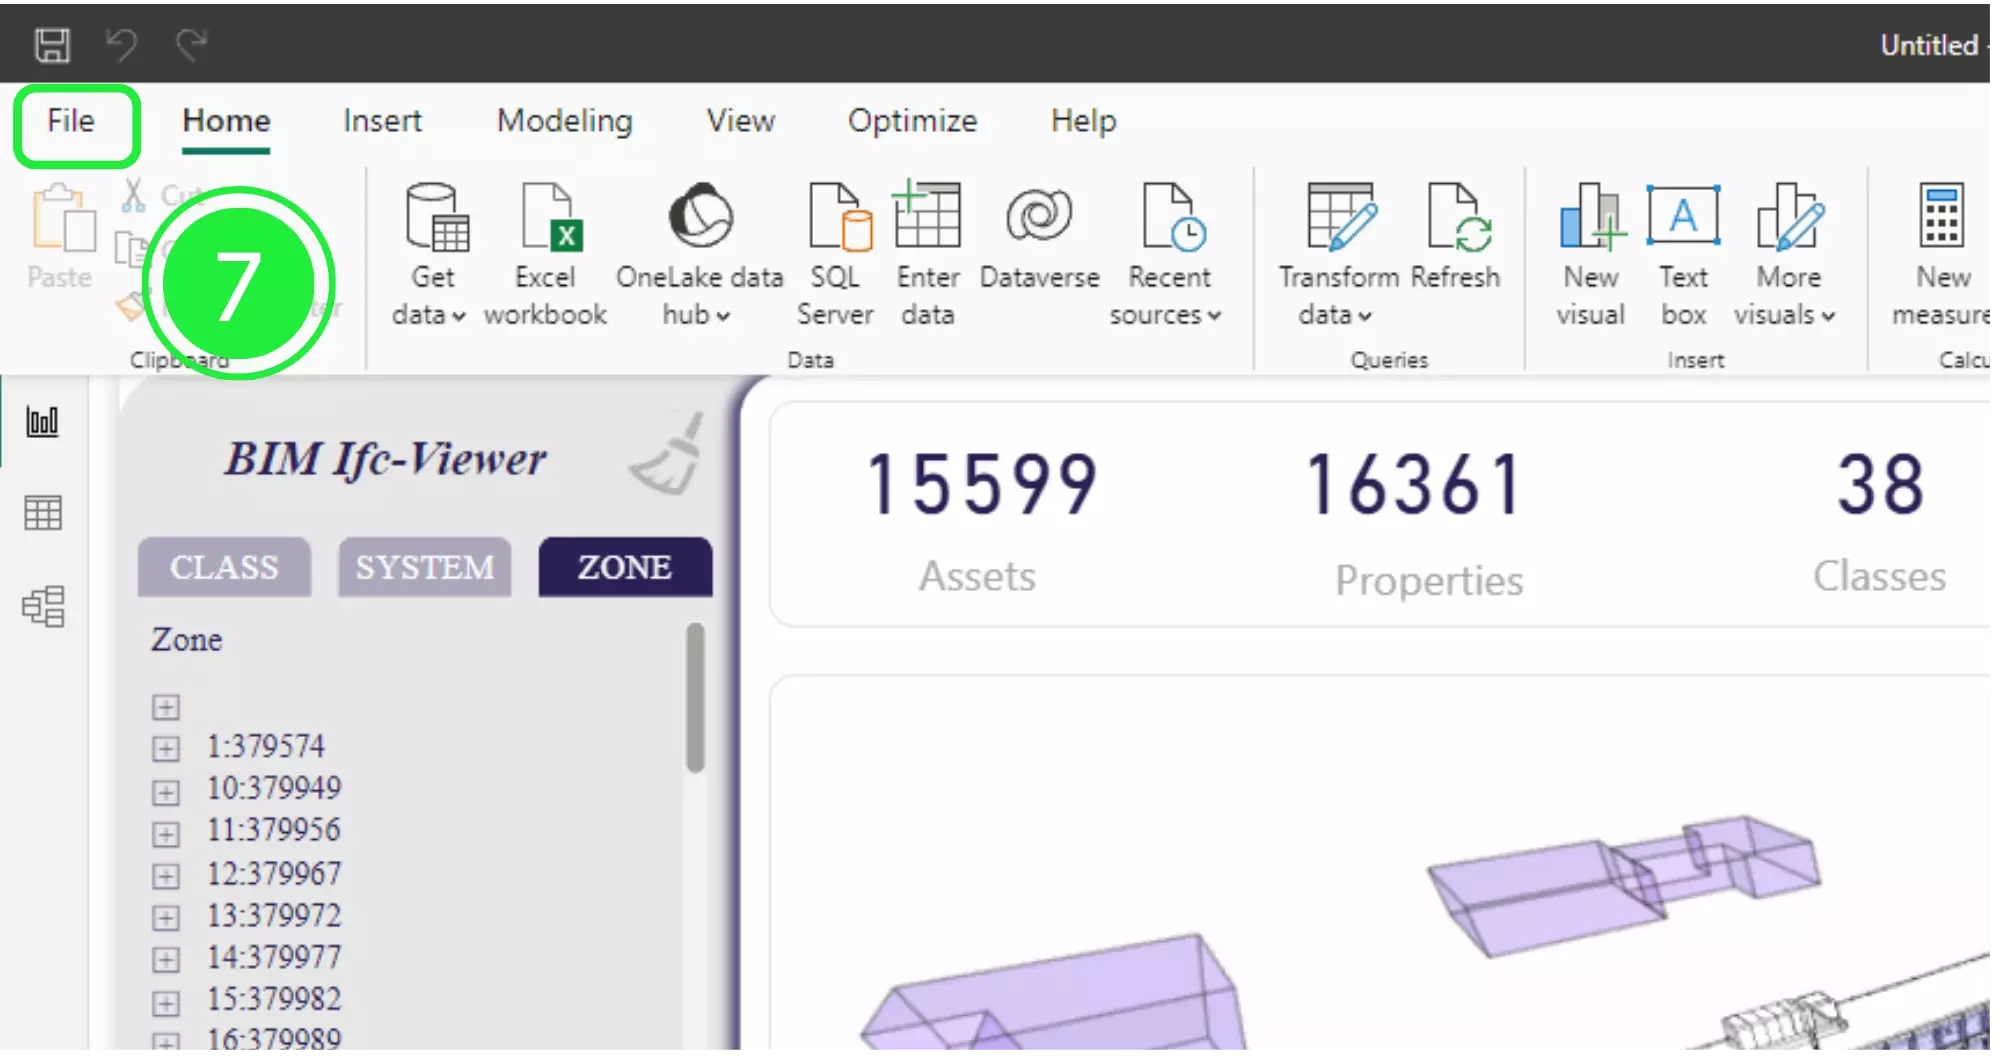
Begin your Power BI journey by logging into Power BI Desktop. This step is crucial for secure access to your dashboards and reports. Furthermore, explore BIM viewer Power BI dashboard for an enhanced experience.
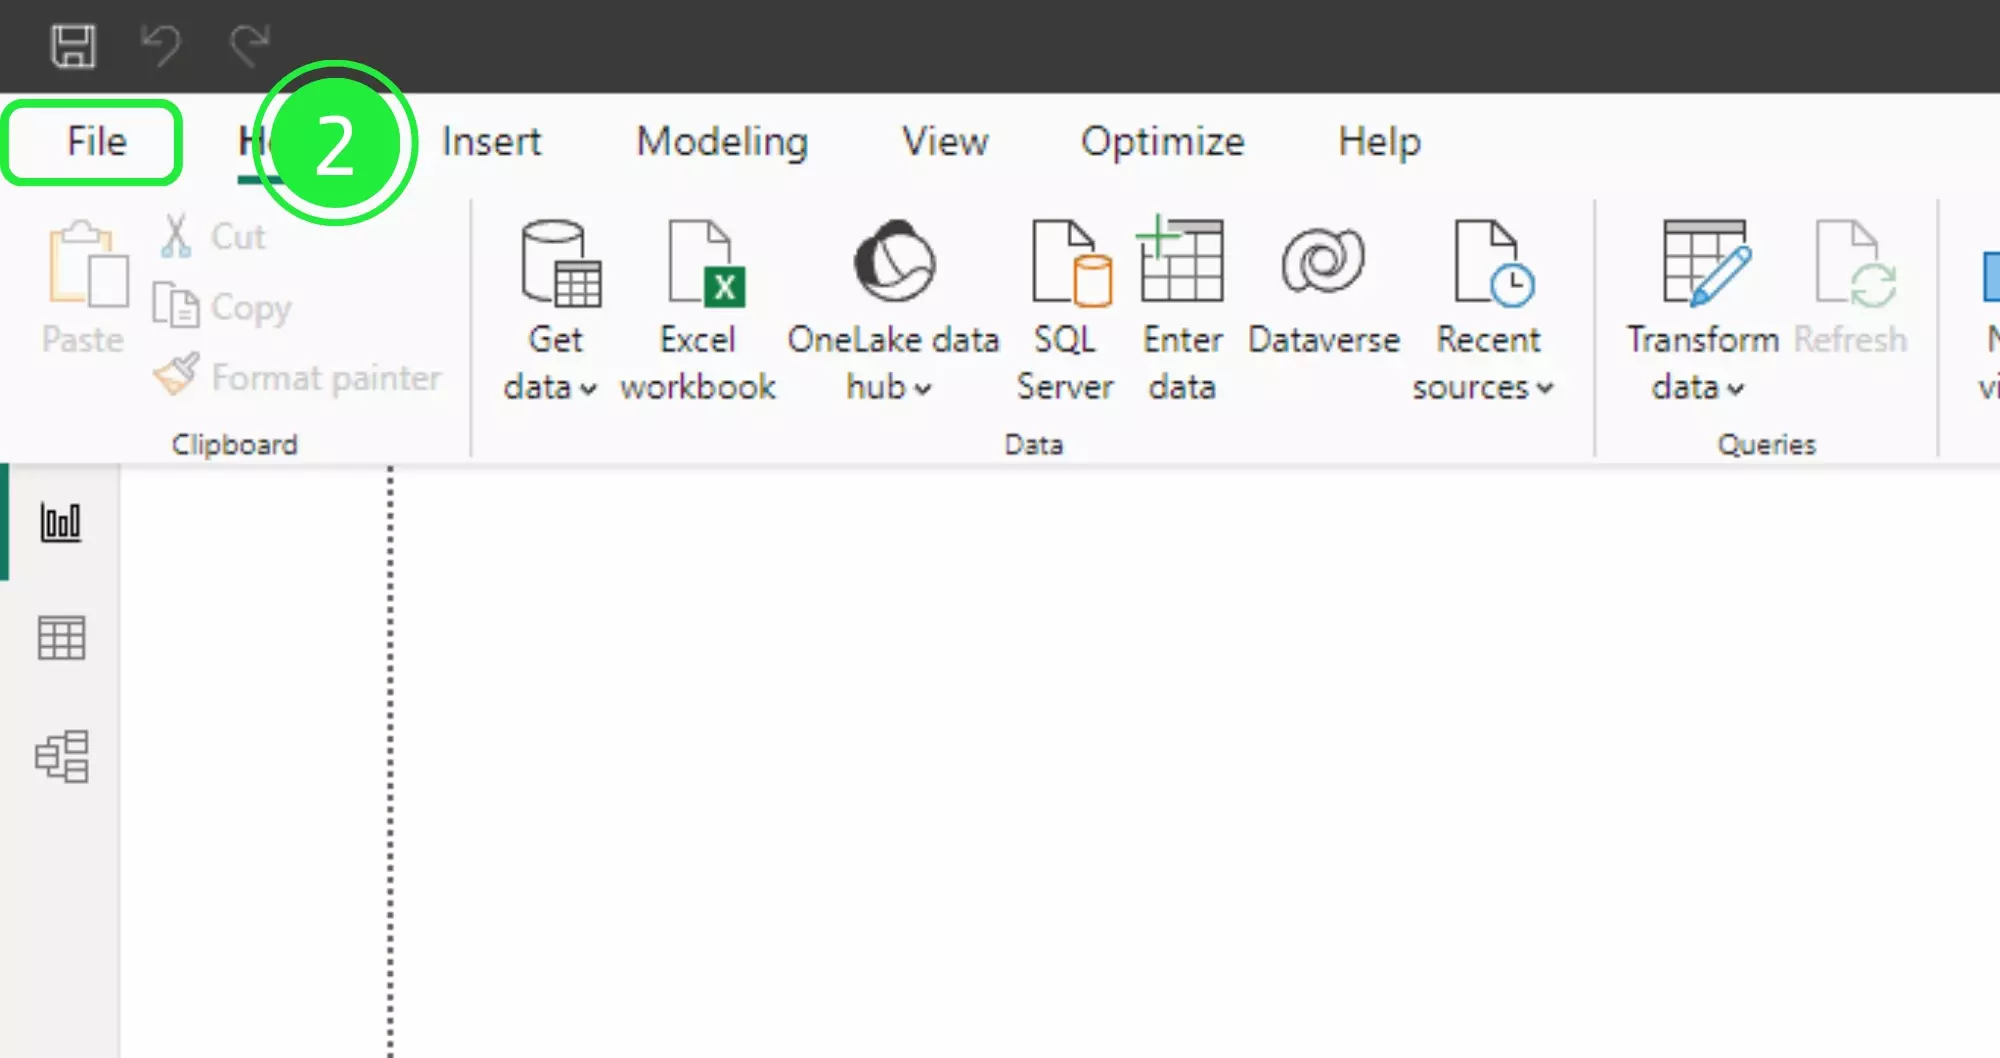
Continue by navigating to the ‘File’ menu. Here, you can open existing templates or start new projects. This menu is essential for all Power BI tasks.
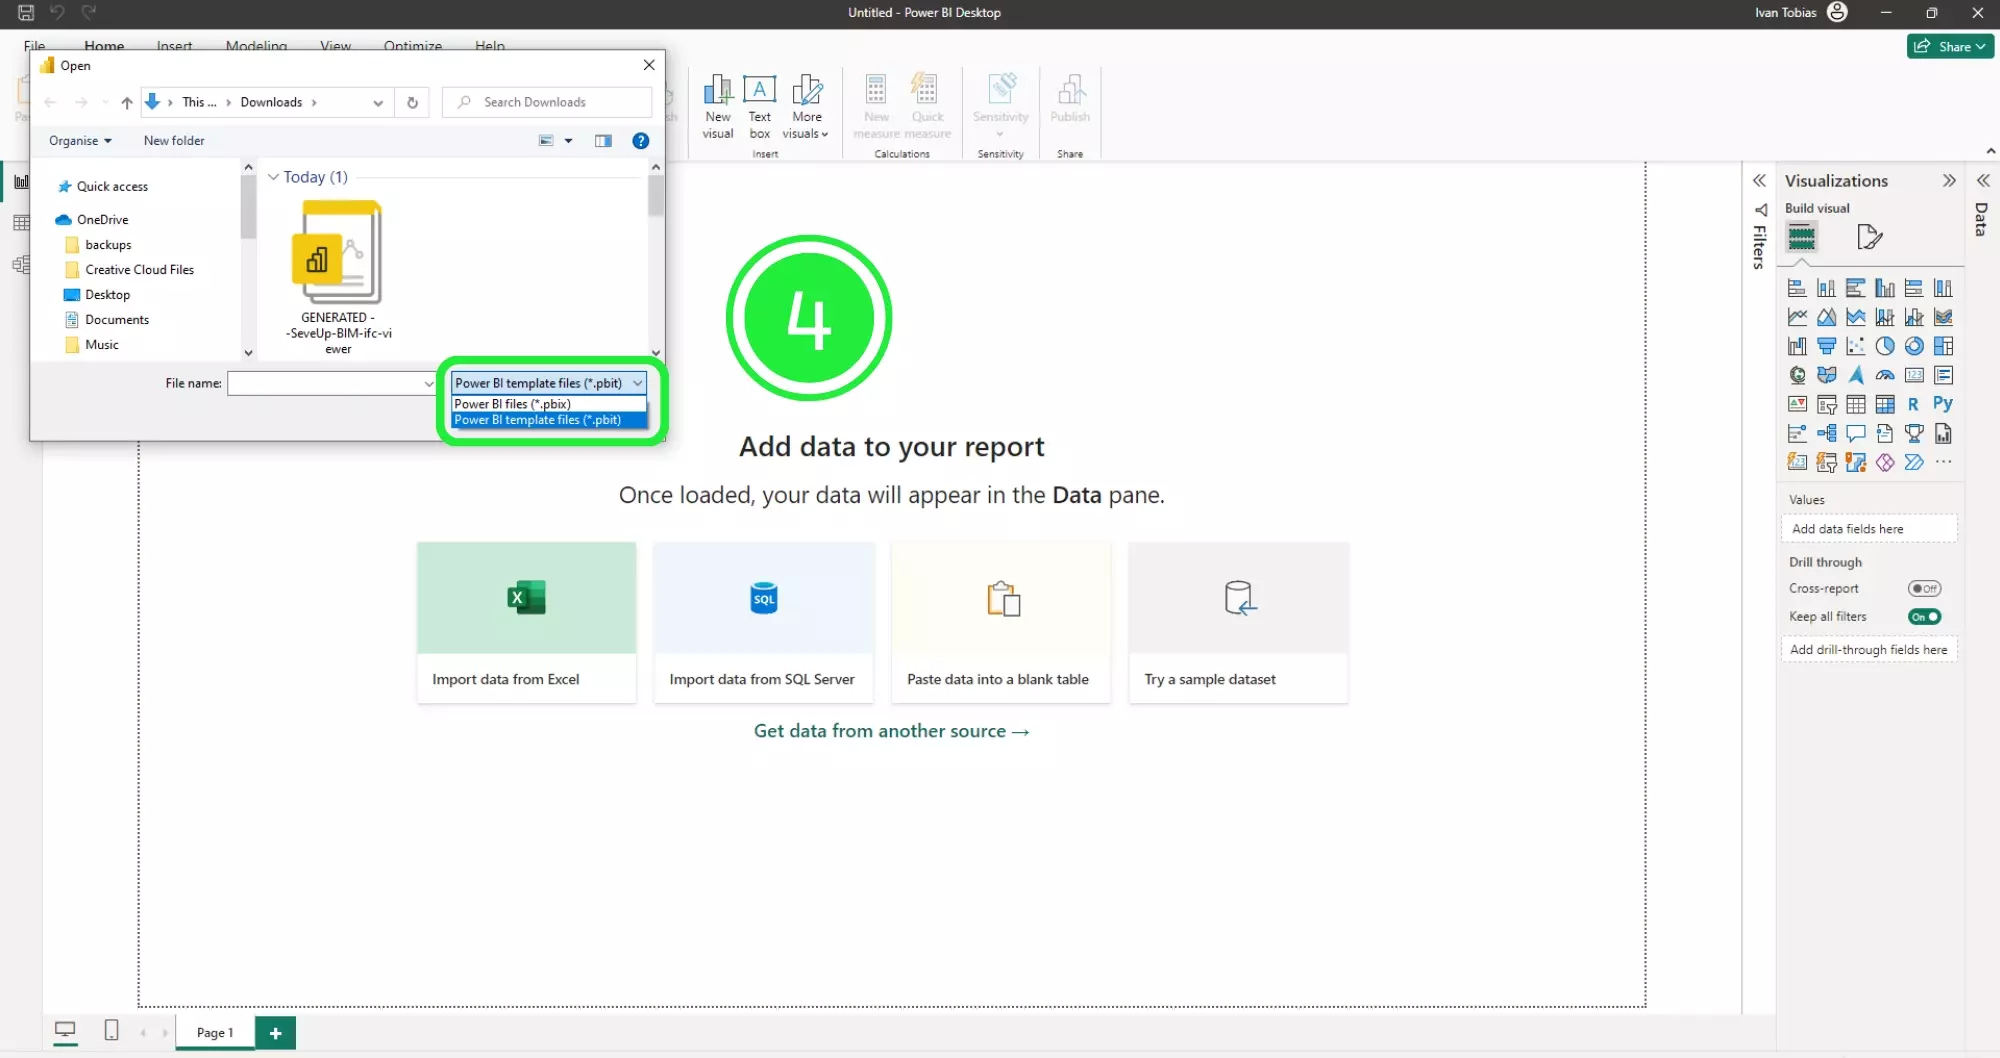
Select ‘Browse this device’ to find your Power BI dashboard template. This step lets you control which reports to upload.

Ensure your template is in the ‘.pbit’ format. This format is necessary for compatibility within the Power BI environment.
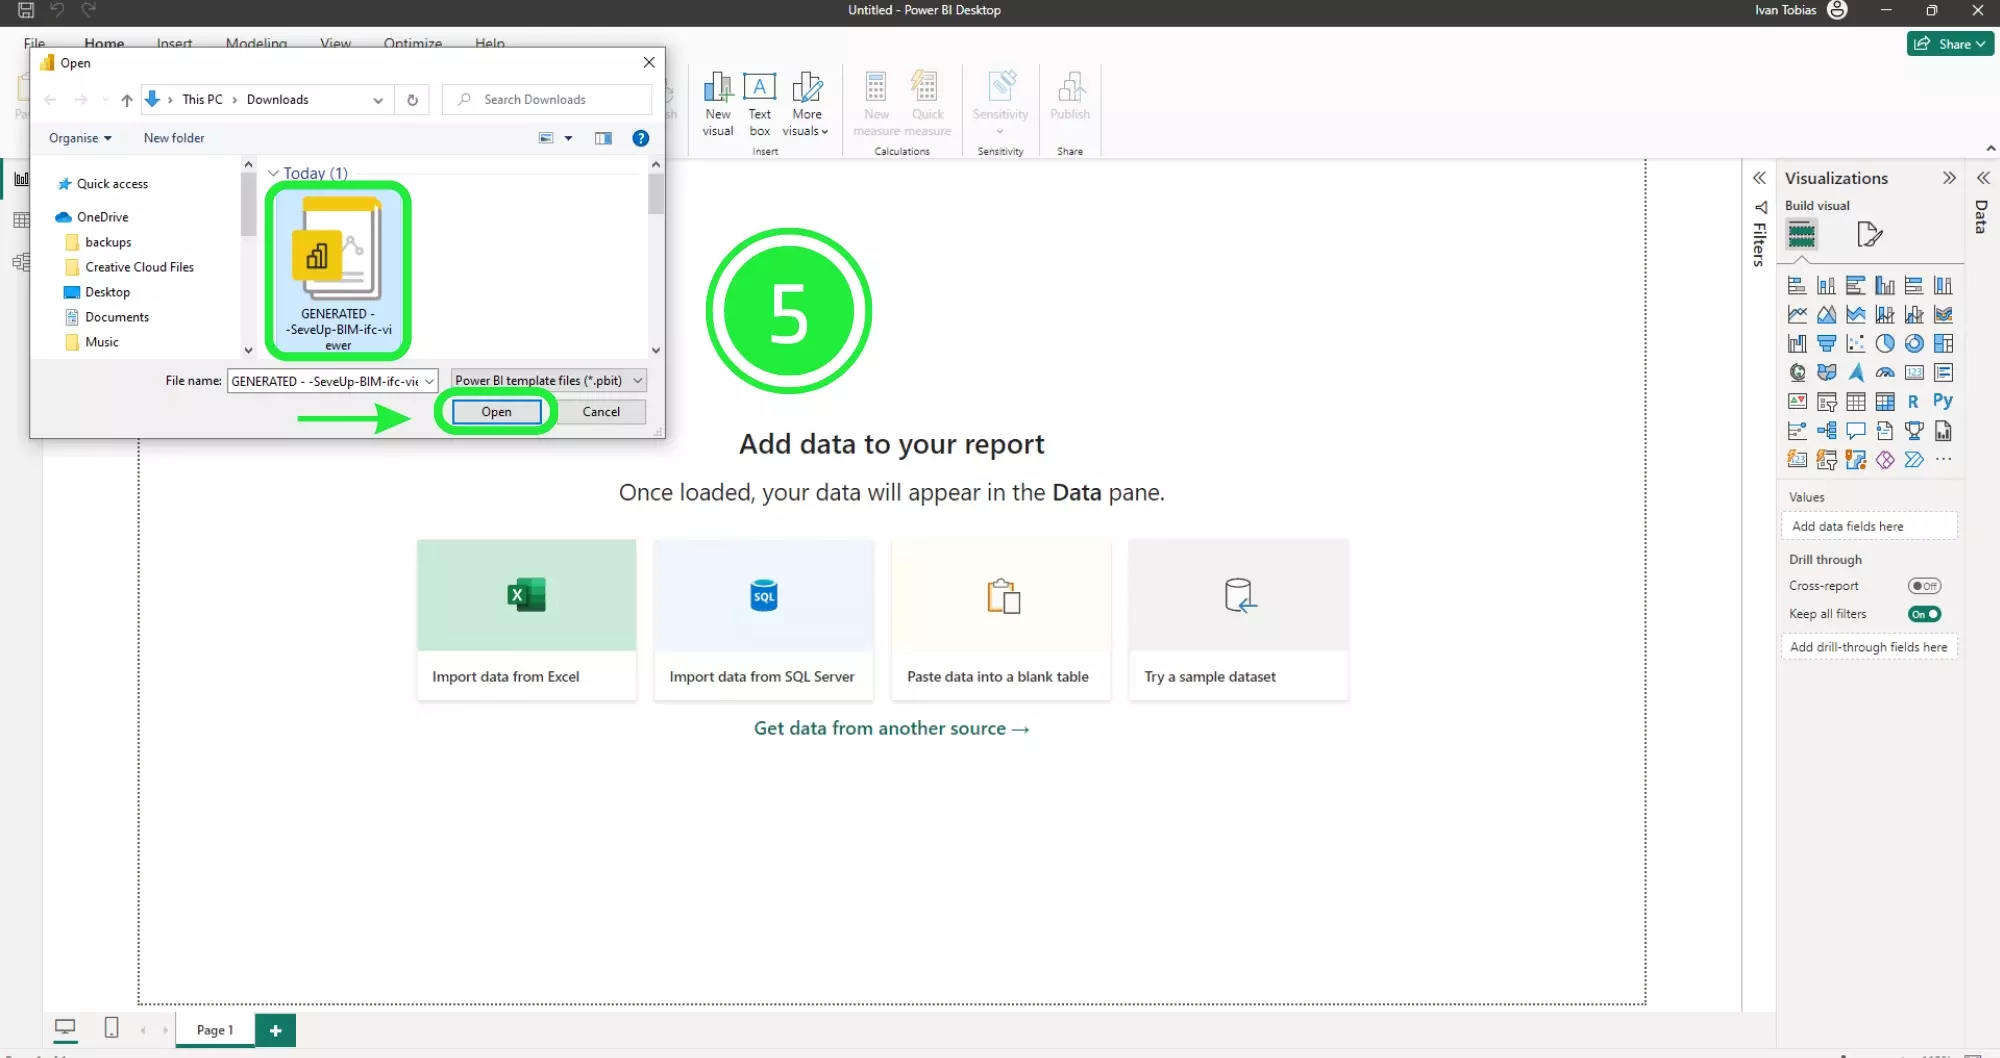
After selecting the right template, click ‘Open’. This action imports your report into Power BI Desktop.
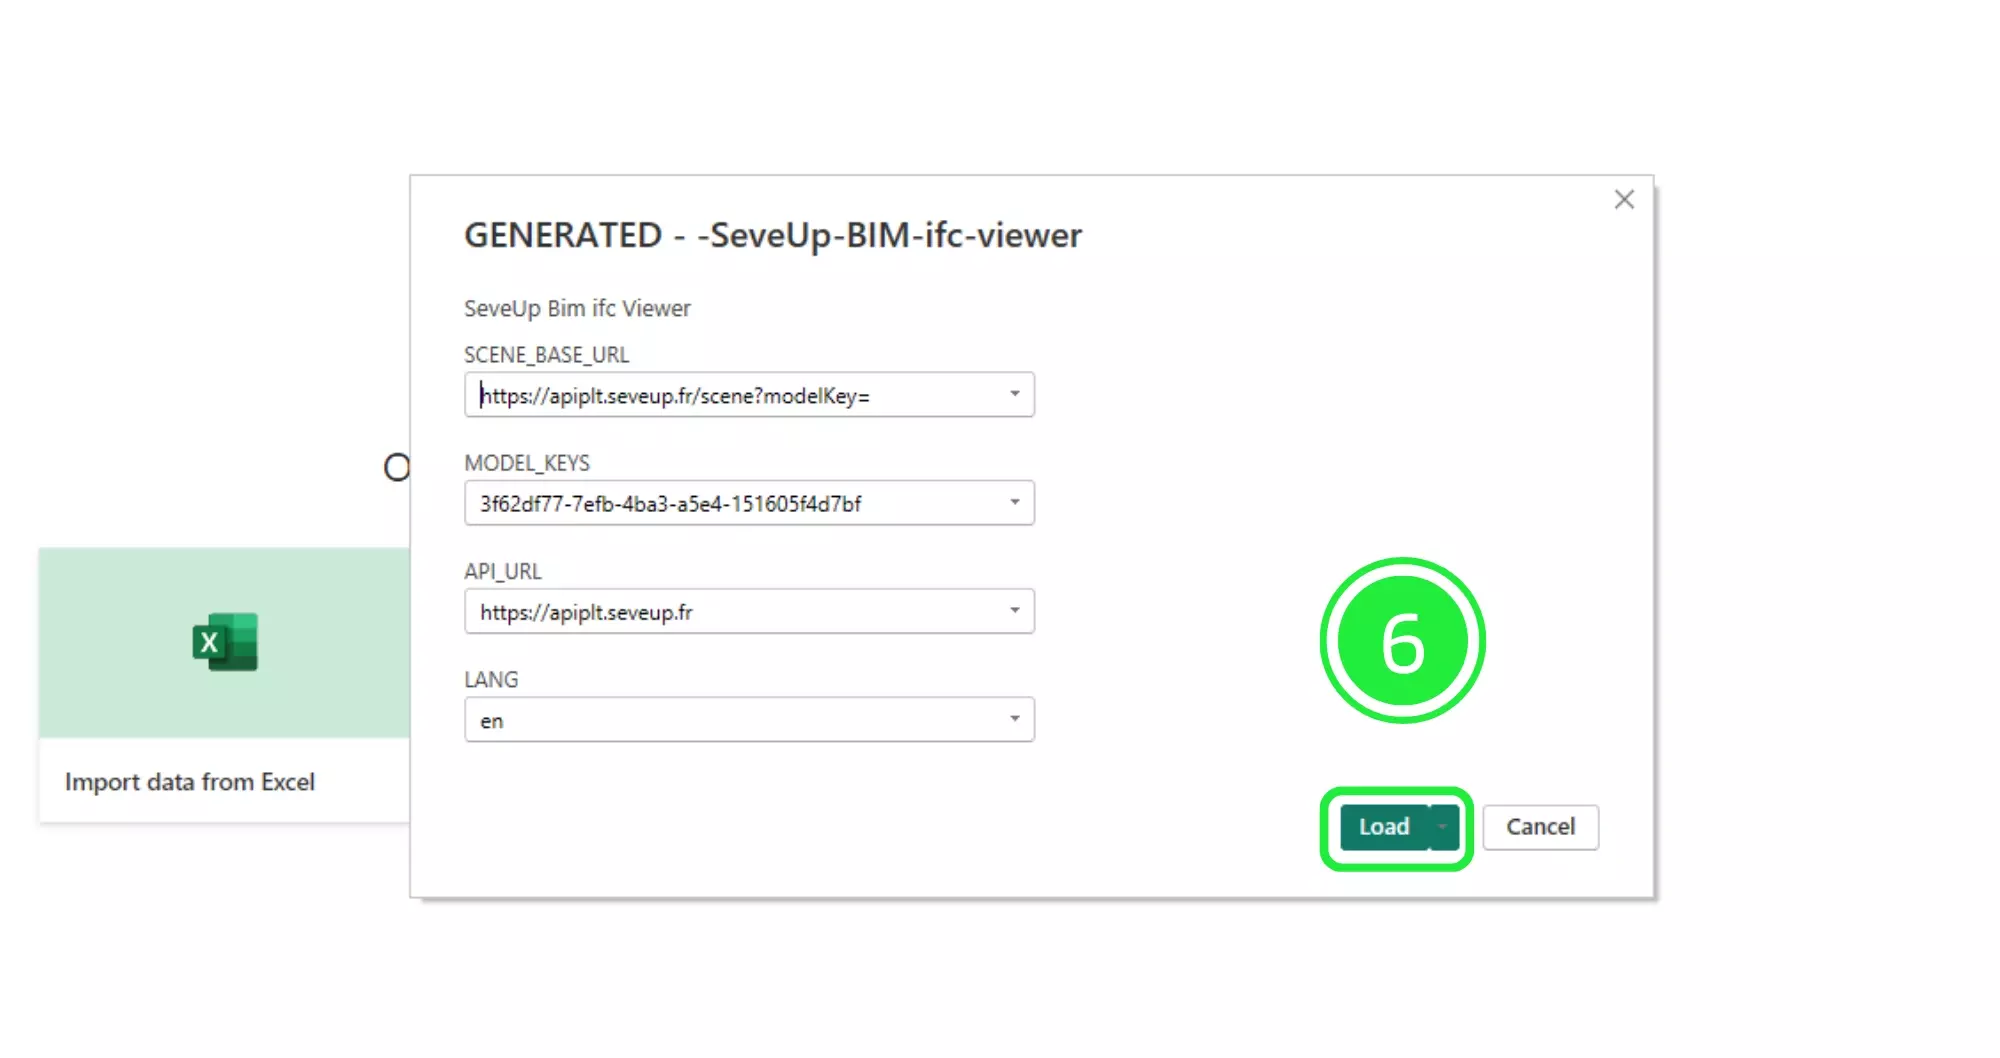
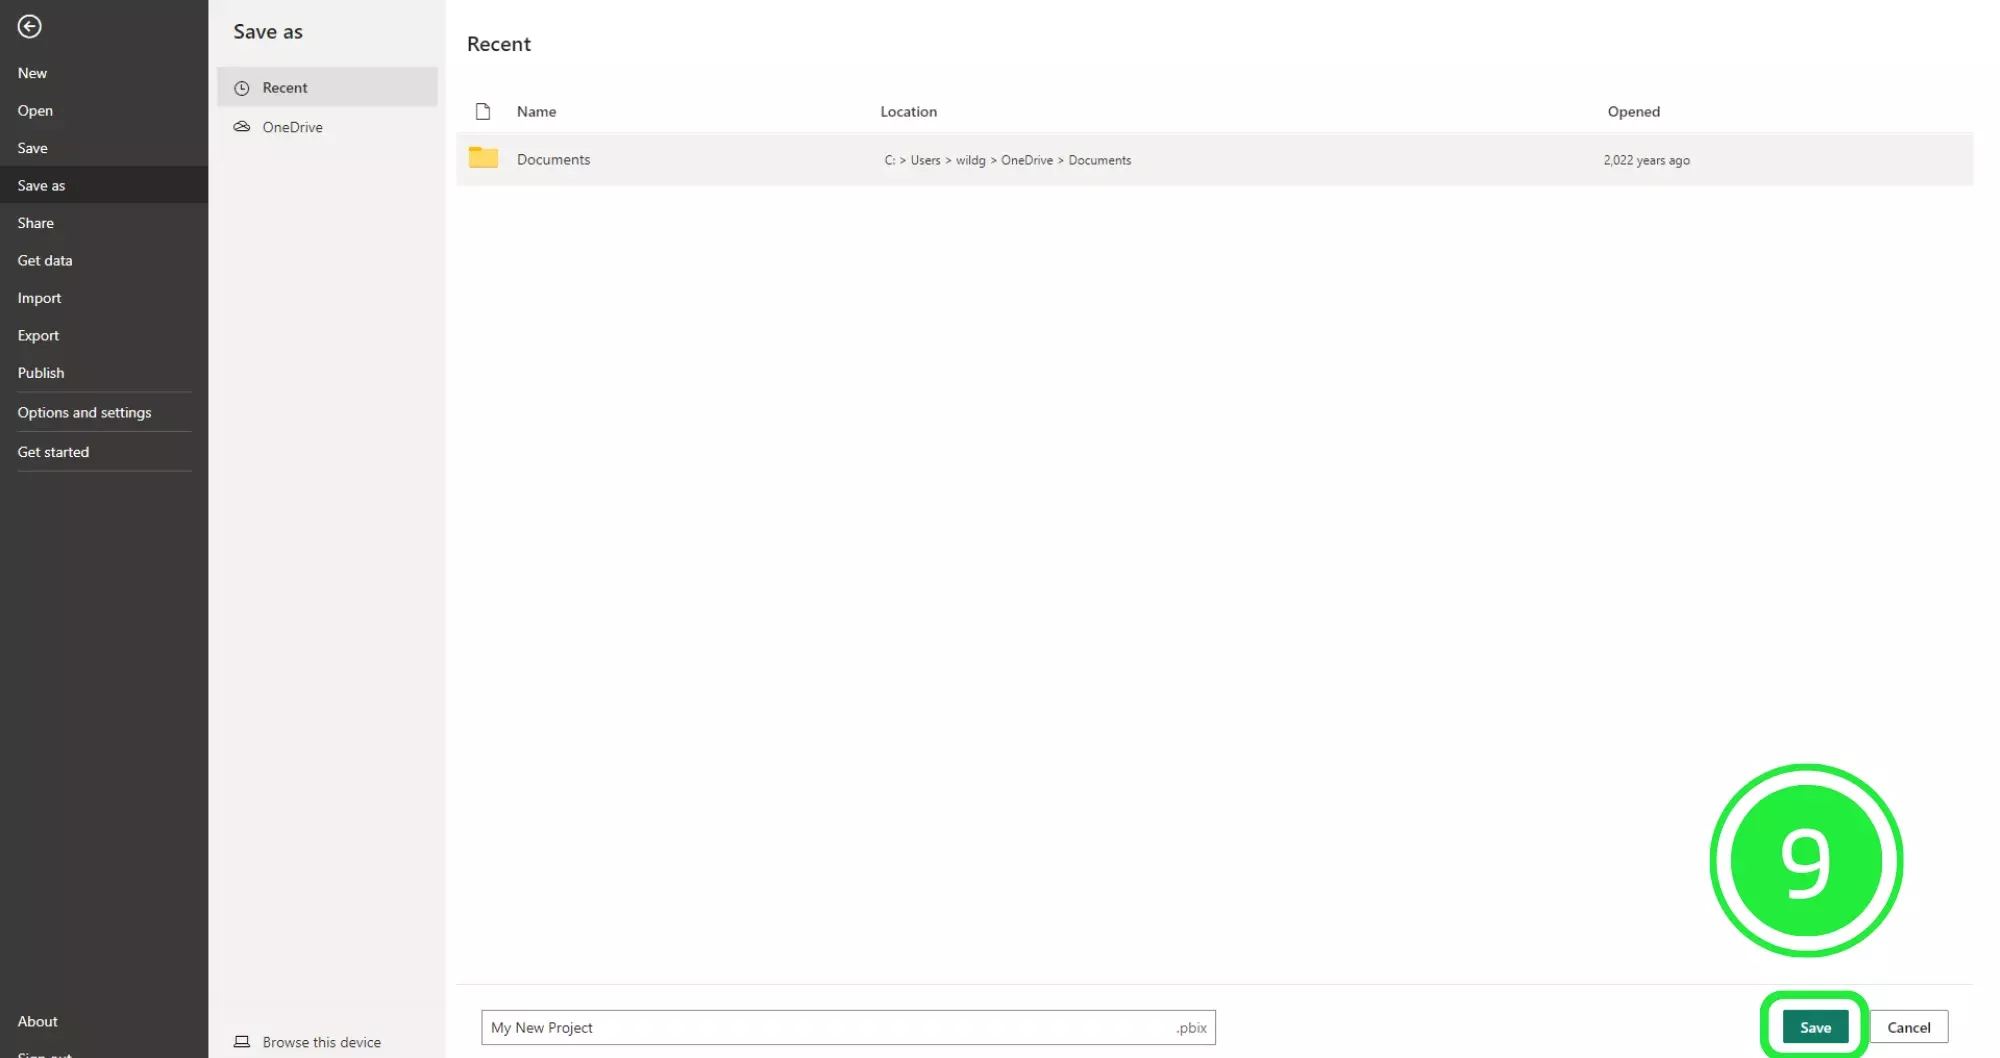
Before publishing, save your file in ‘.pbix’ format. This step ensures correct formatting of your data visualizations. Also, consider integrating a Life Cycle Assessment dashboard in Power BI.

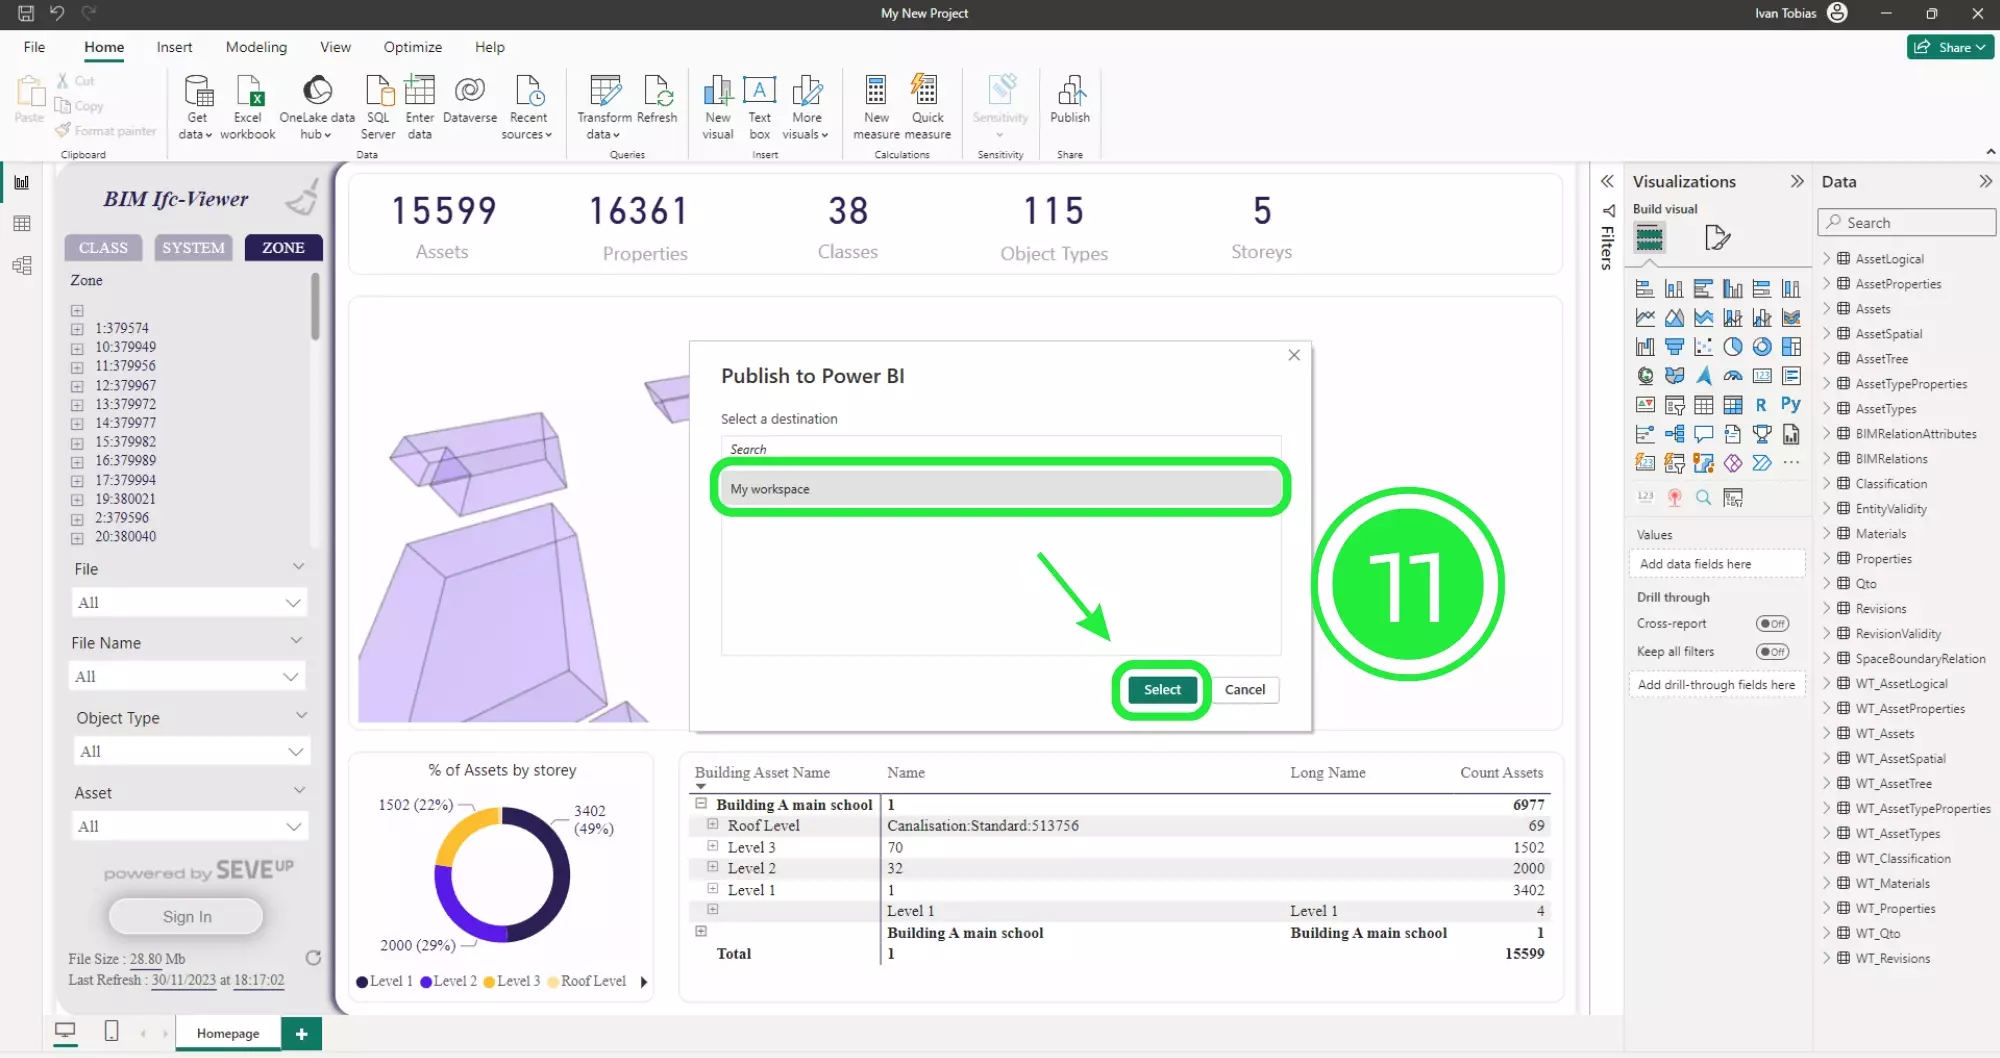
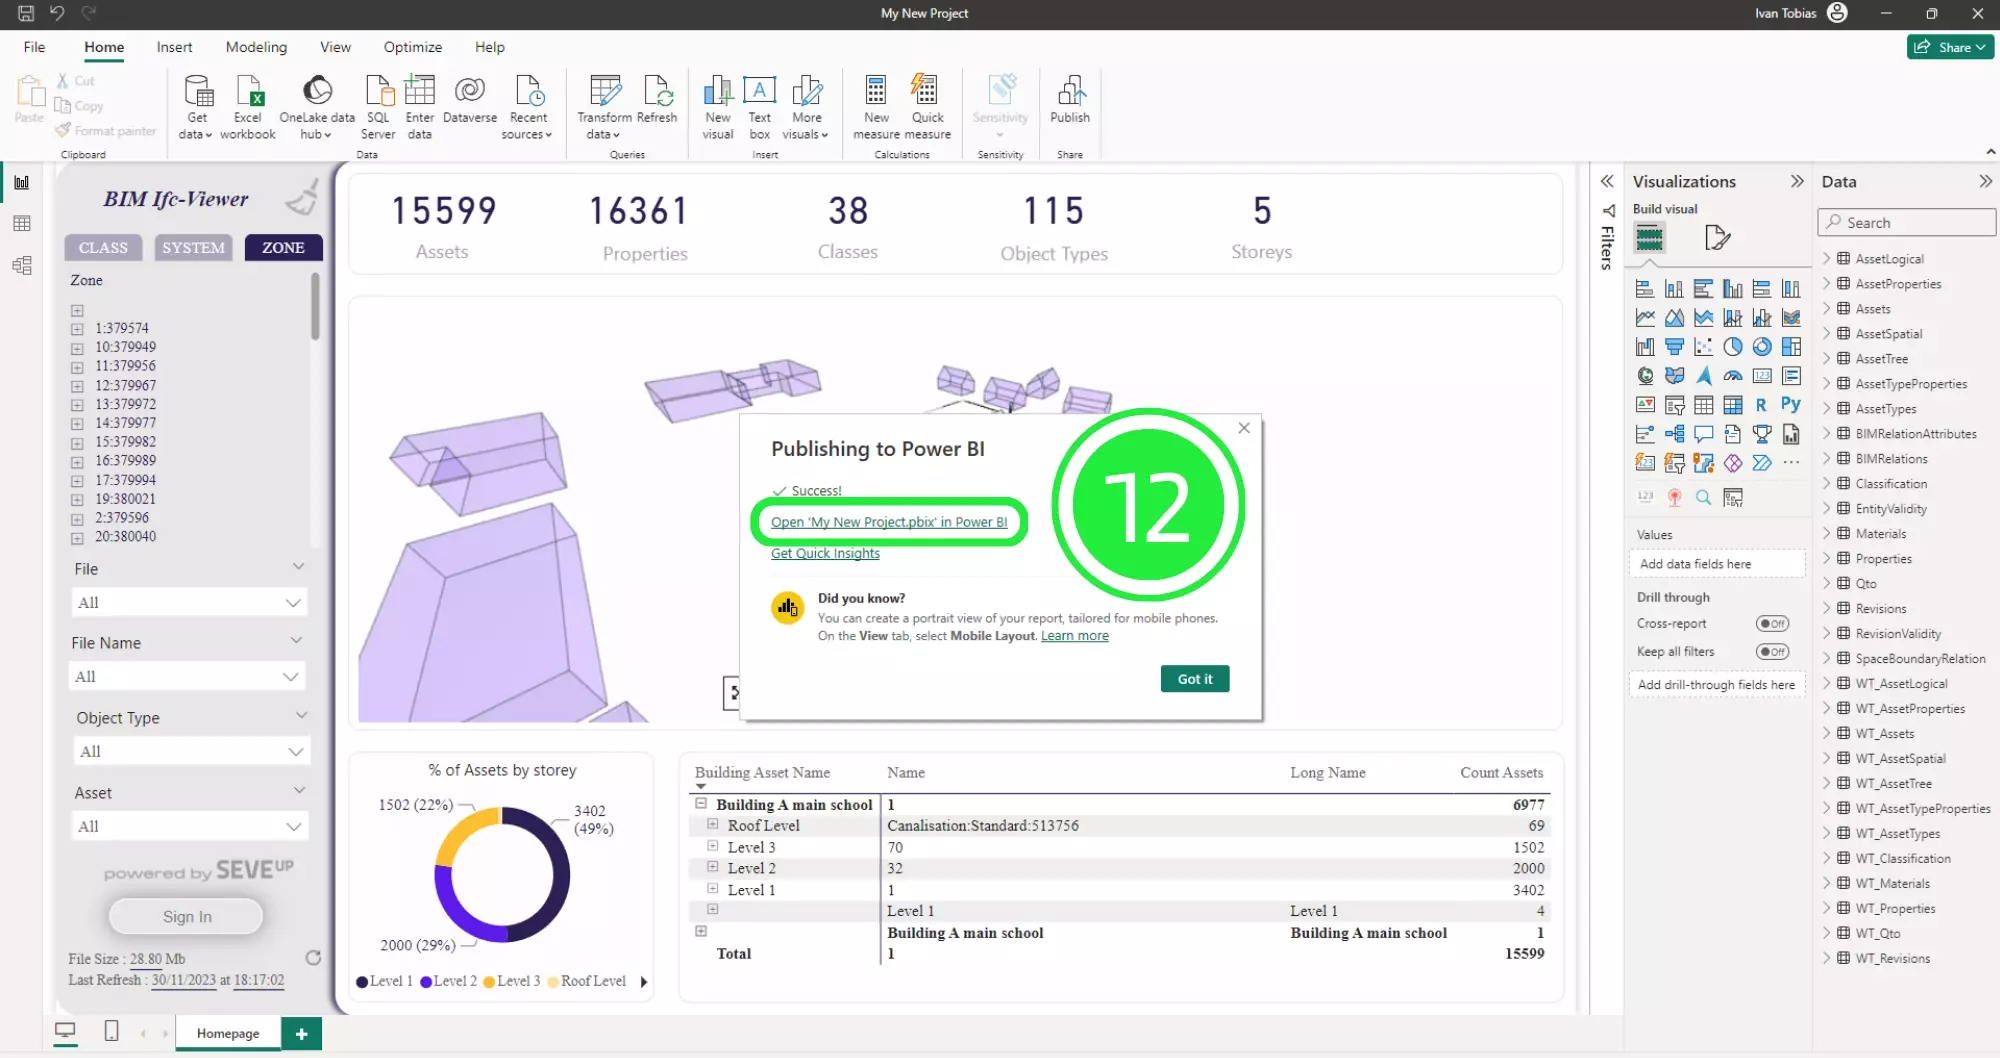
Click ‘Publish’ to upload your report to Power BI Service. This step makes your report accessible to your audience.
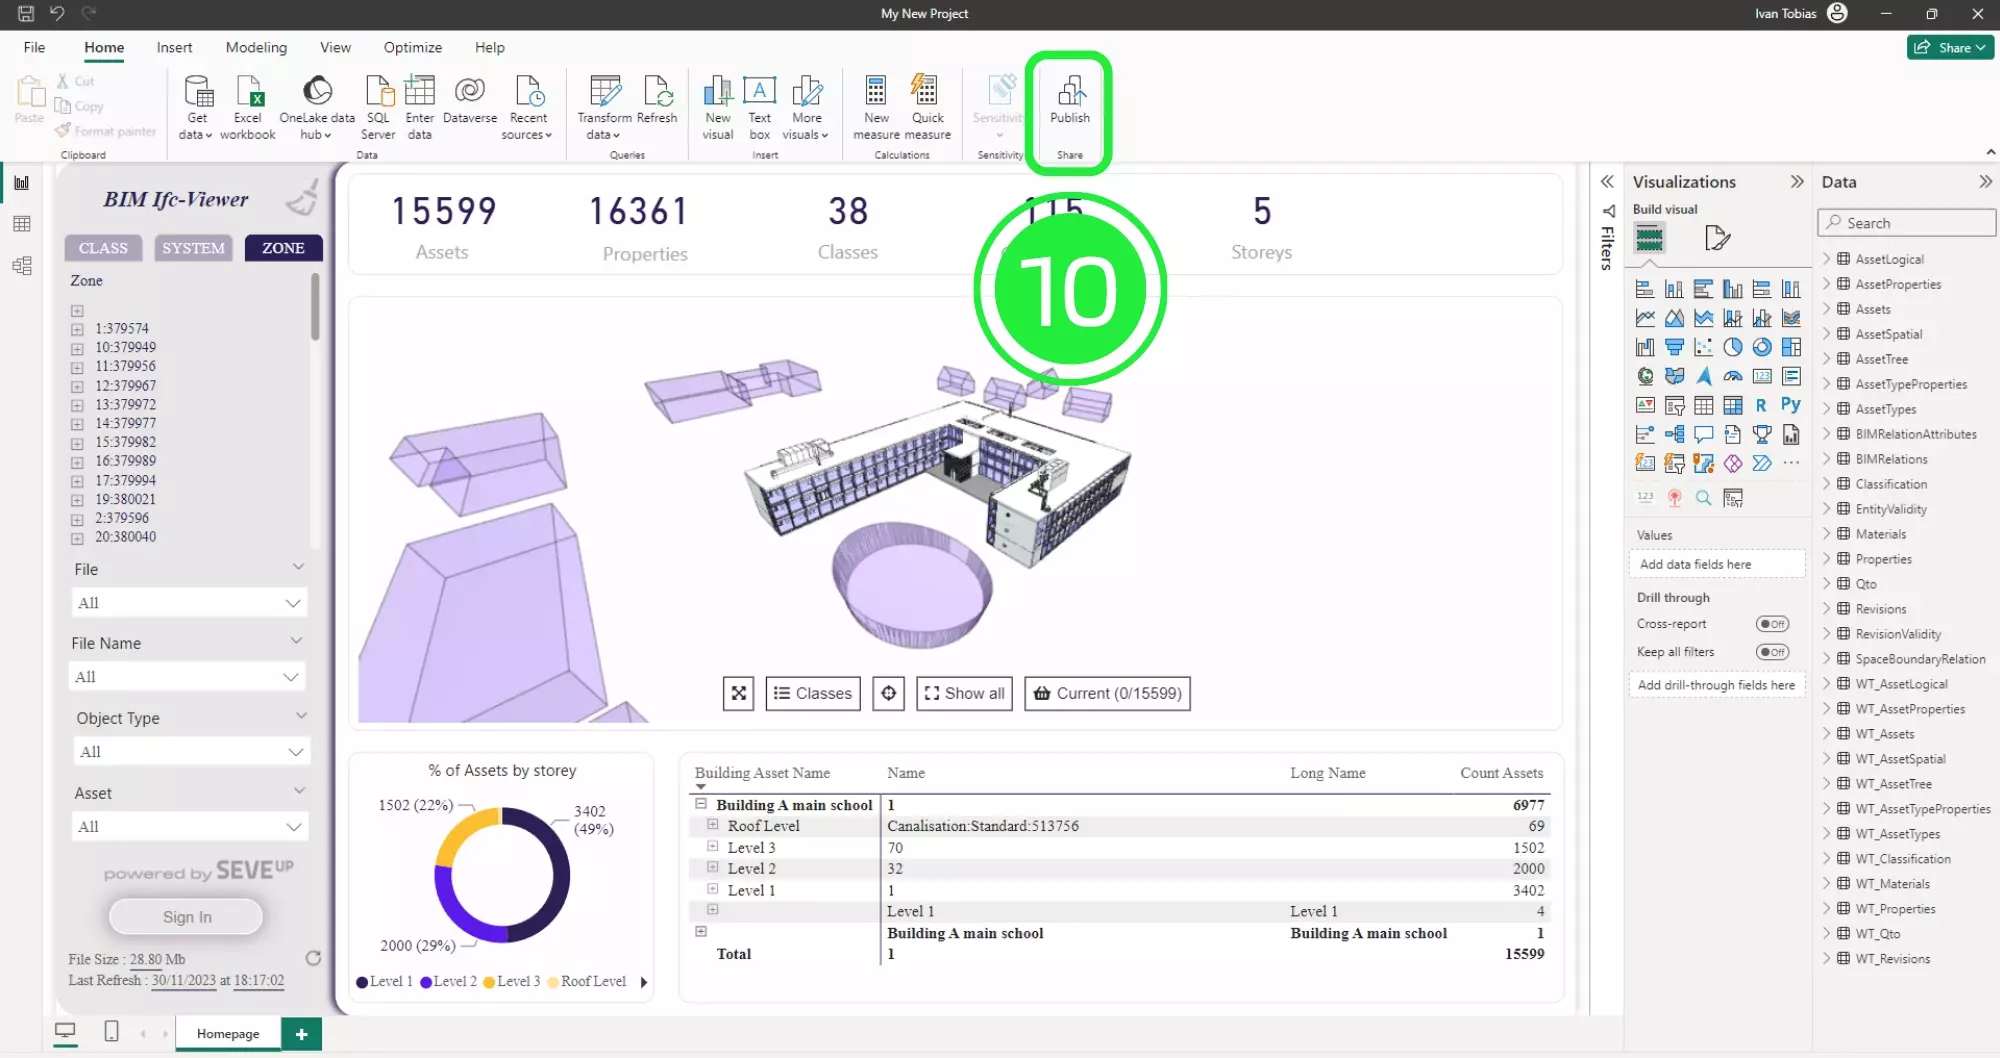
Choose the right workspace in Power BI for organized data management. Workspaces contain reports, dashboards, and datasets.
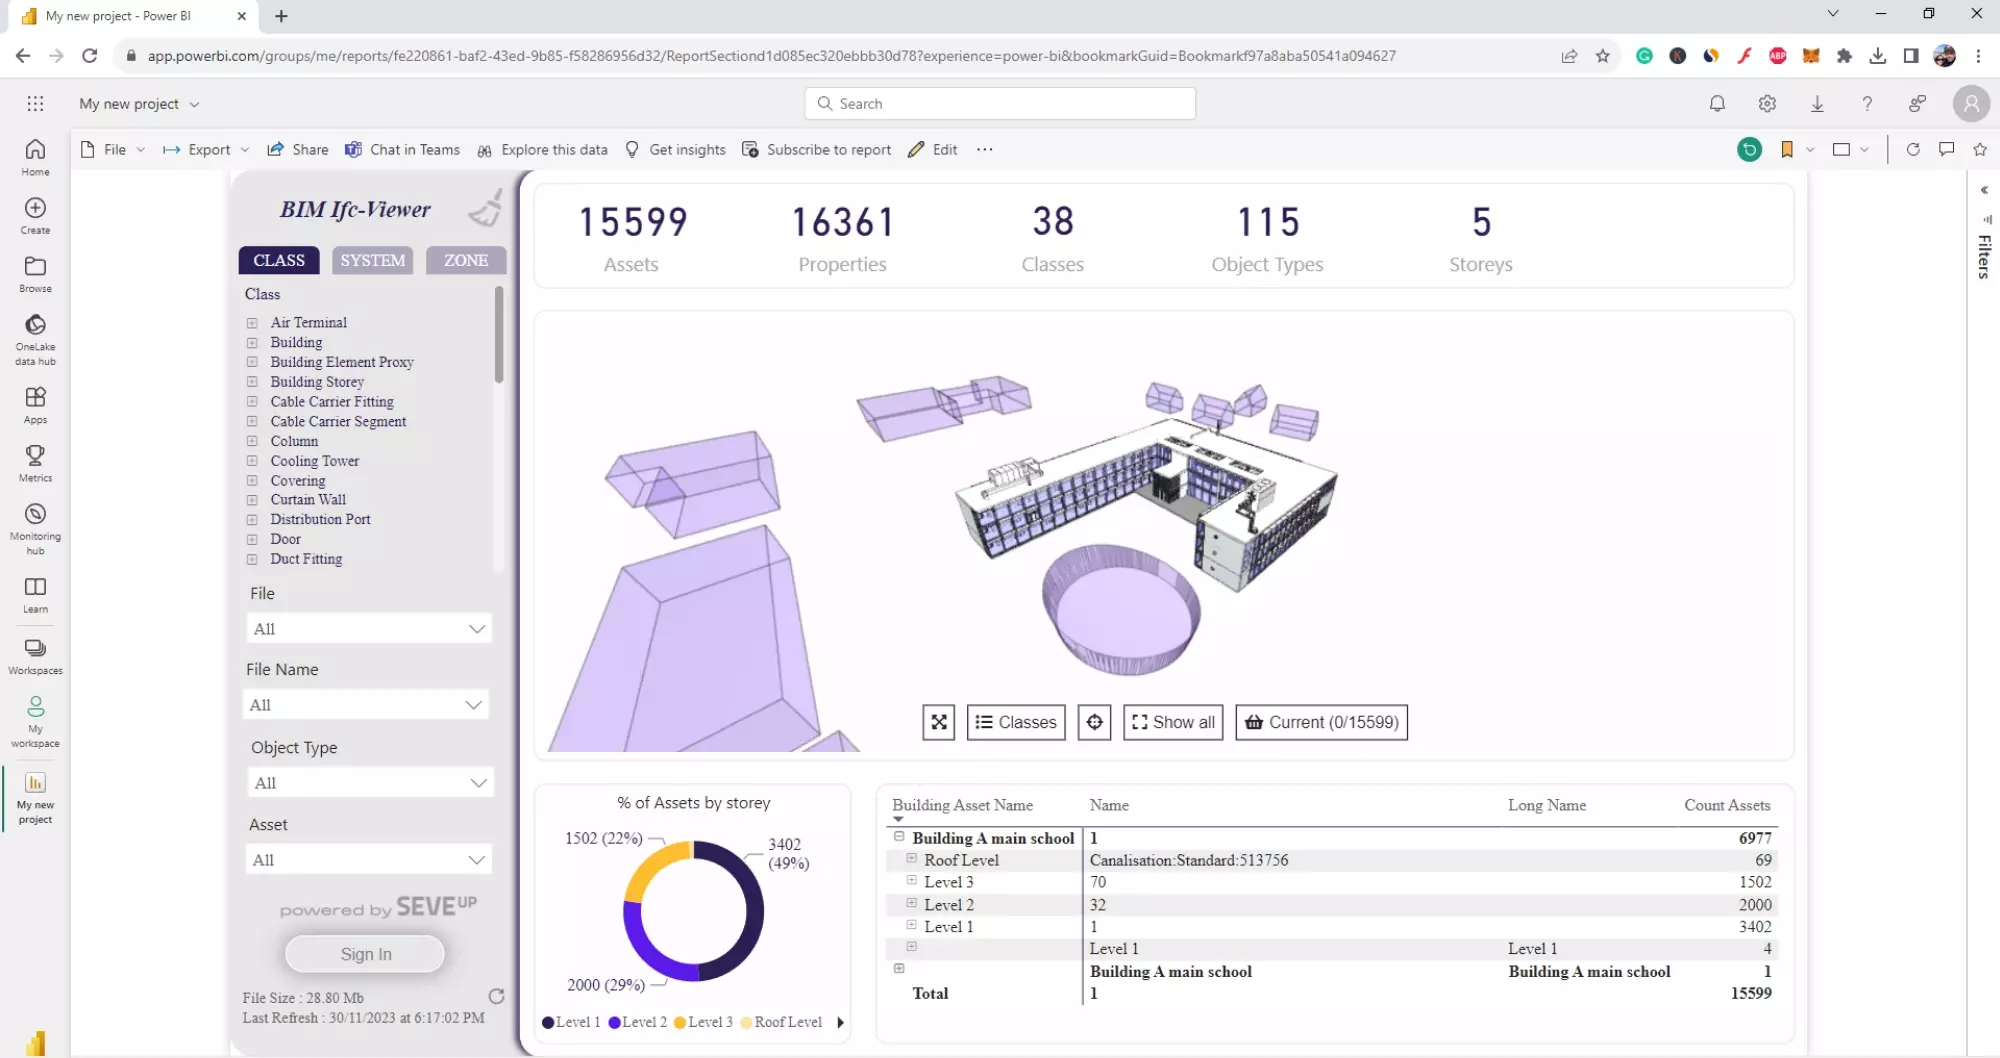
Access your report in Power BI Service after publishing. This step marks the transition to a live, interactive document.
Power BI’s interactive dashboards are changing stakeholder engagement in BIM projects. They turn static data into dynamic visualizations. This feature enables users to explore data and gain actionable insights.
Embark on your BIM project management journey with SeveUp. Discover the seamless integration with Power BI. SeveUp complements Power BI’s capabilities, providing a comprehensive toolset for effective BIM management.

The article discusses the evolving world of data analysis in 2024, focusing on three major tools: Power BI, Tableau, and Excel. It explores the strengths and weaknesses of each platform to help professionals make informed decisions based on their analytical needs. The article highlights Excel’s longstanding reliability for basic data analysis tasks, Power BI’s advanced analytics and business intelligence capabilities, and Tableau’s strengths in visual analytics and data storytelling.


Want to get started with your very own BIM project? You’ll be surprised by just how easy it is. Create your own free account is SeveUp today and give it a try.

Unlock the power of your building data with SeveUp. Tailored dashboards, seamless integration
🎓 Free BIM Checker Training Learn how to automate your BIM model checks and get certified. Register for Free Click
Learn More🎓 Free BIM Checker Training Learn how to automate your BIM model checks and get certified. Register for Free Click
Learn More🎓 Free BIM Checker Training Learn how to automate your BIM model checks and get certified. Register for Free Choose
Learn More