Optimize Your Data Analysis with QTO Dashboard in Power BI

Trusted by companies
all over the world:

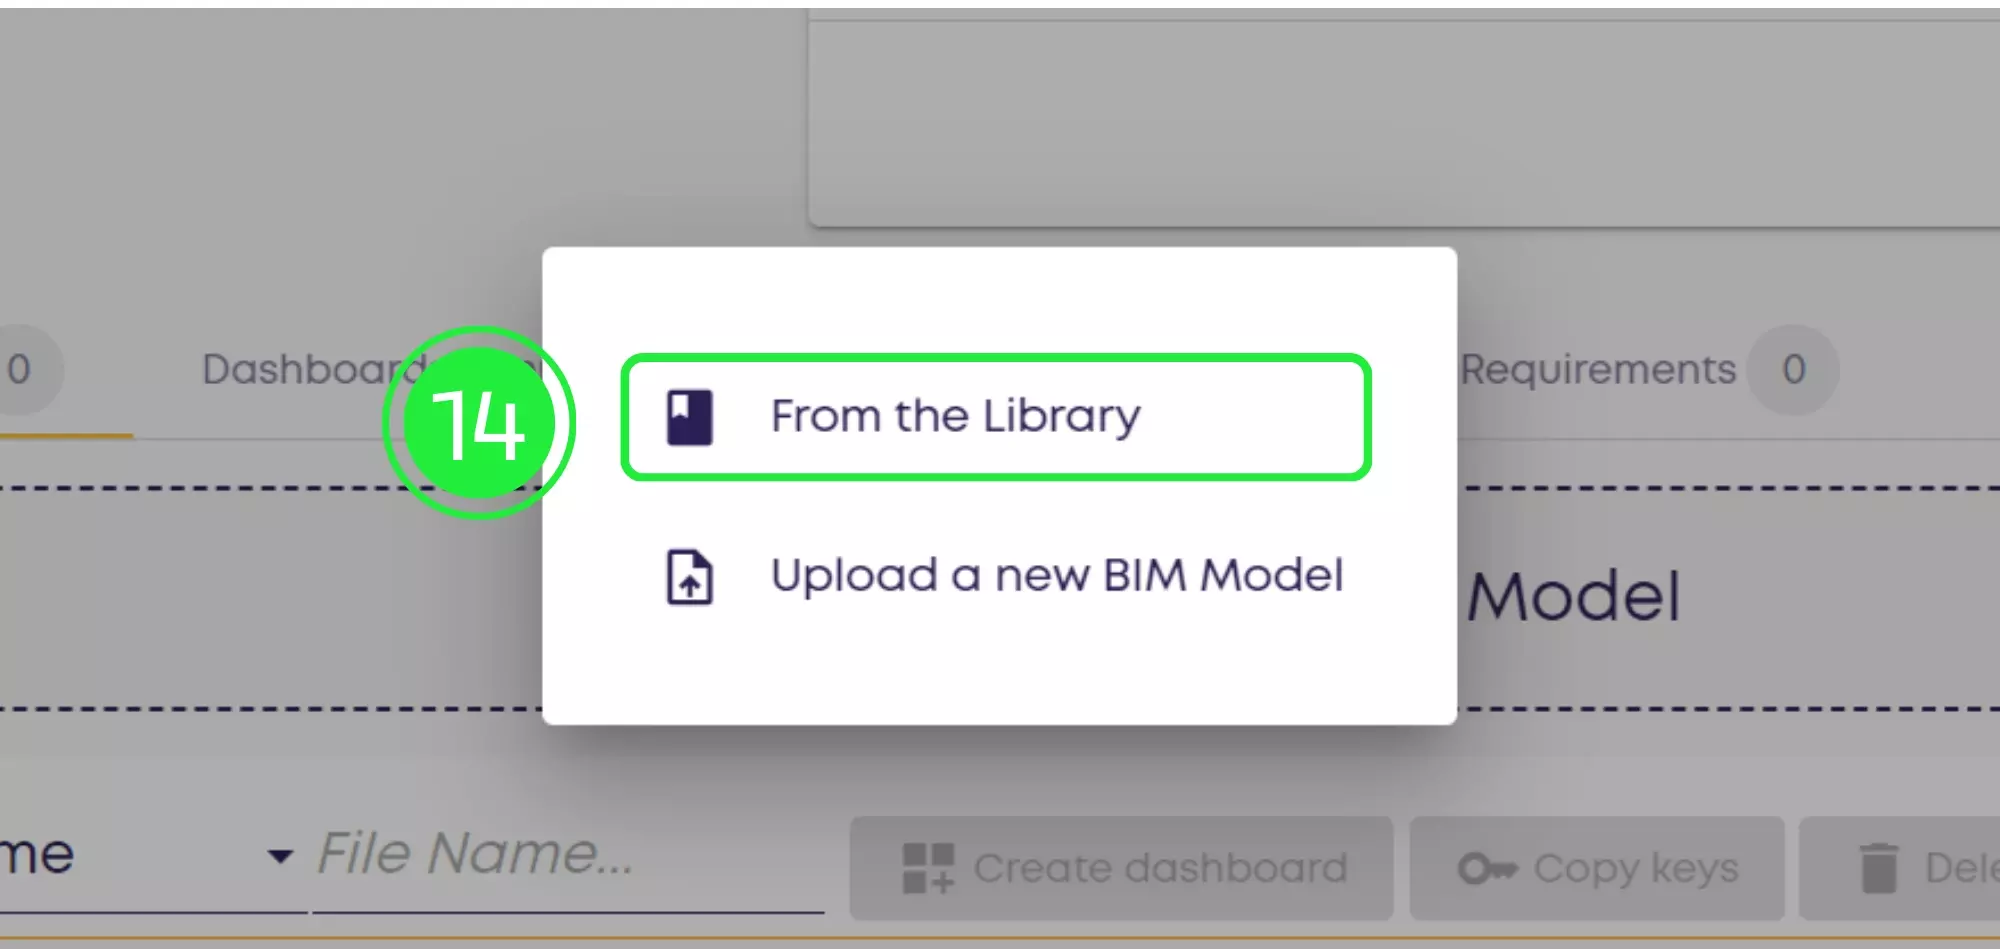
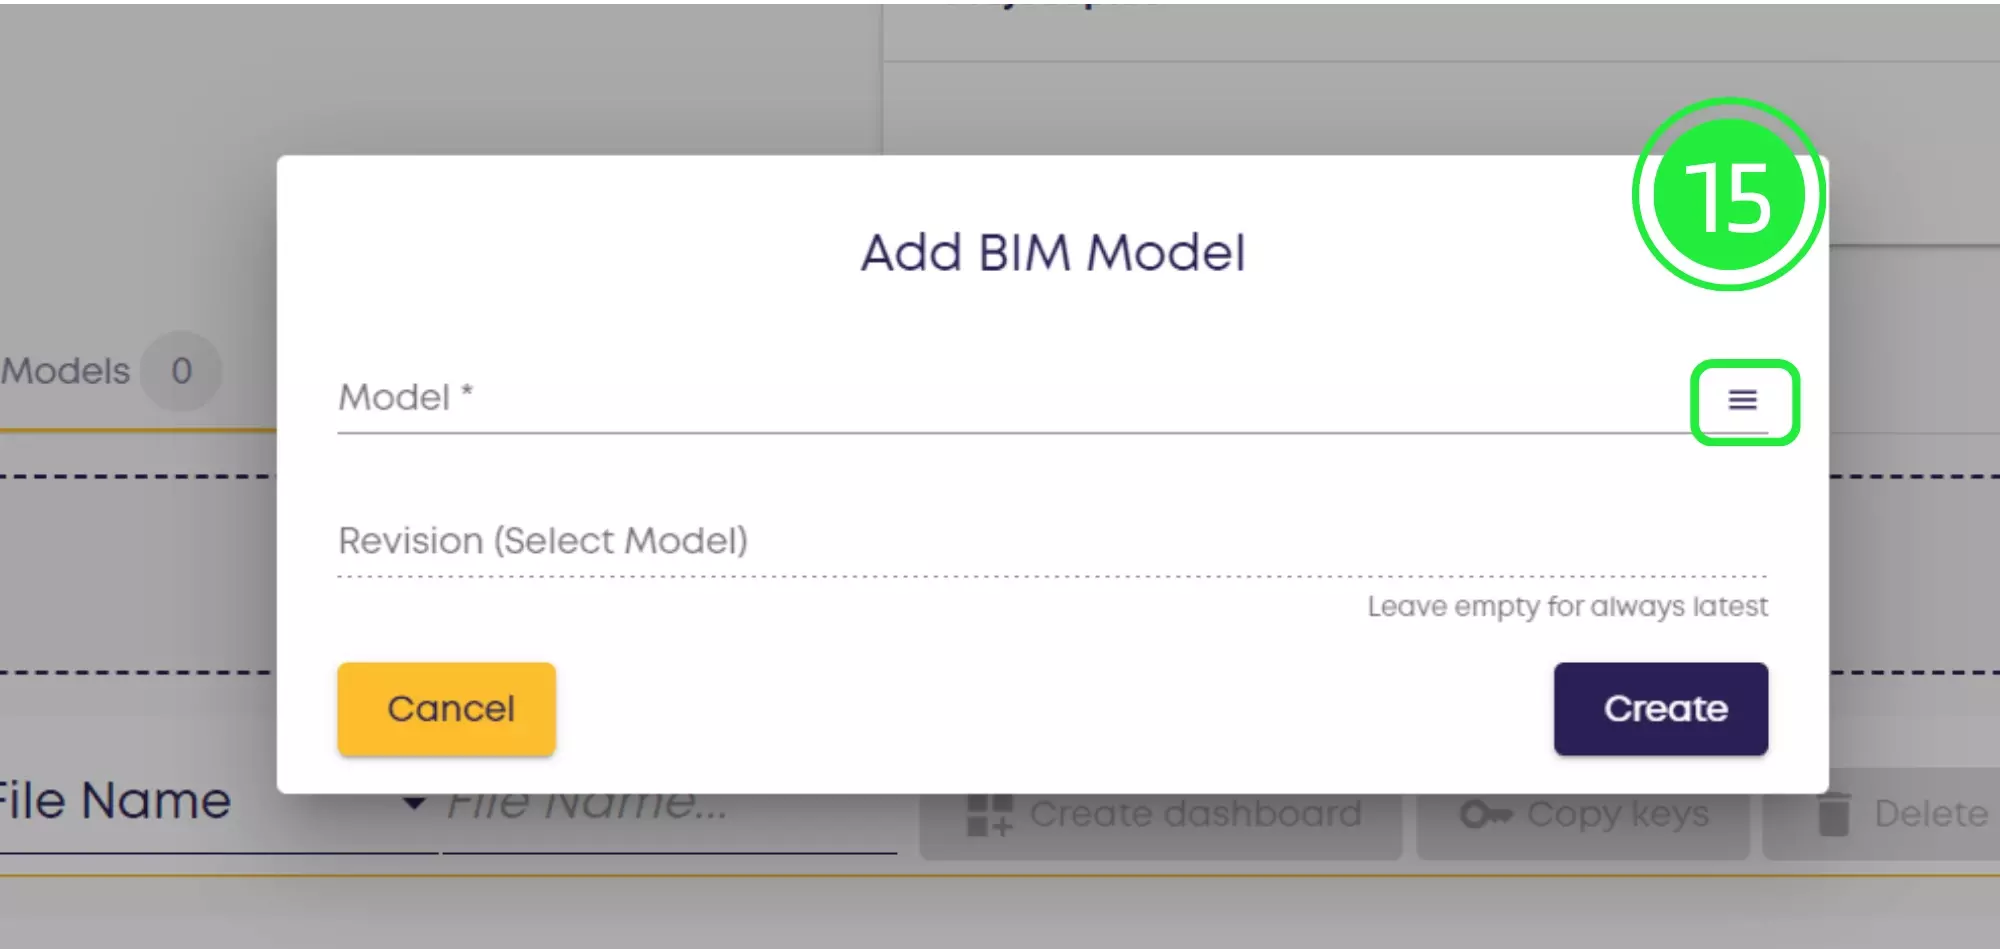
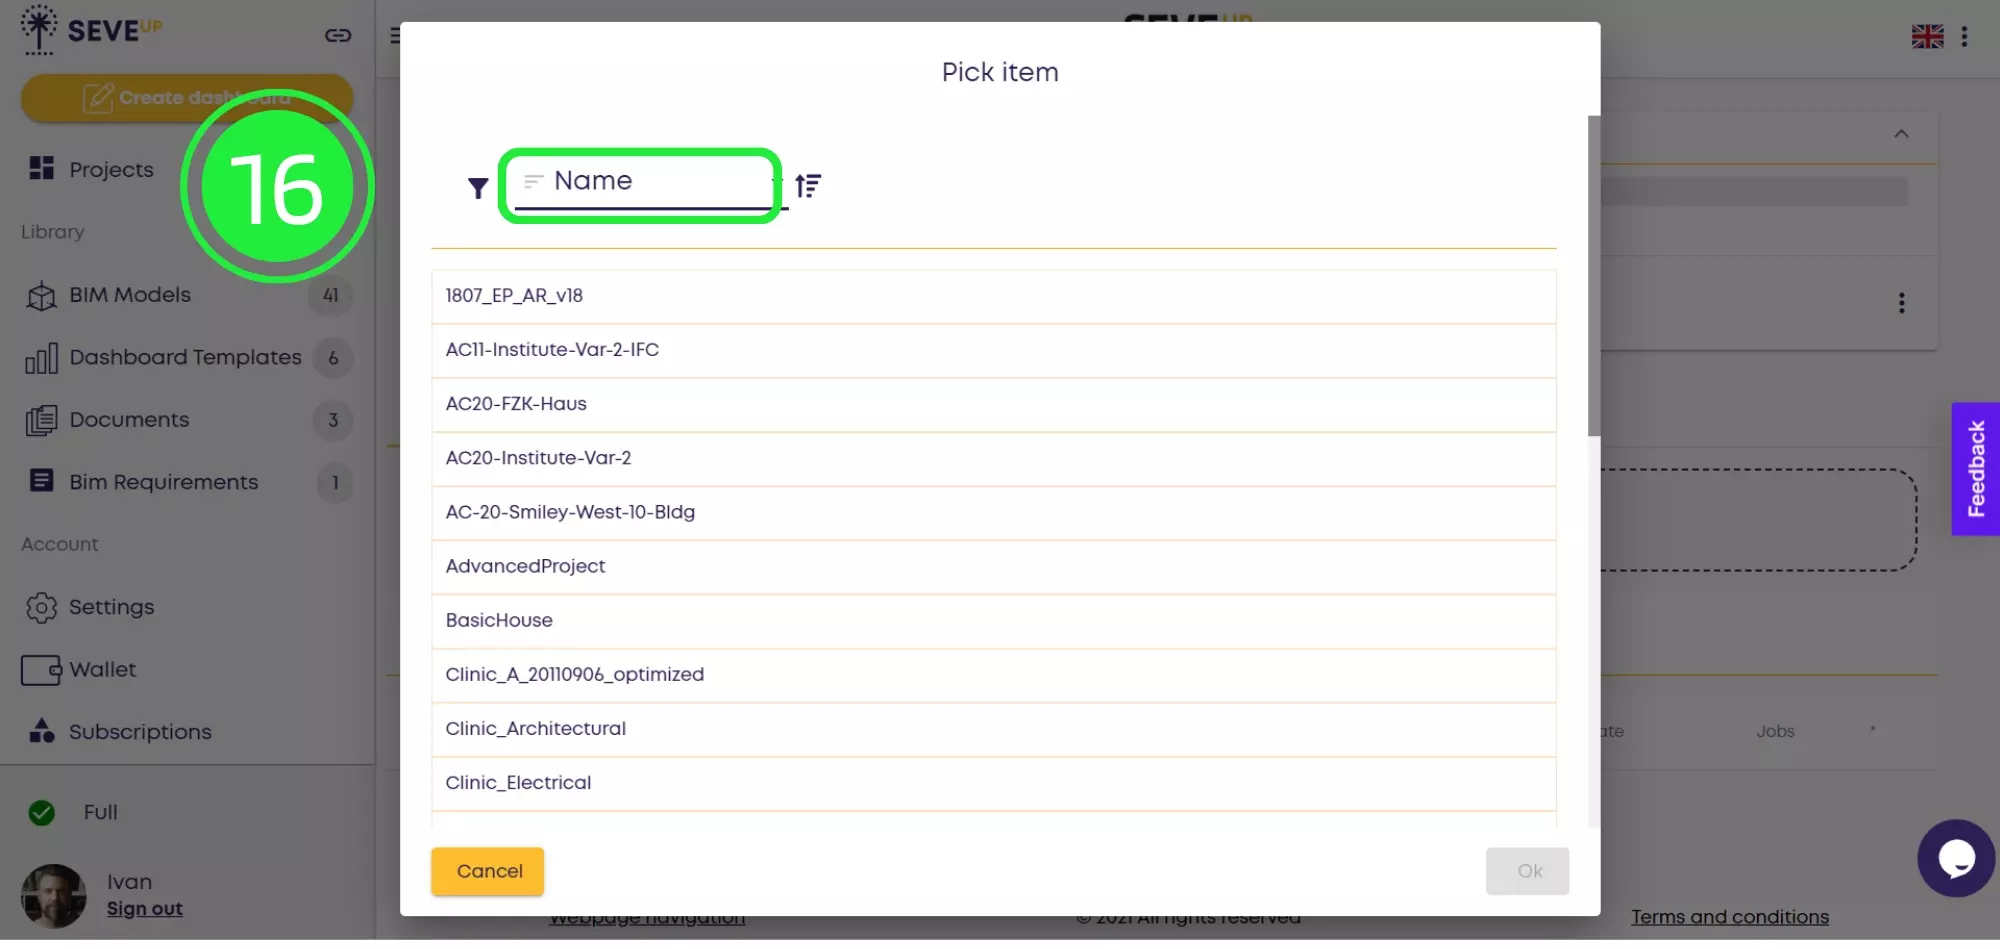
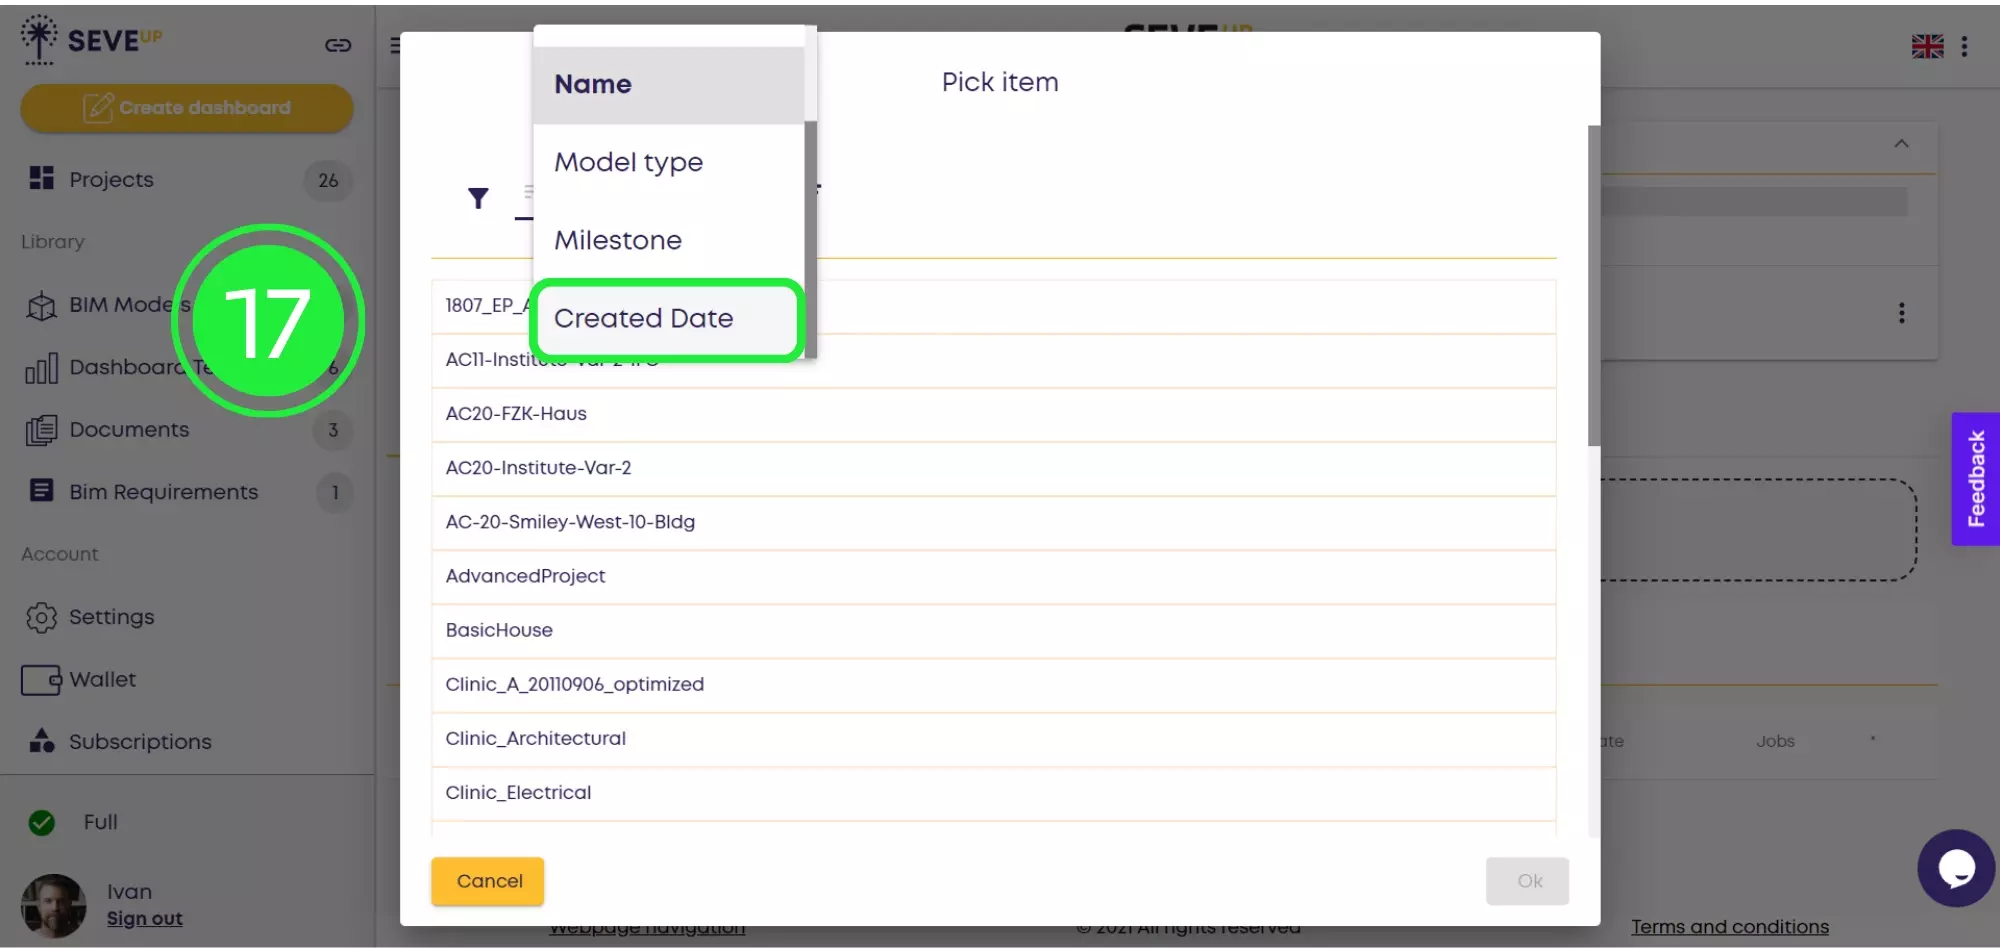
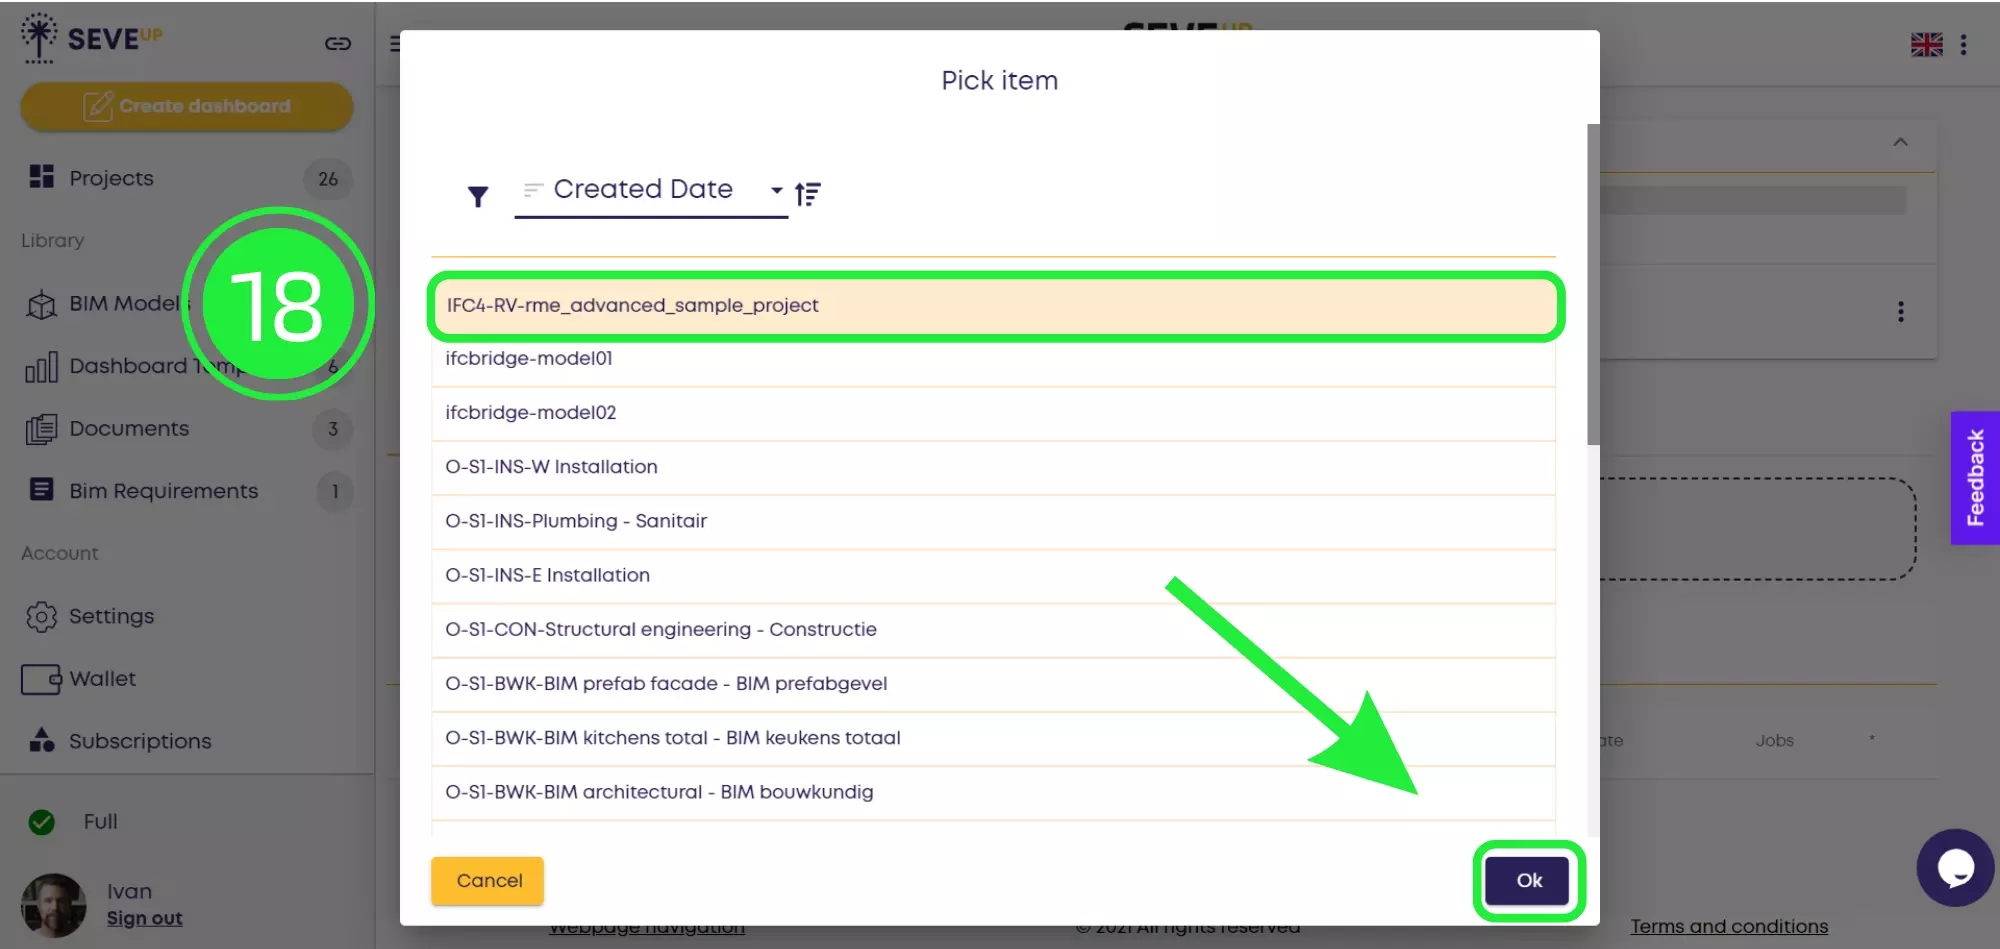
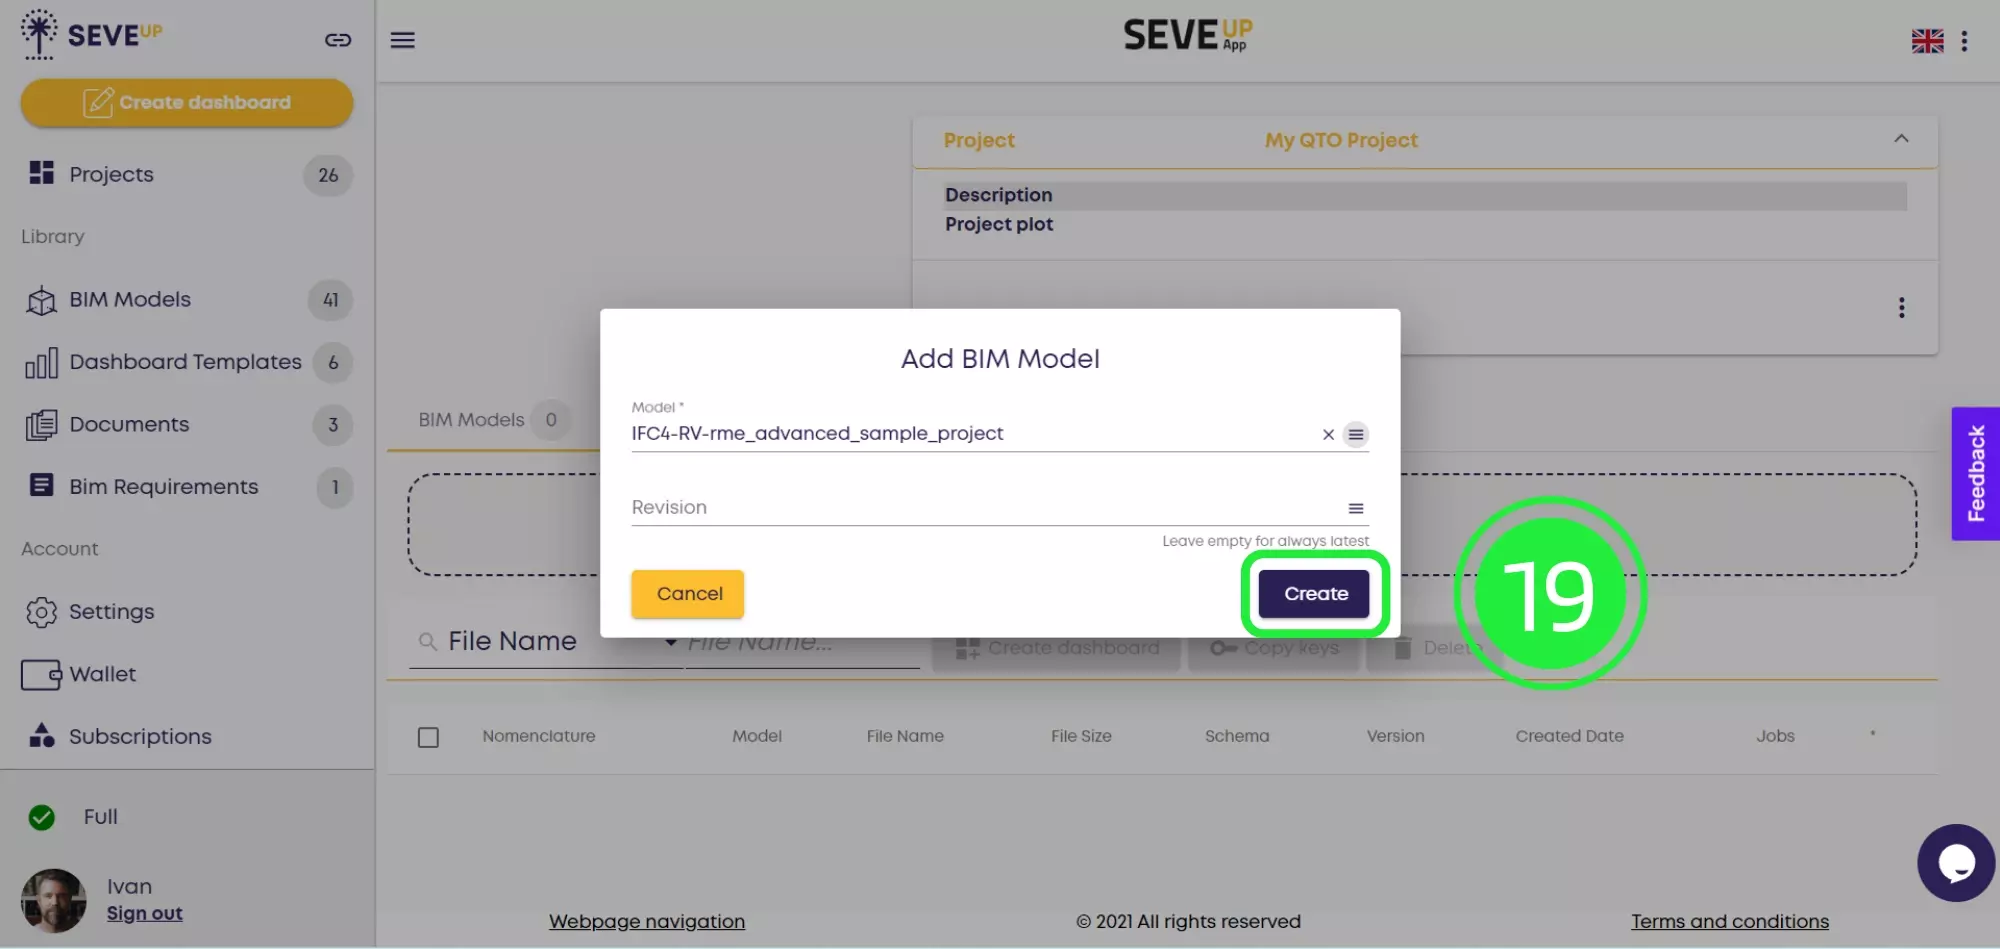
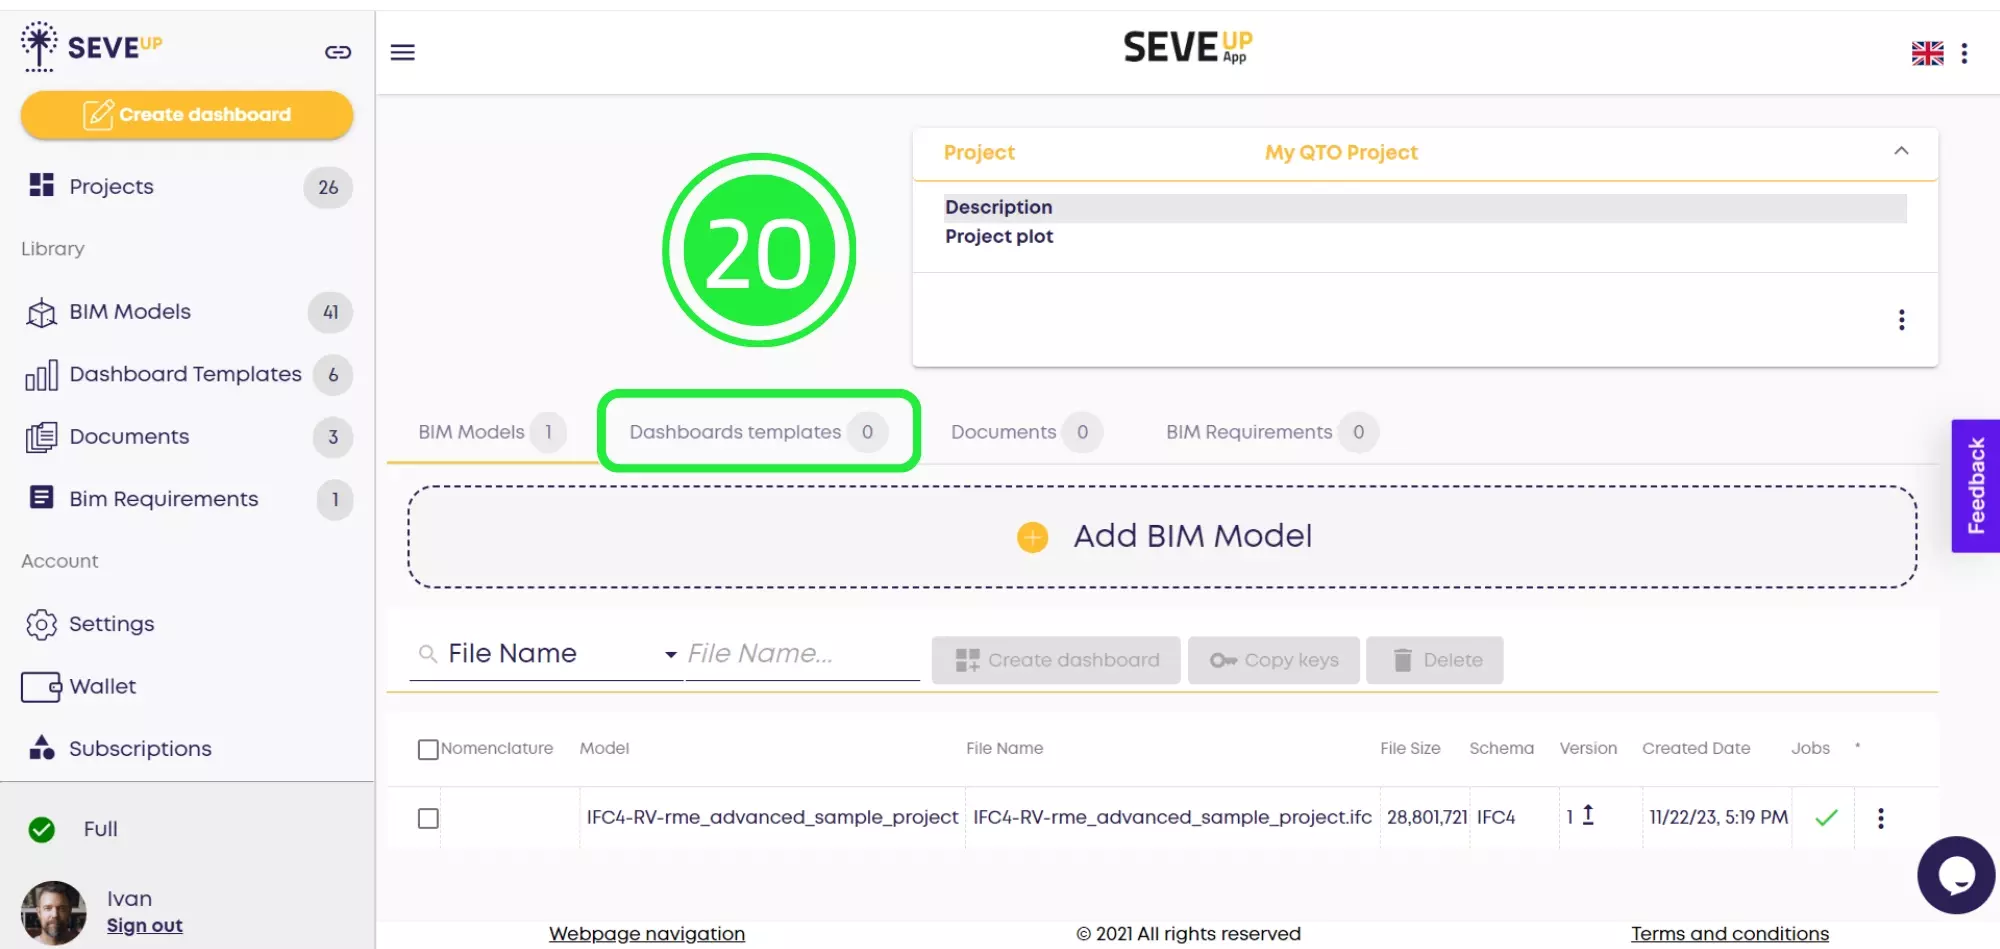
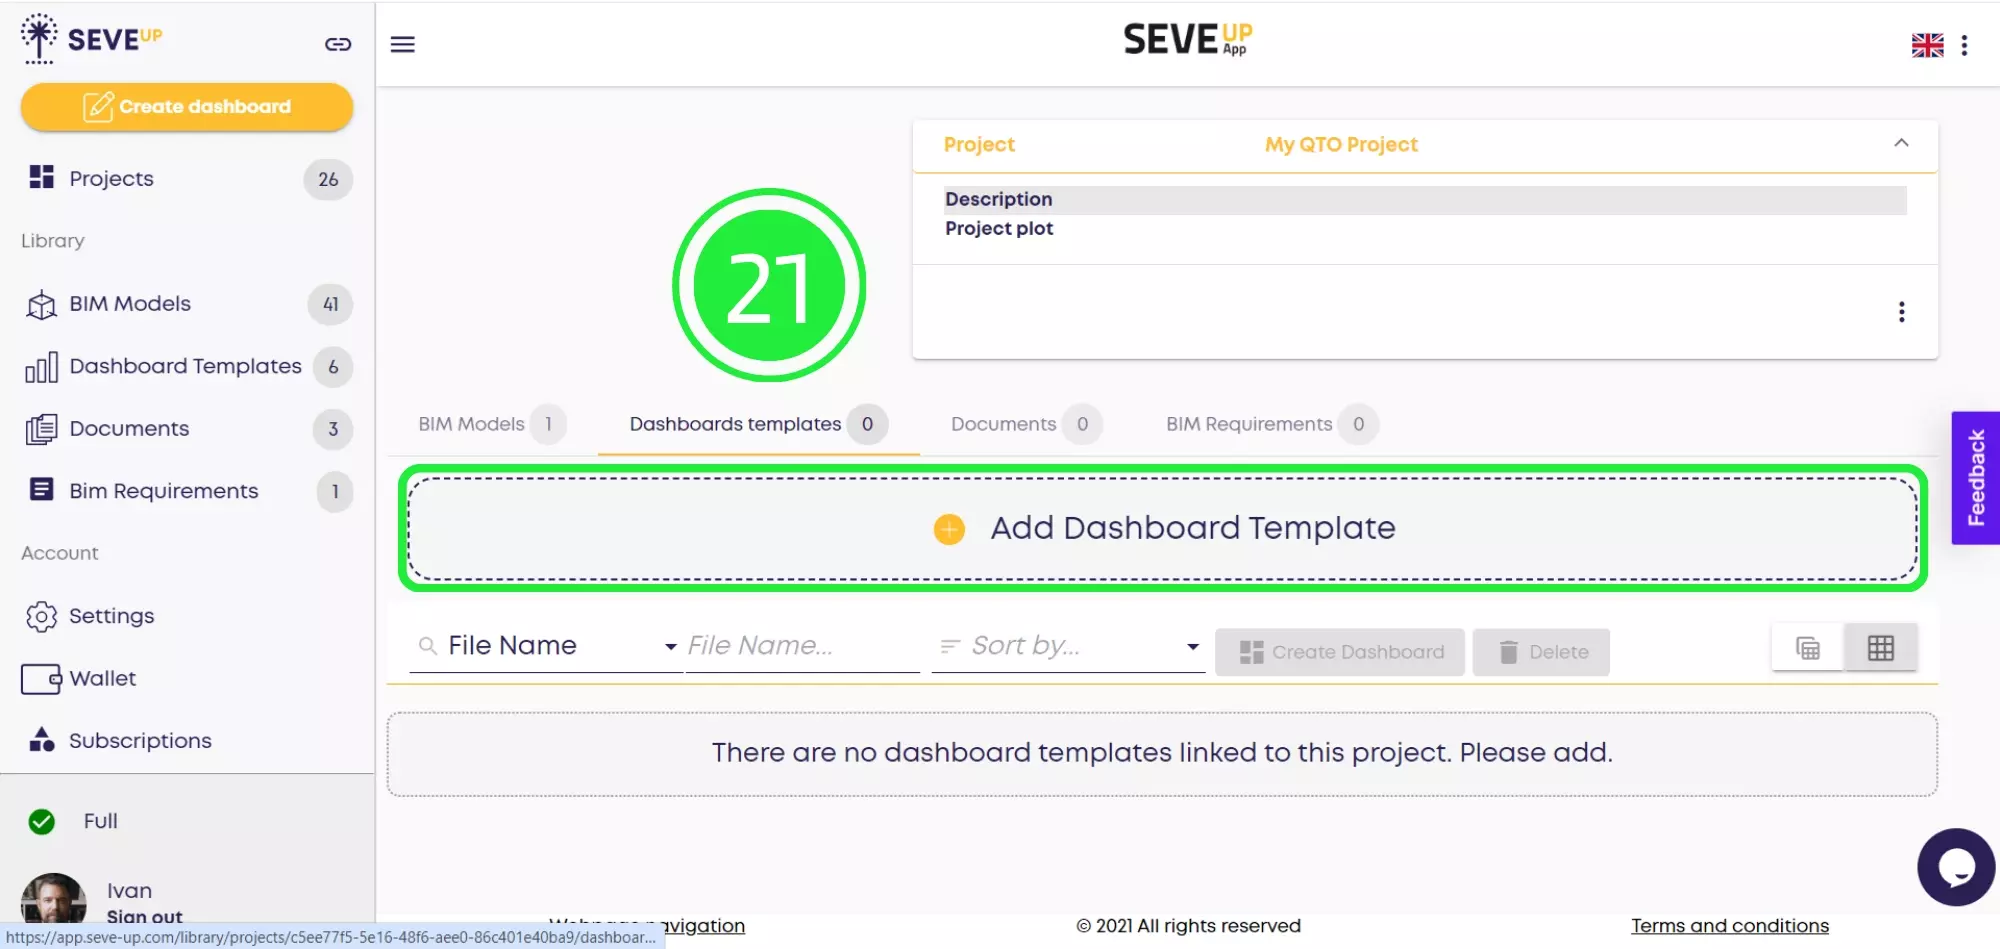
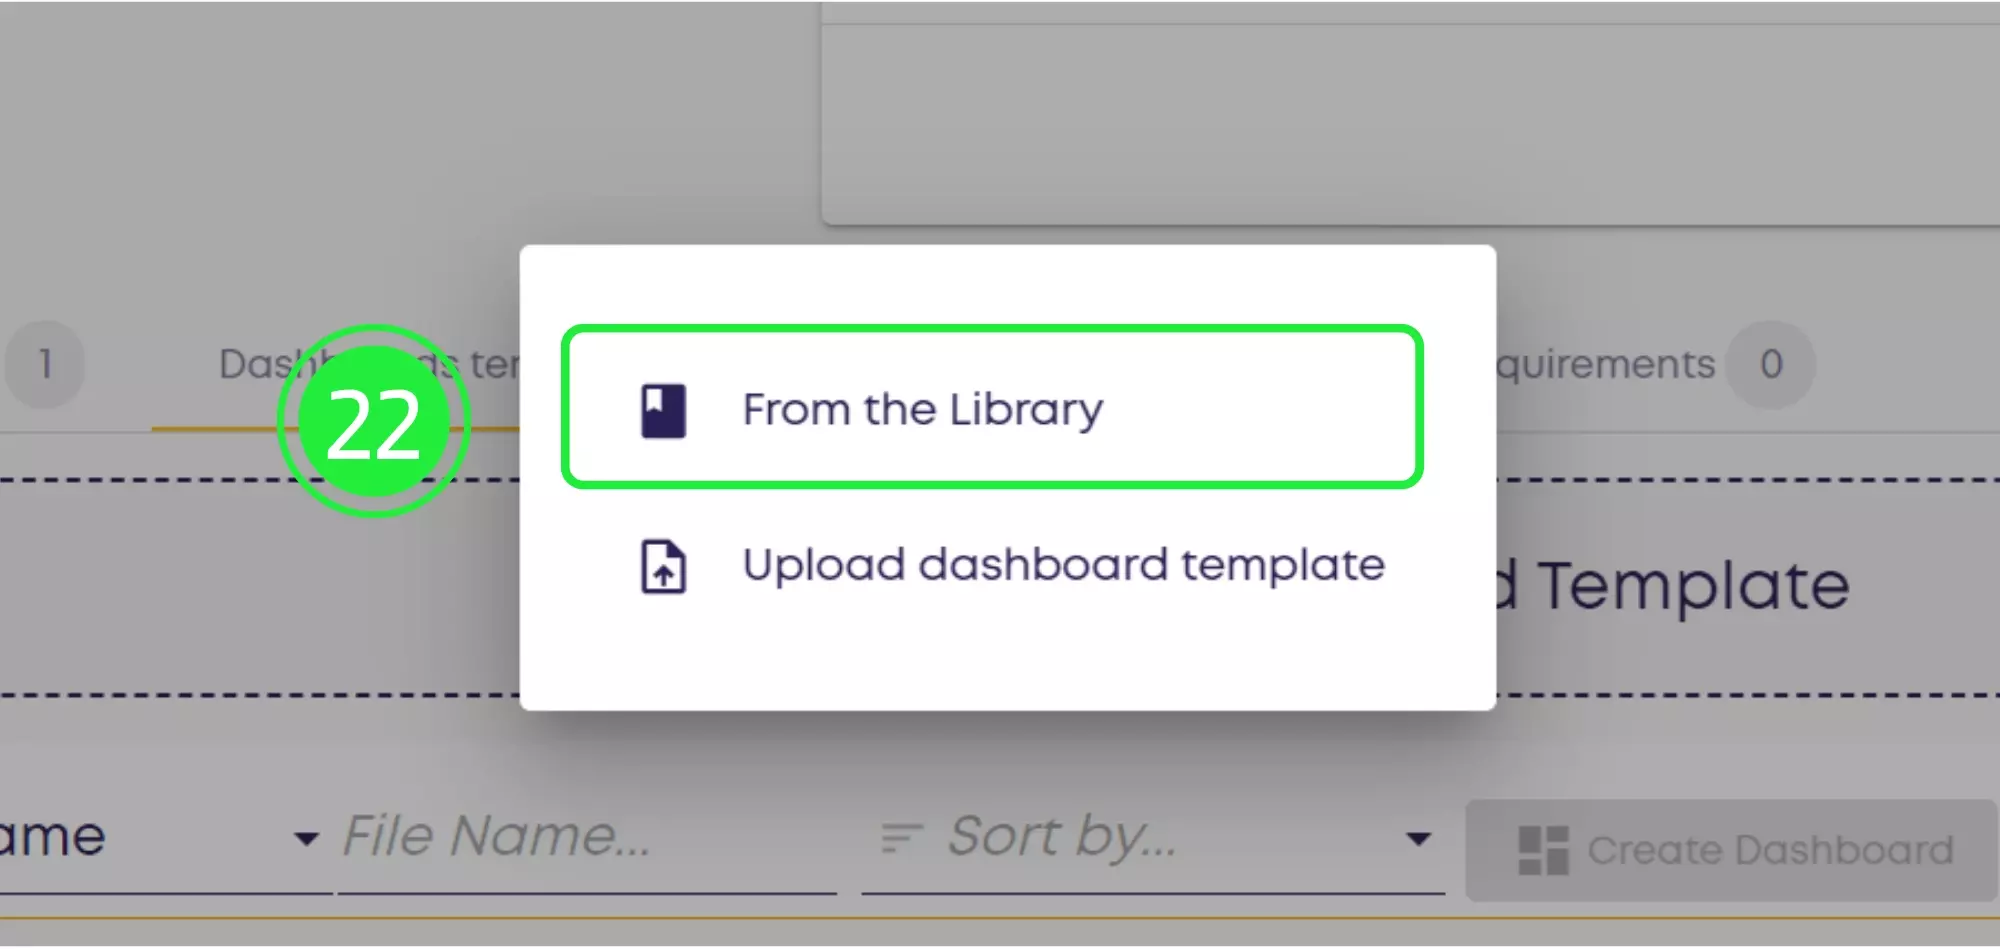
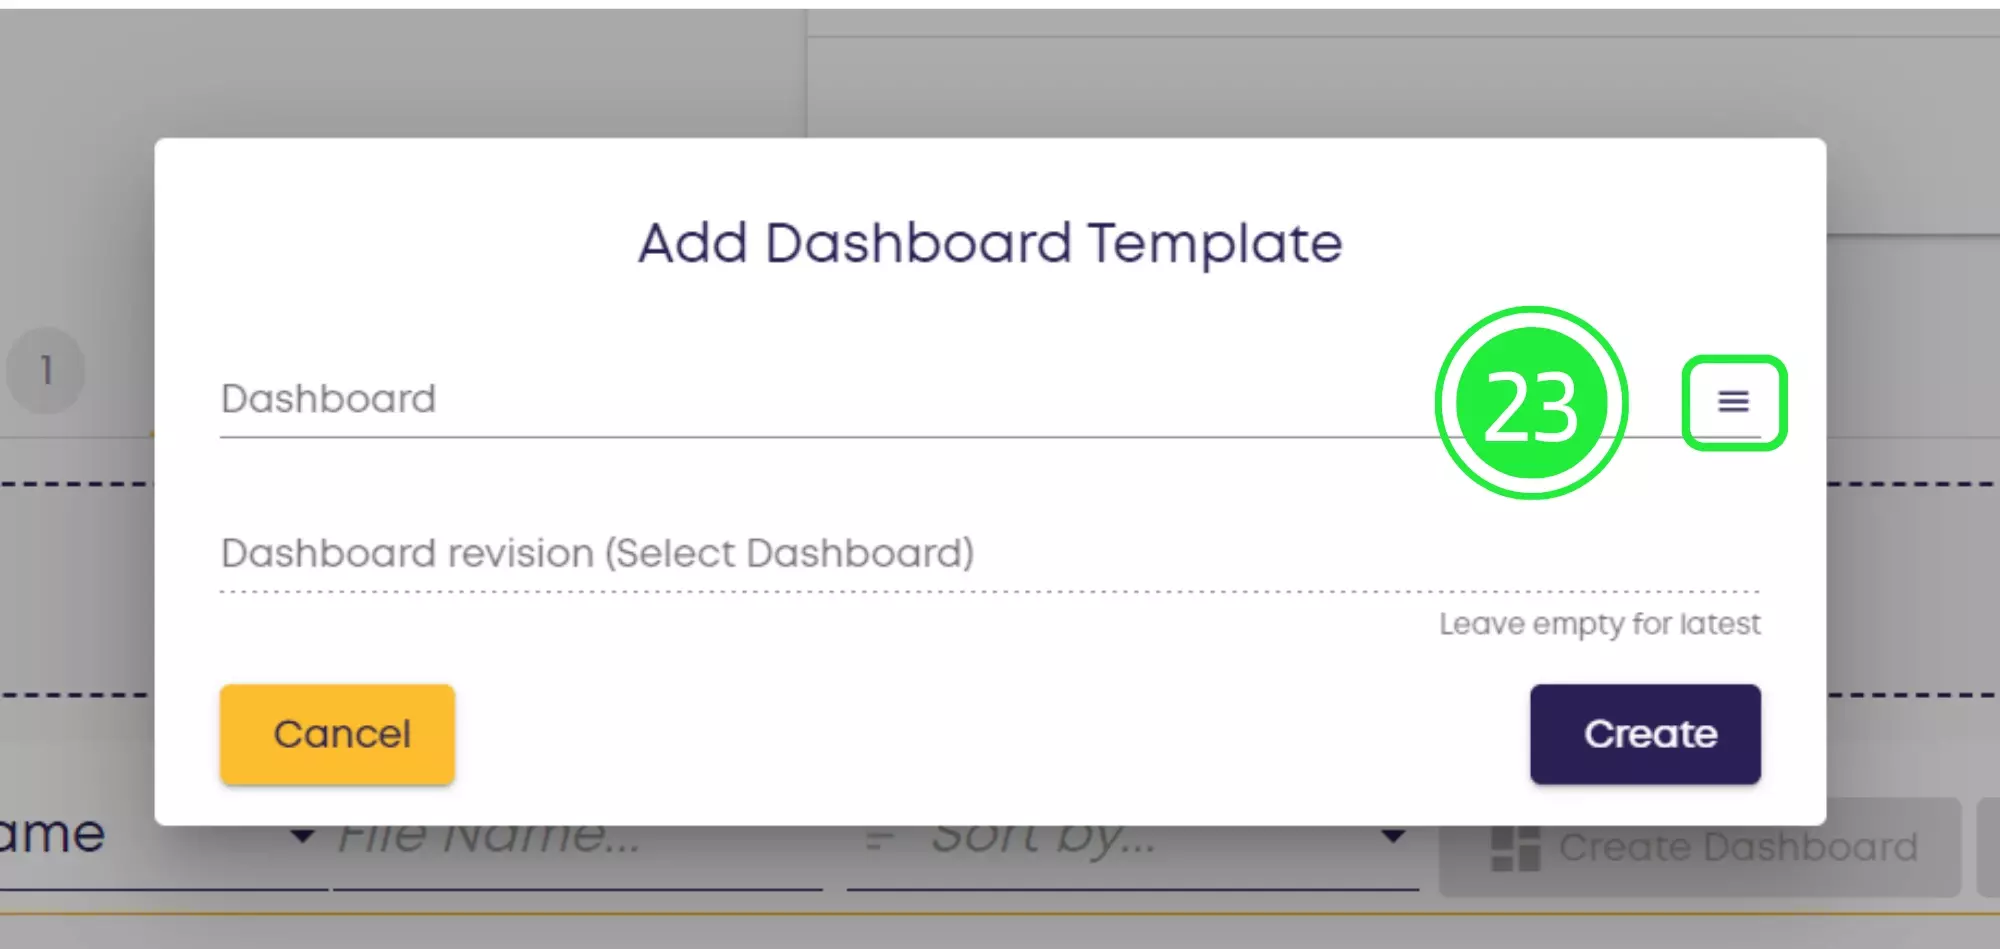
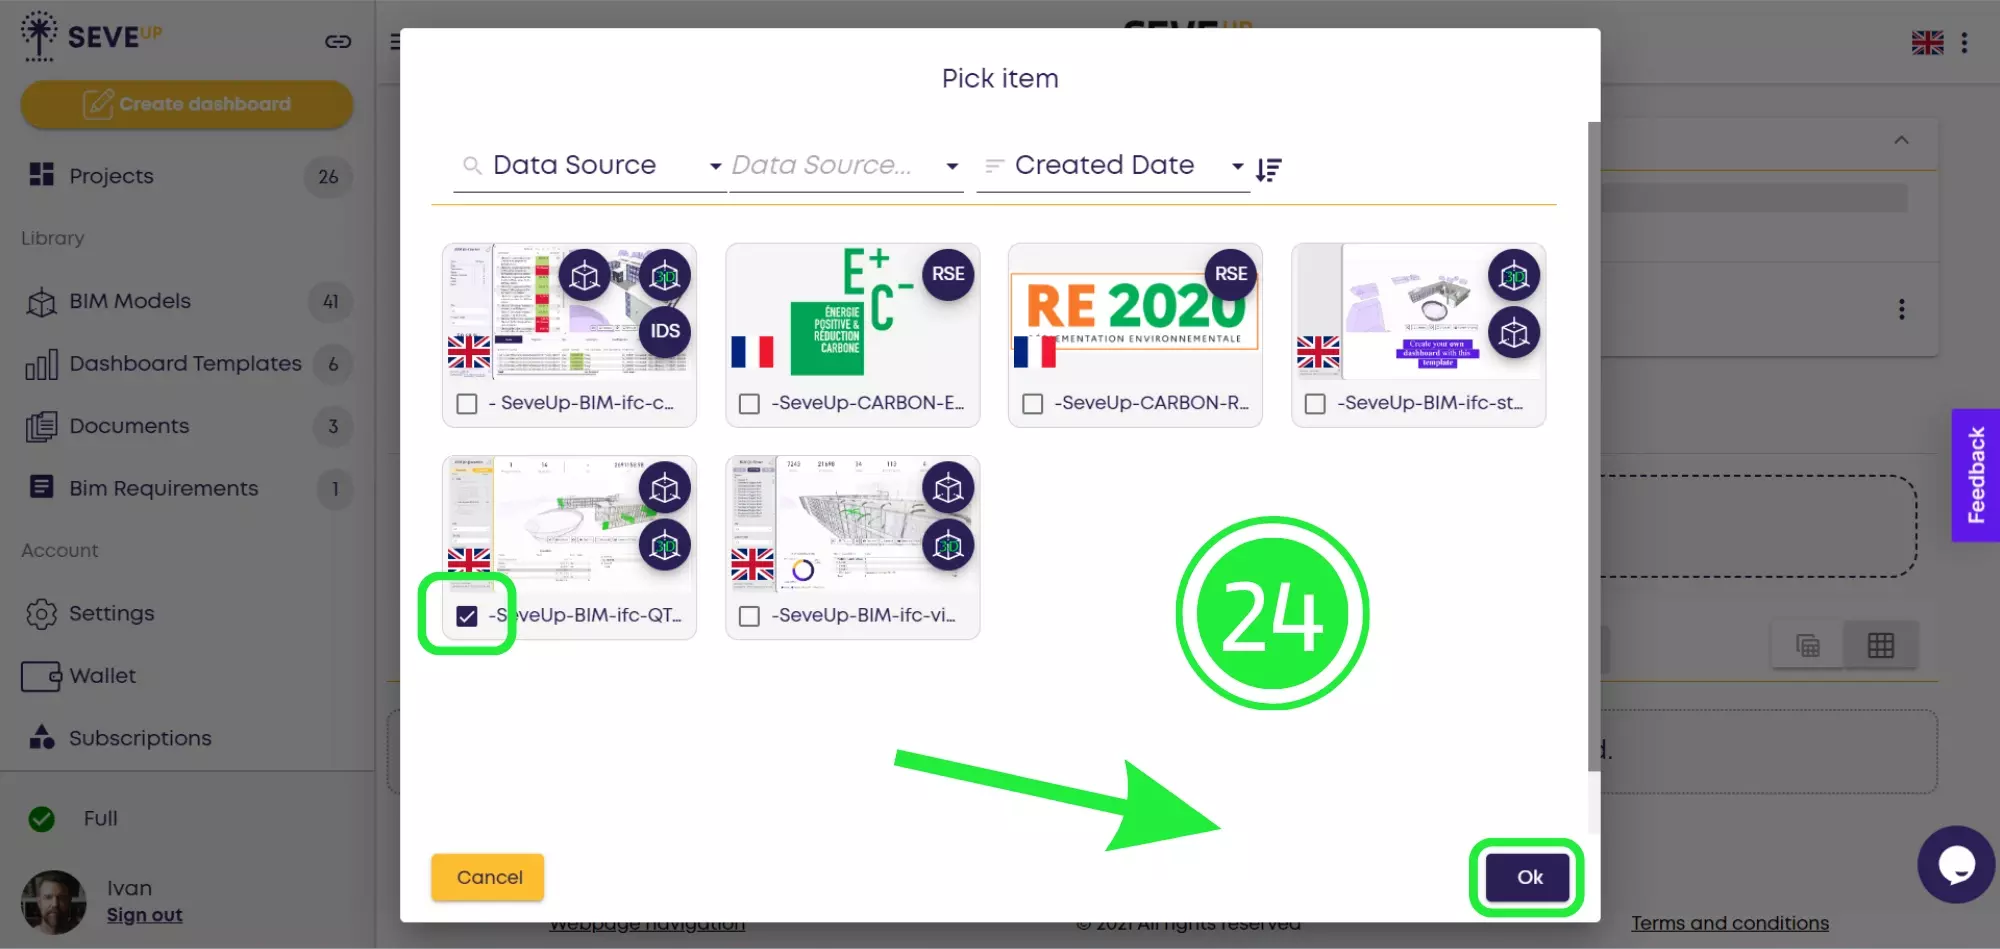
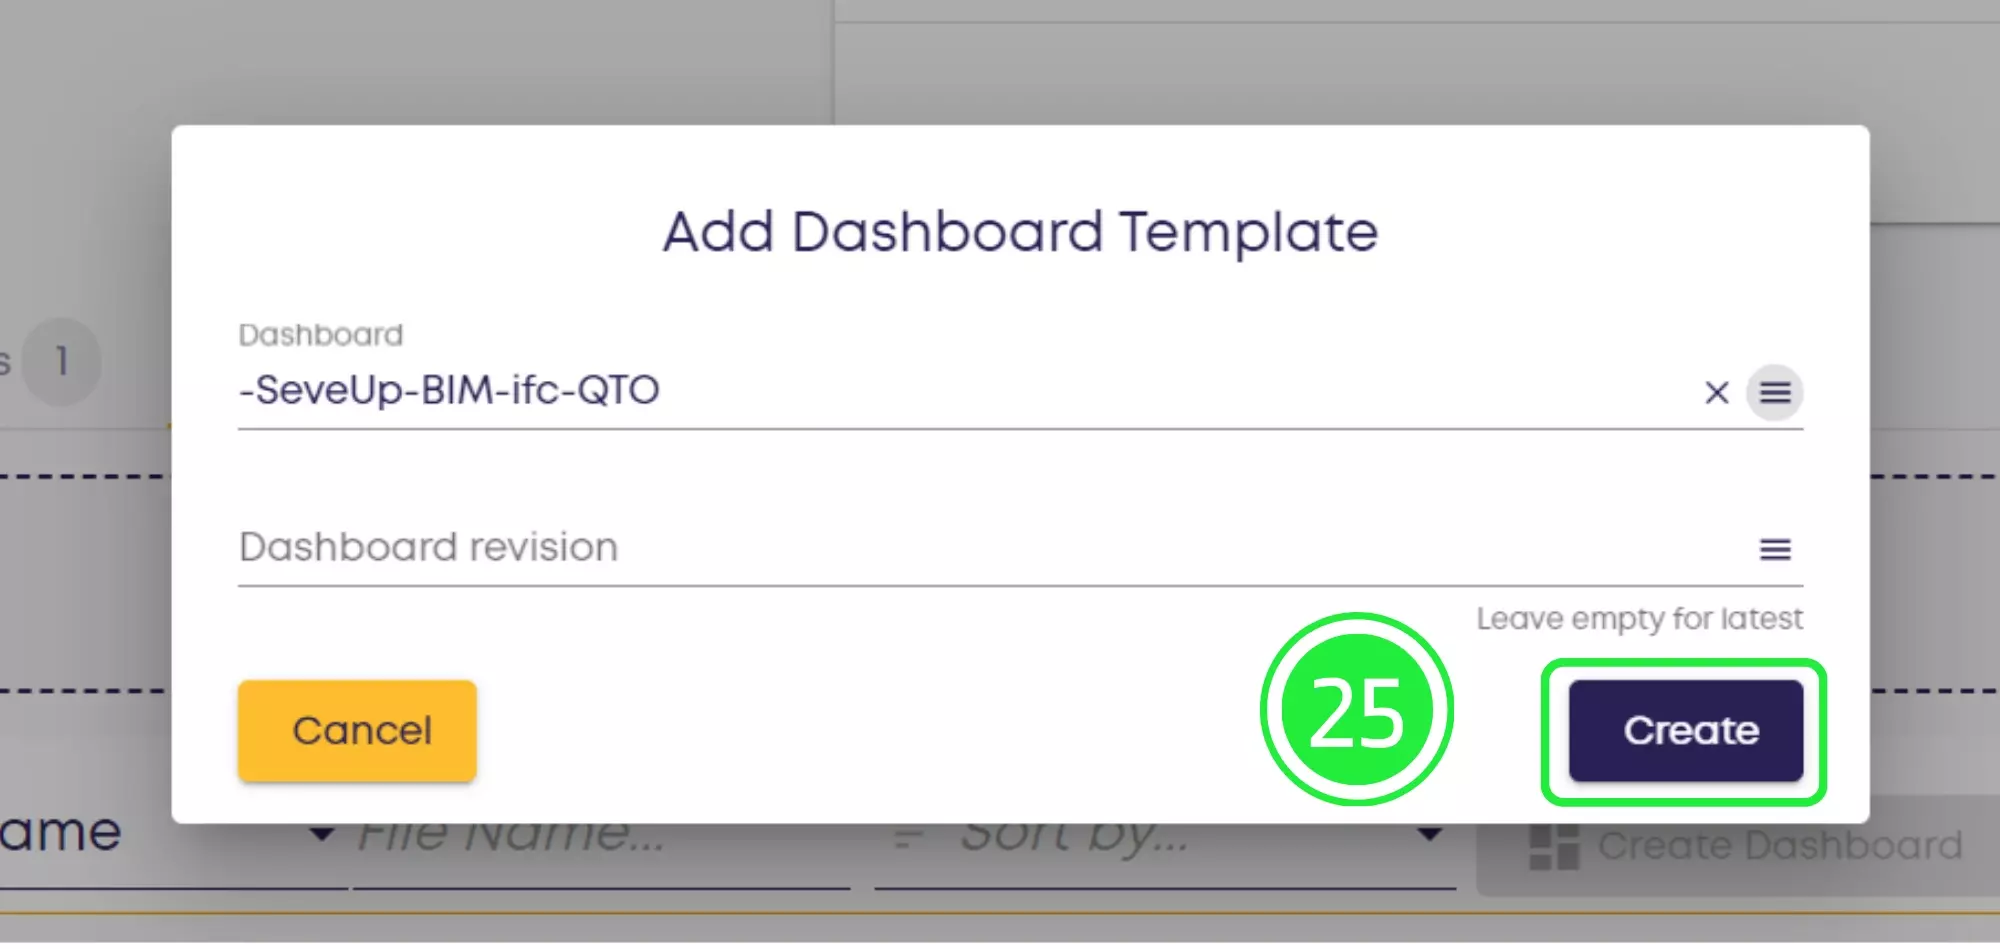
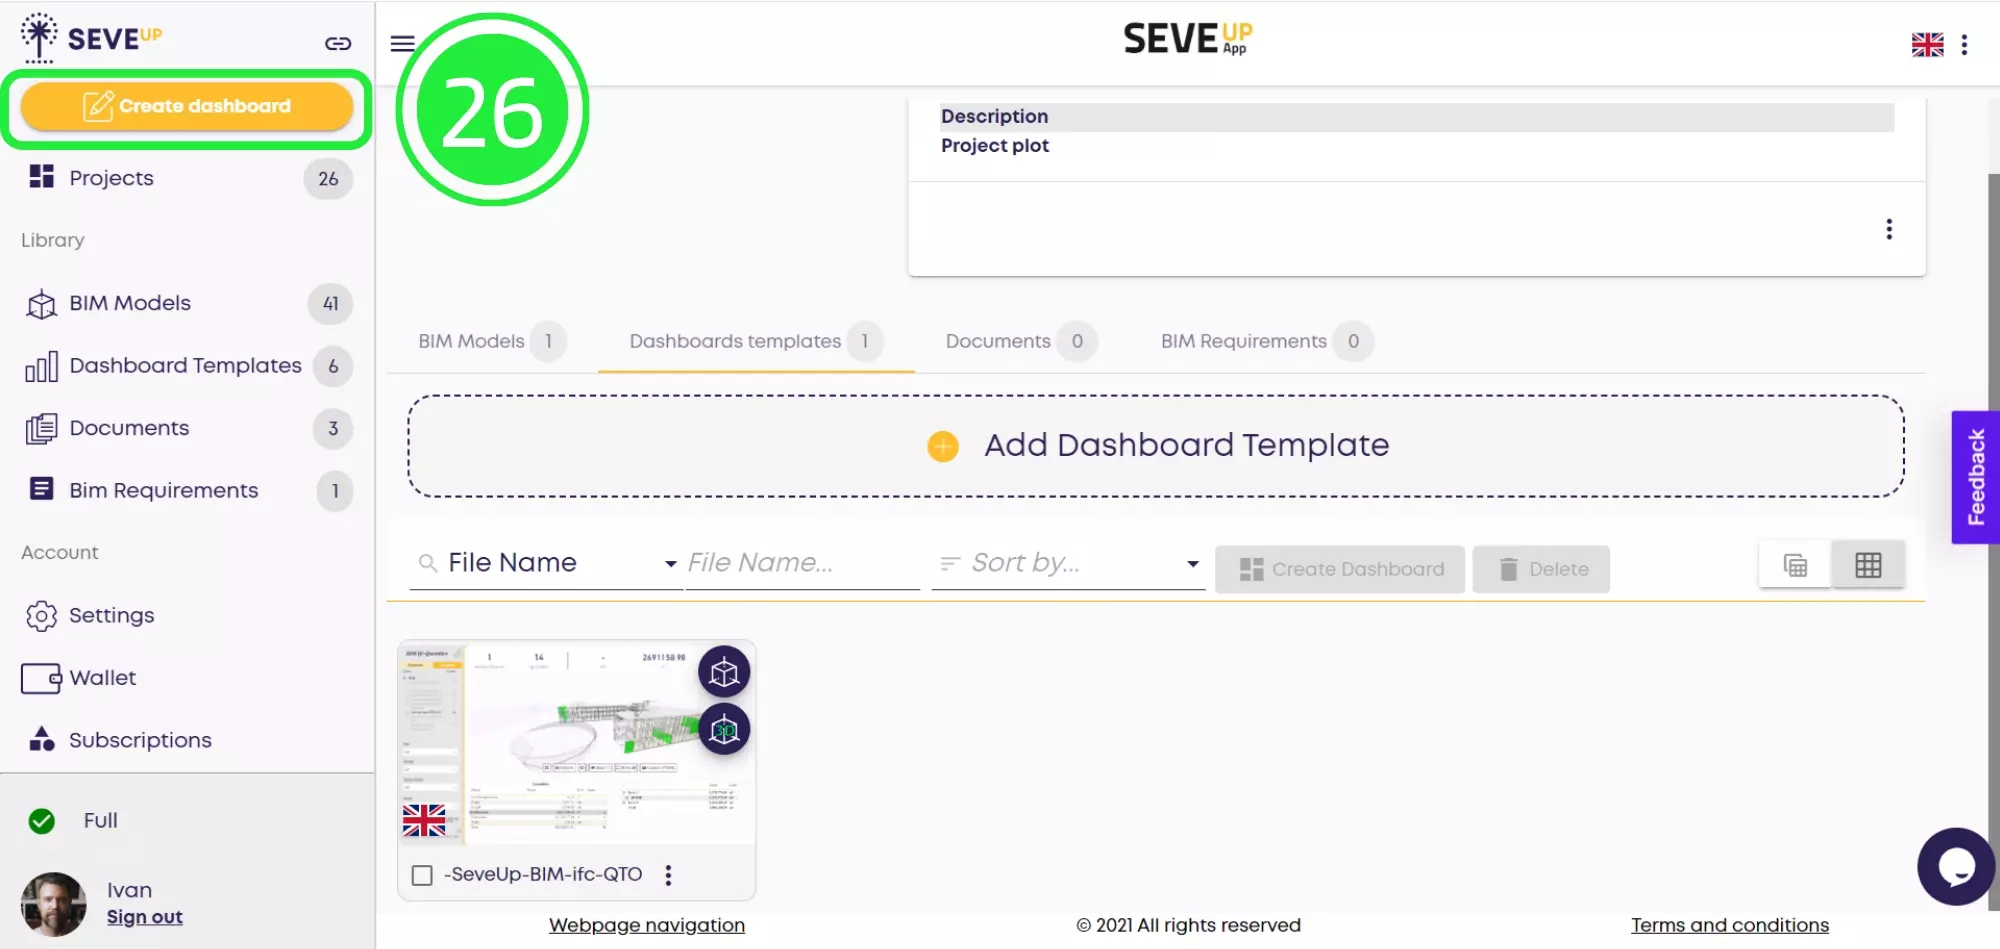
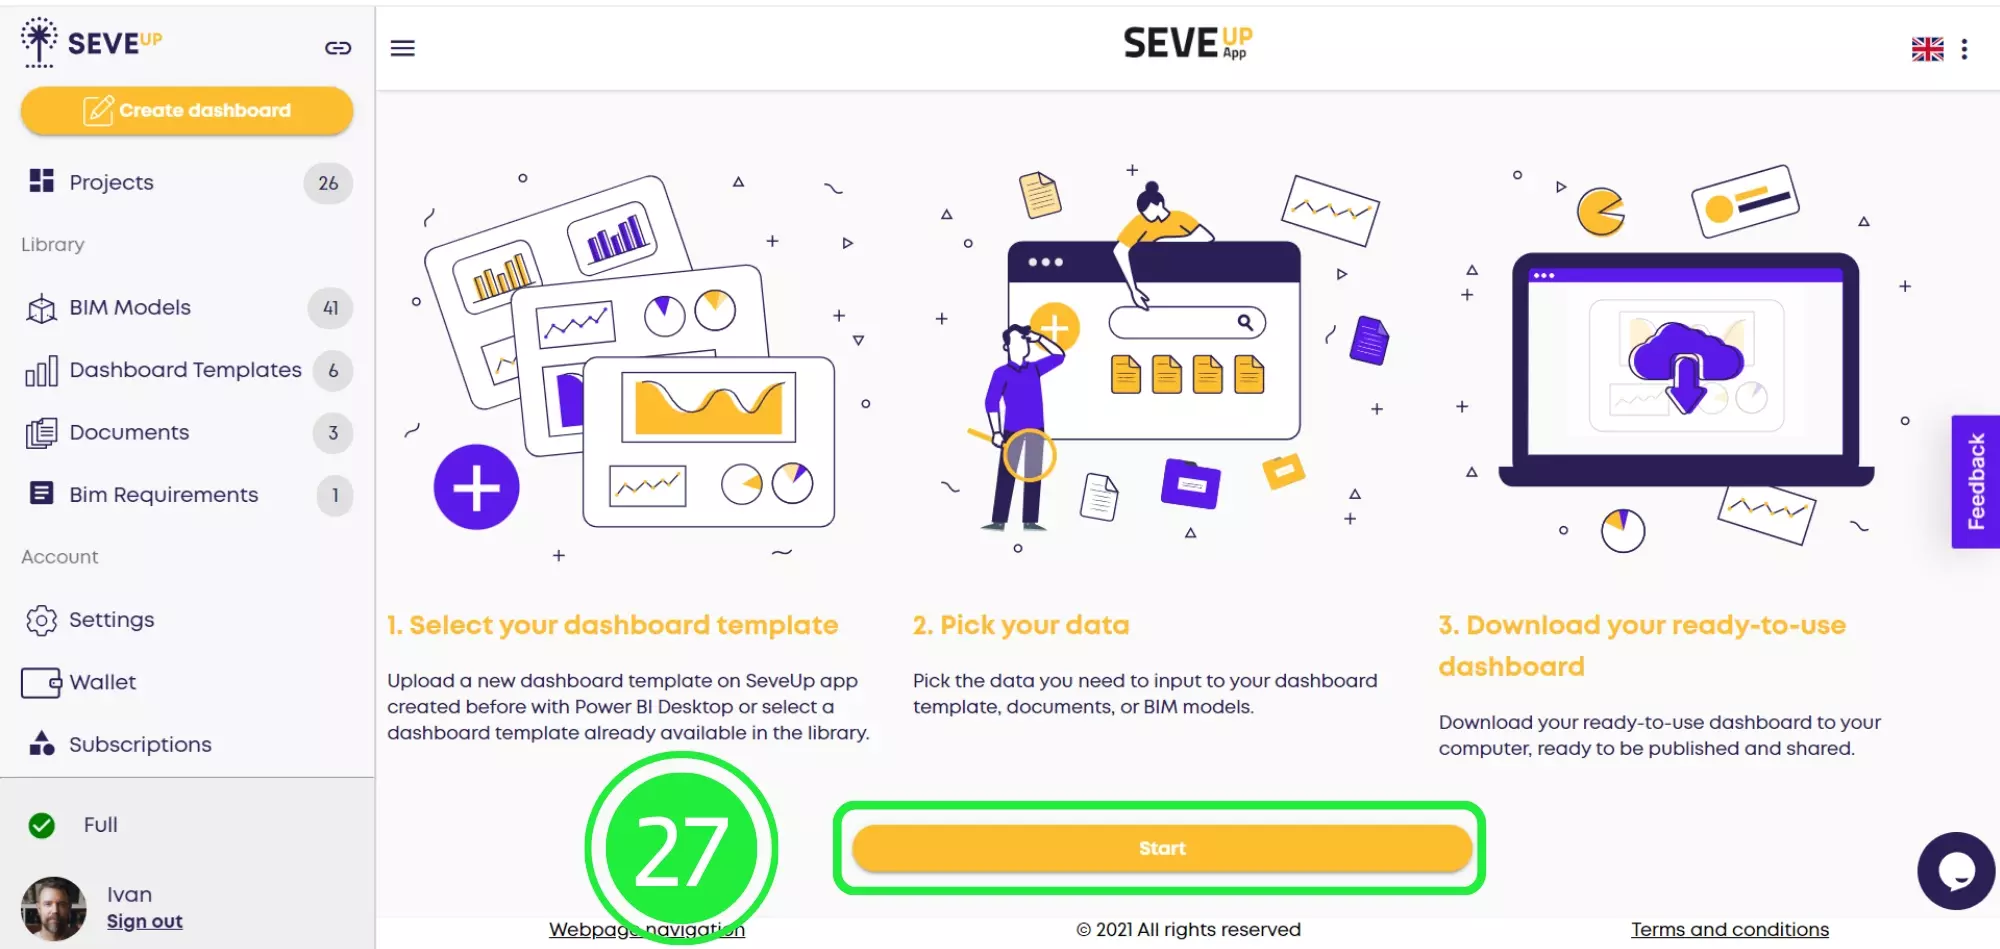
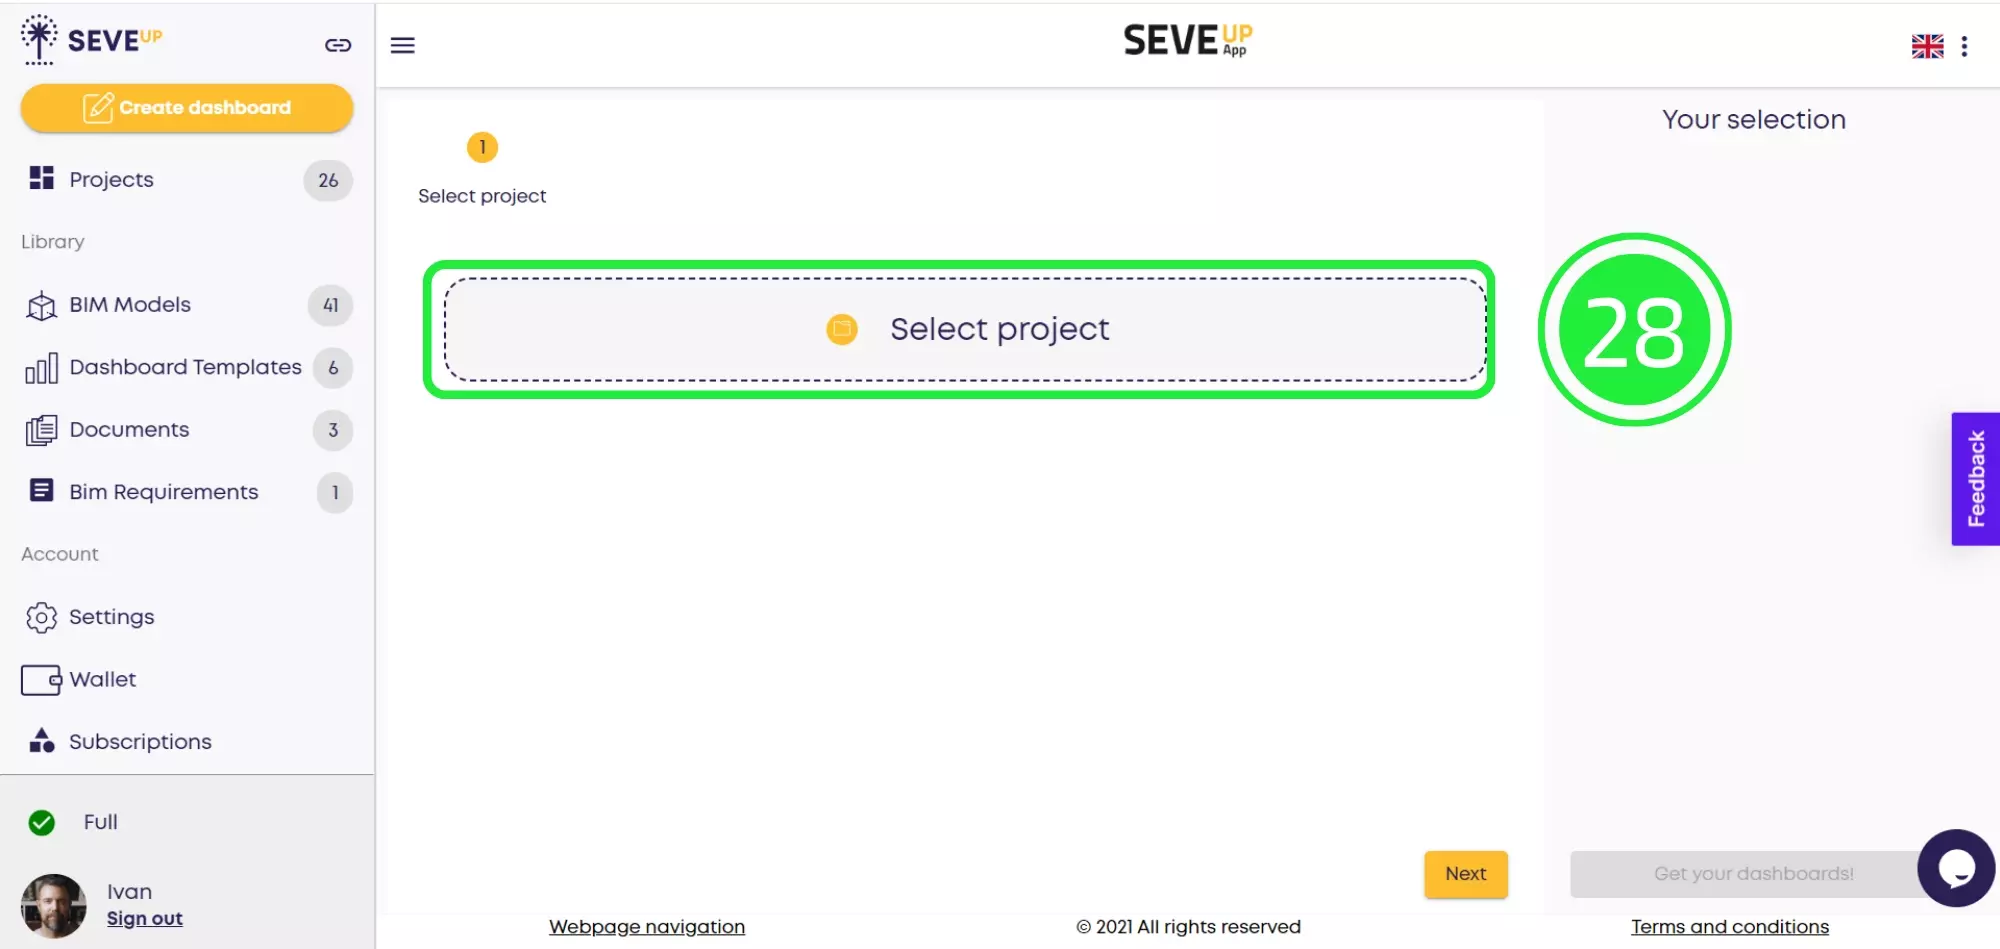
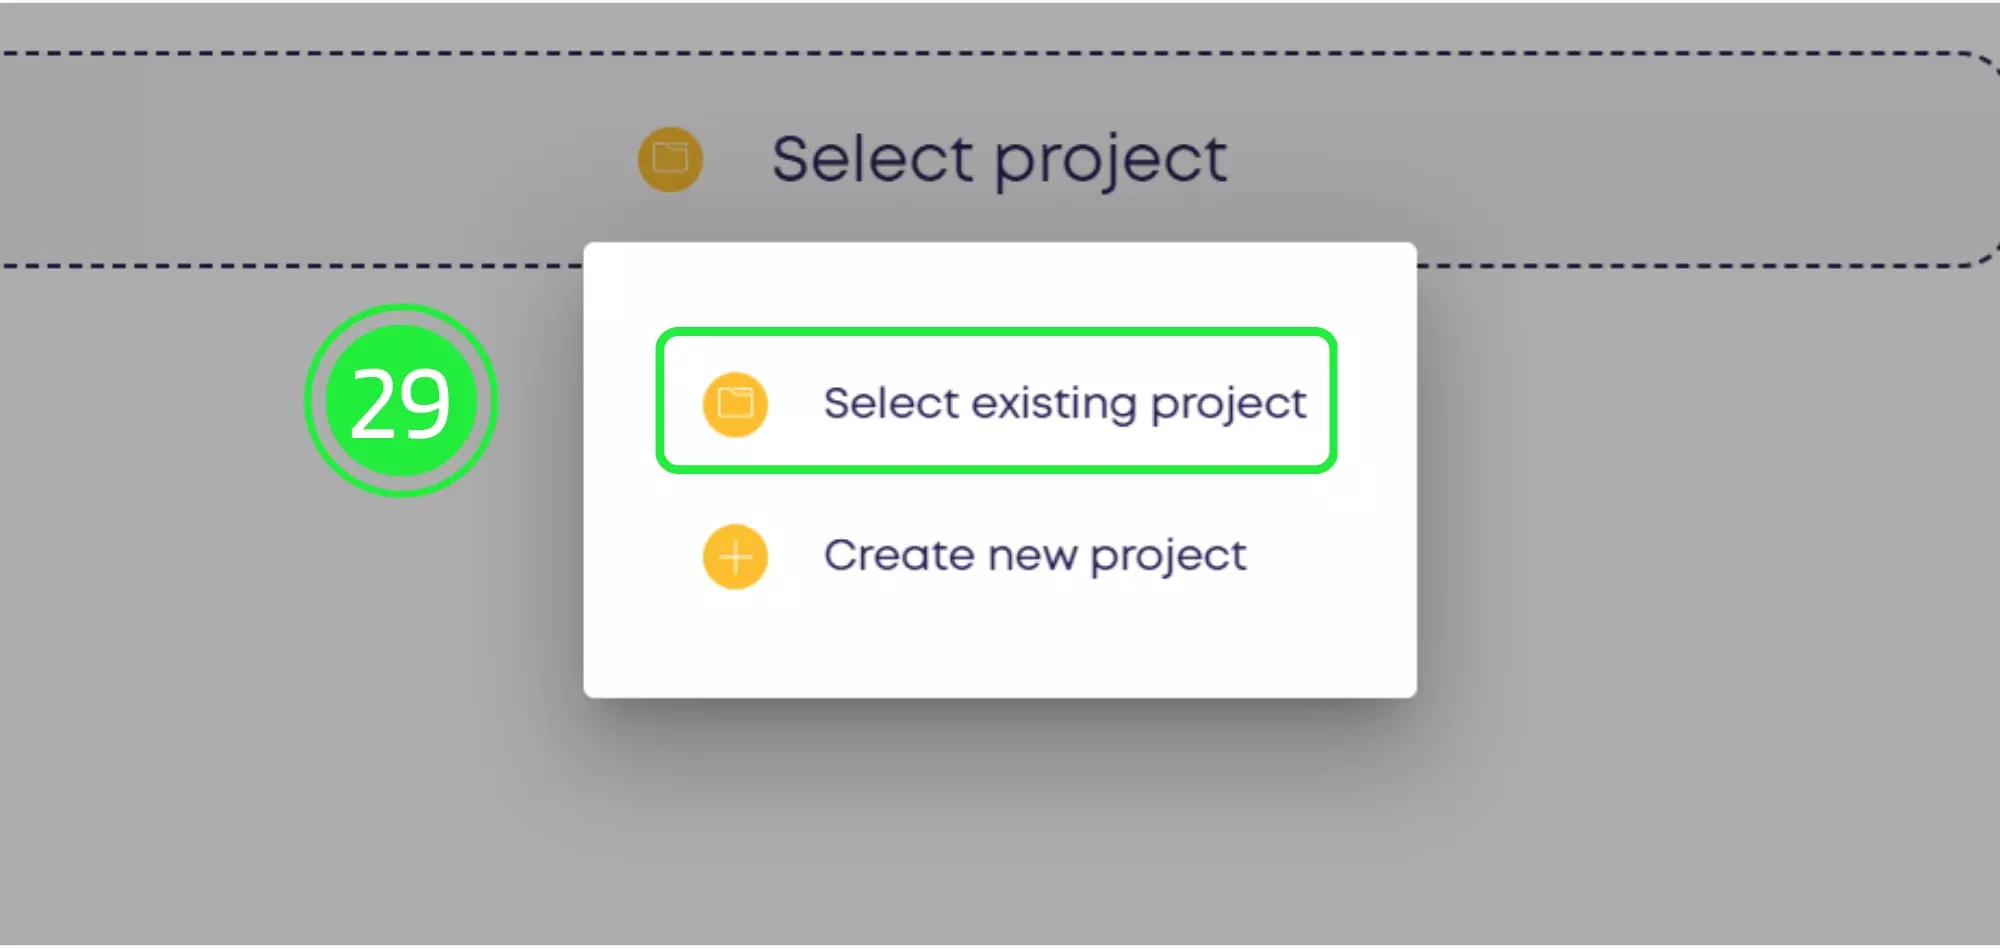
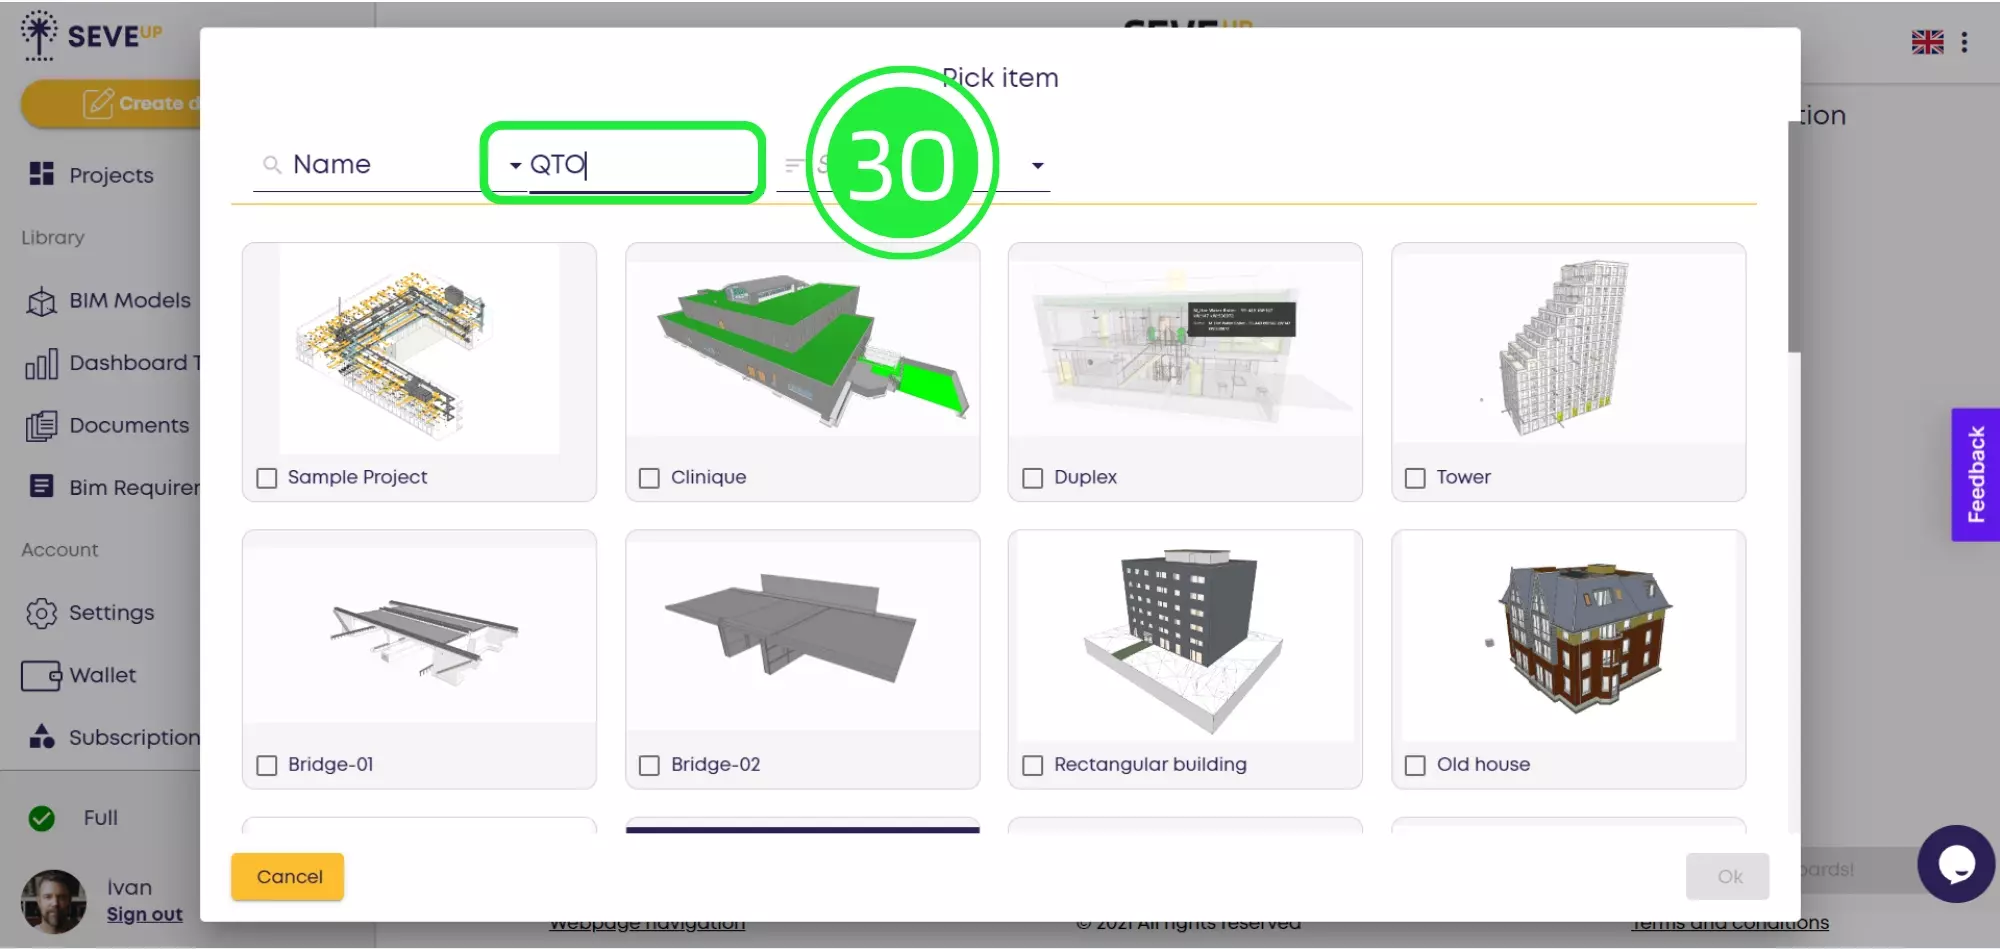
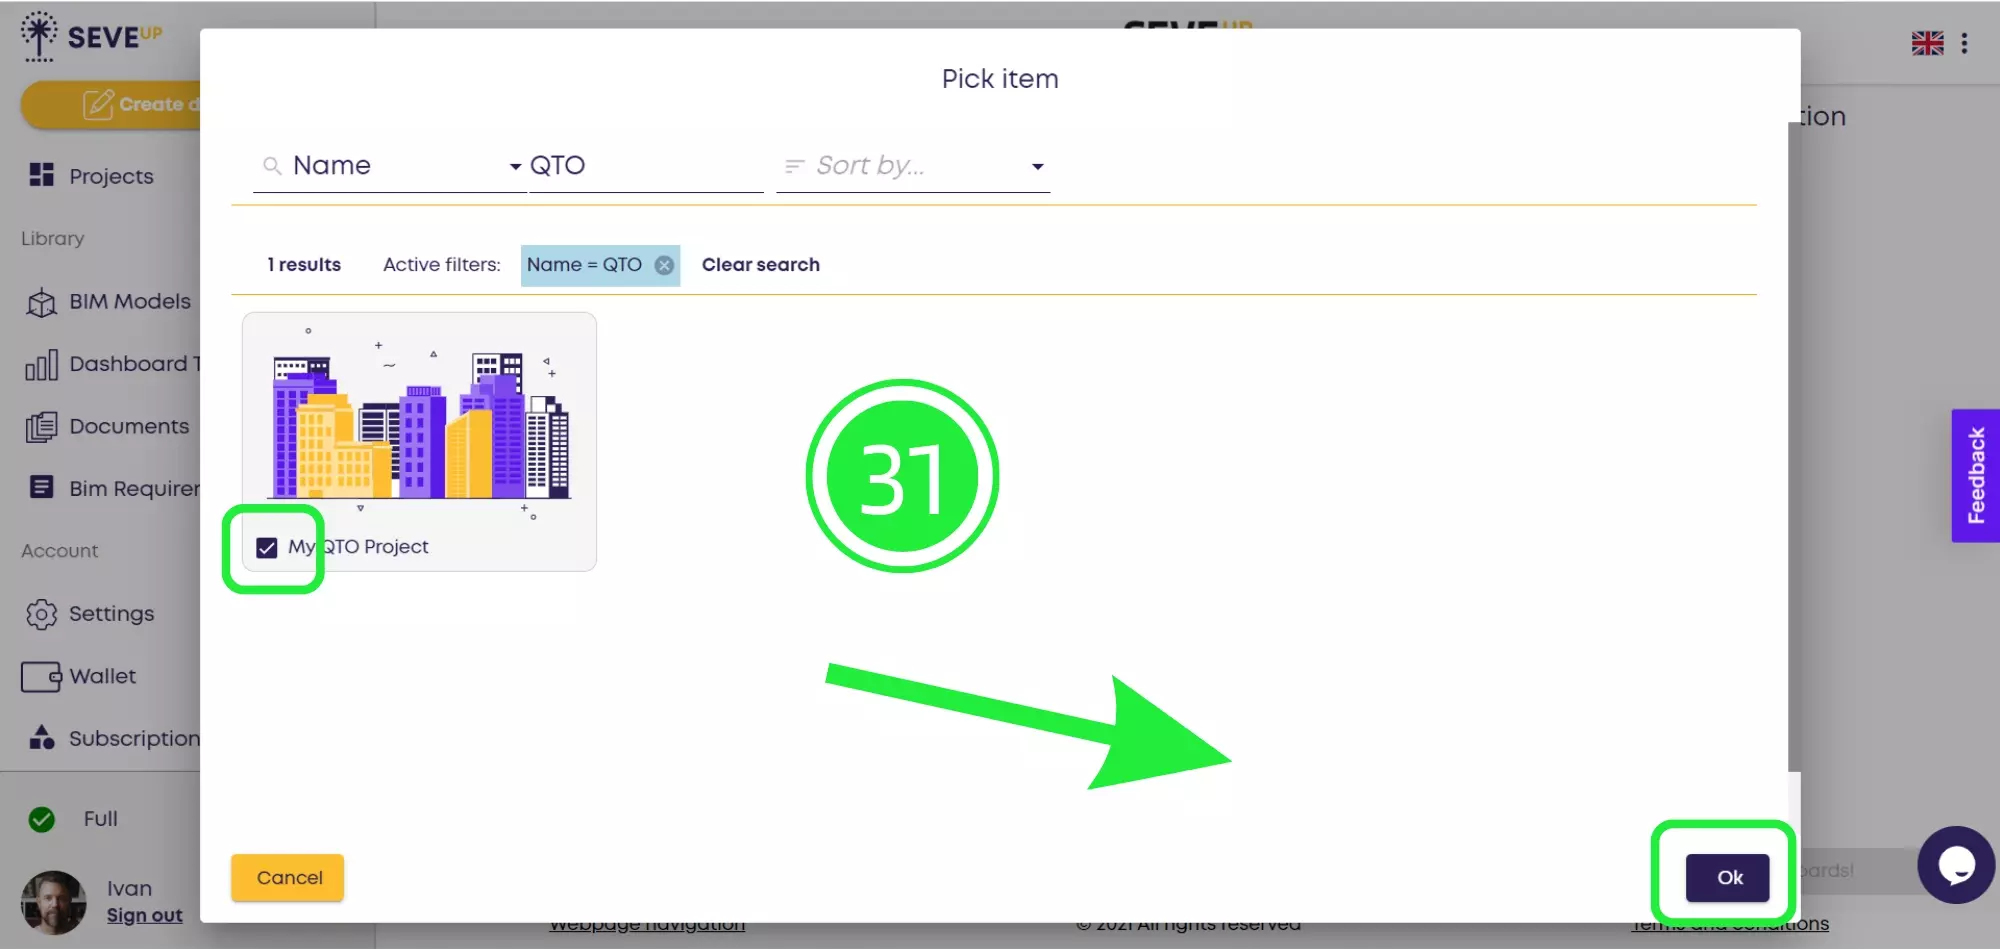
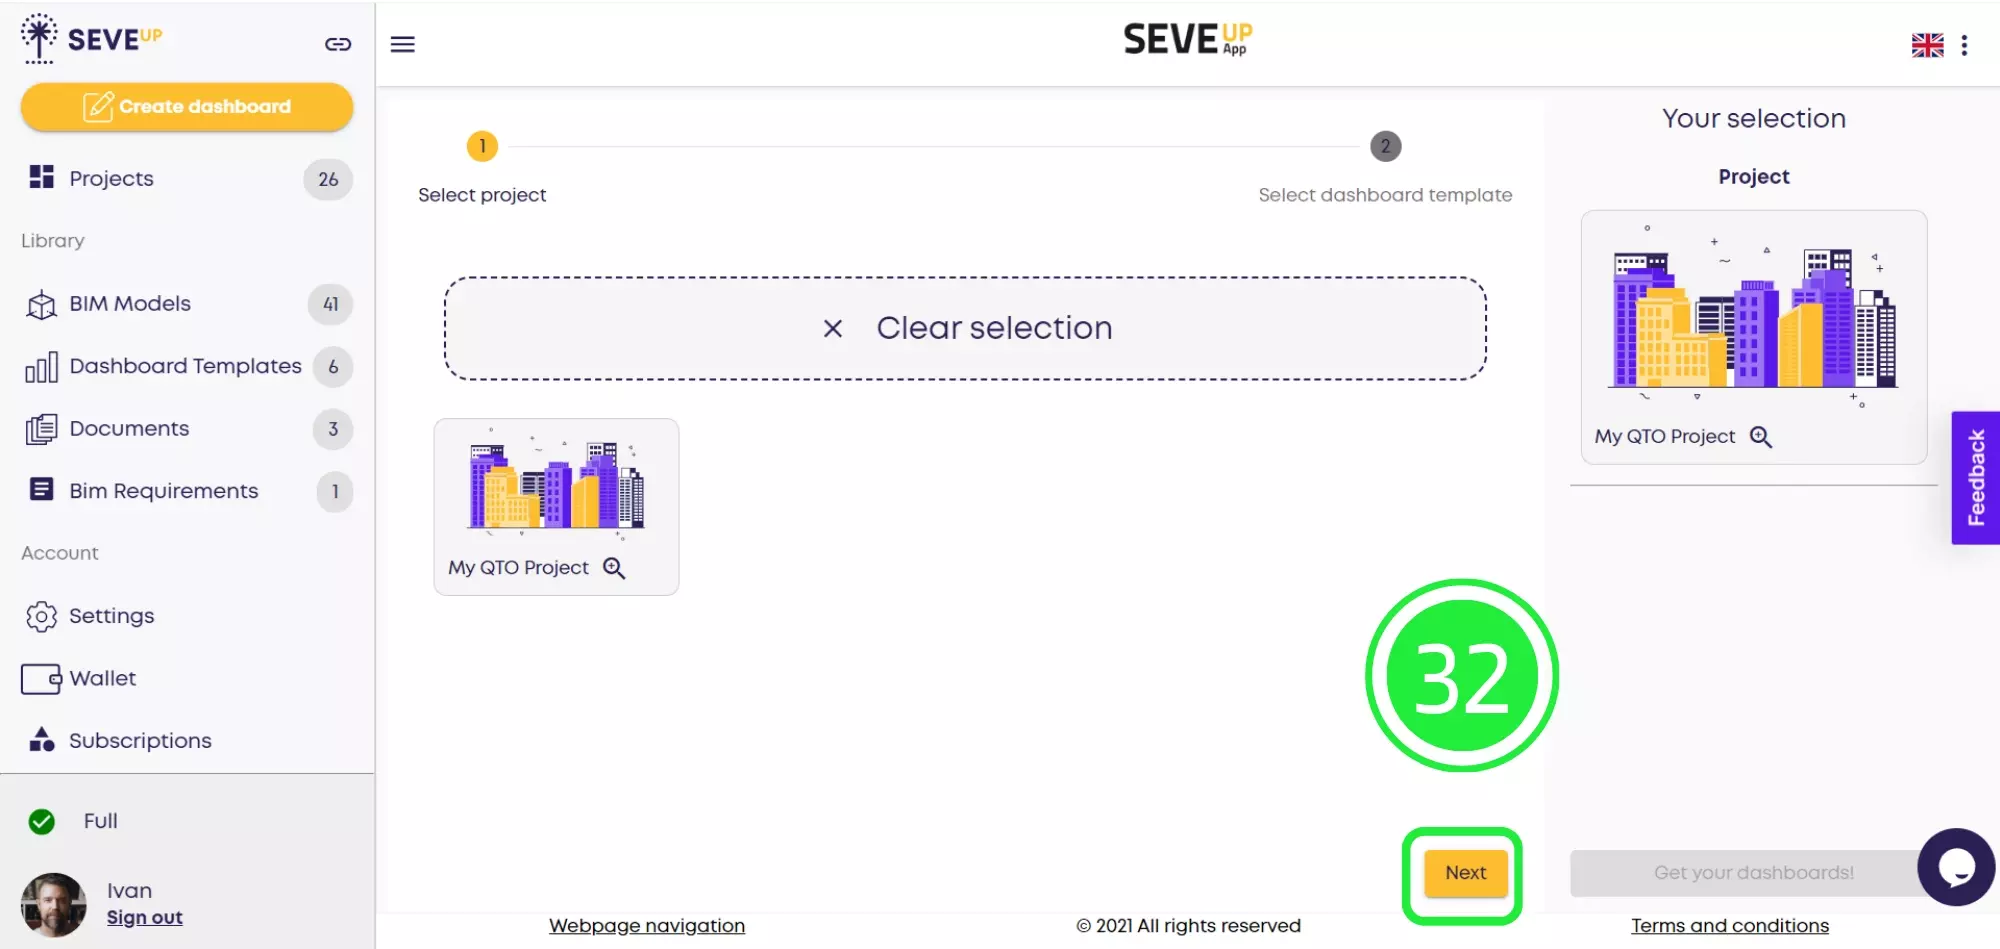
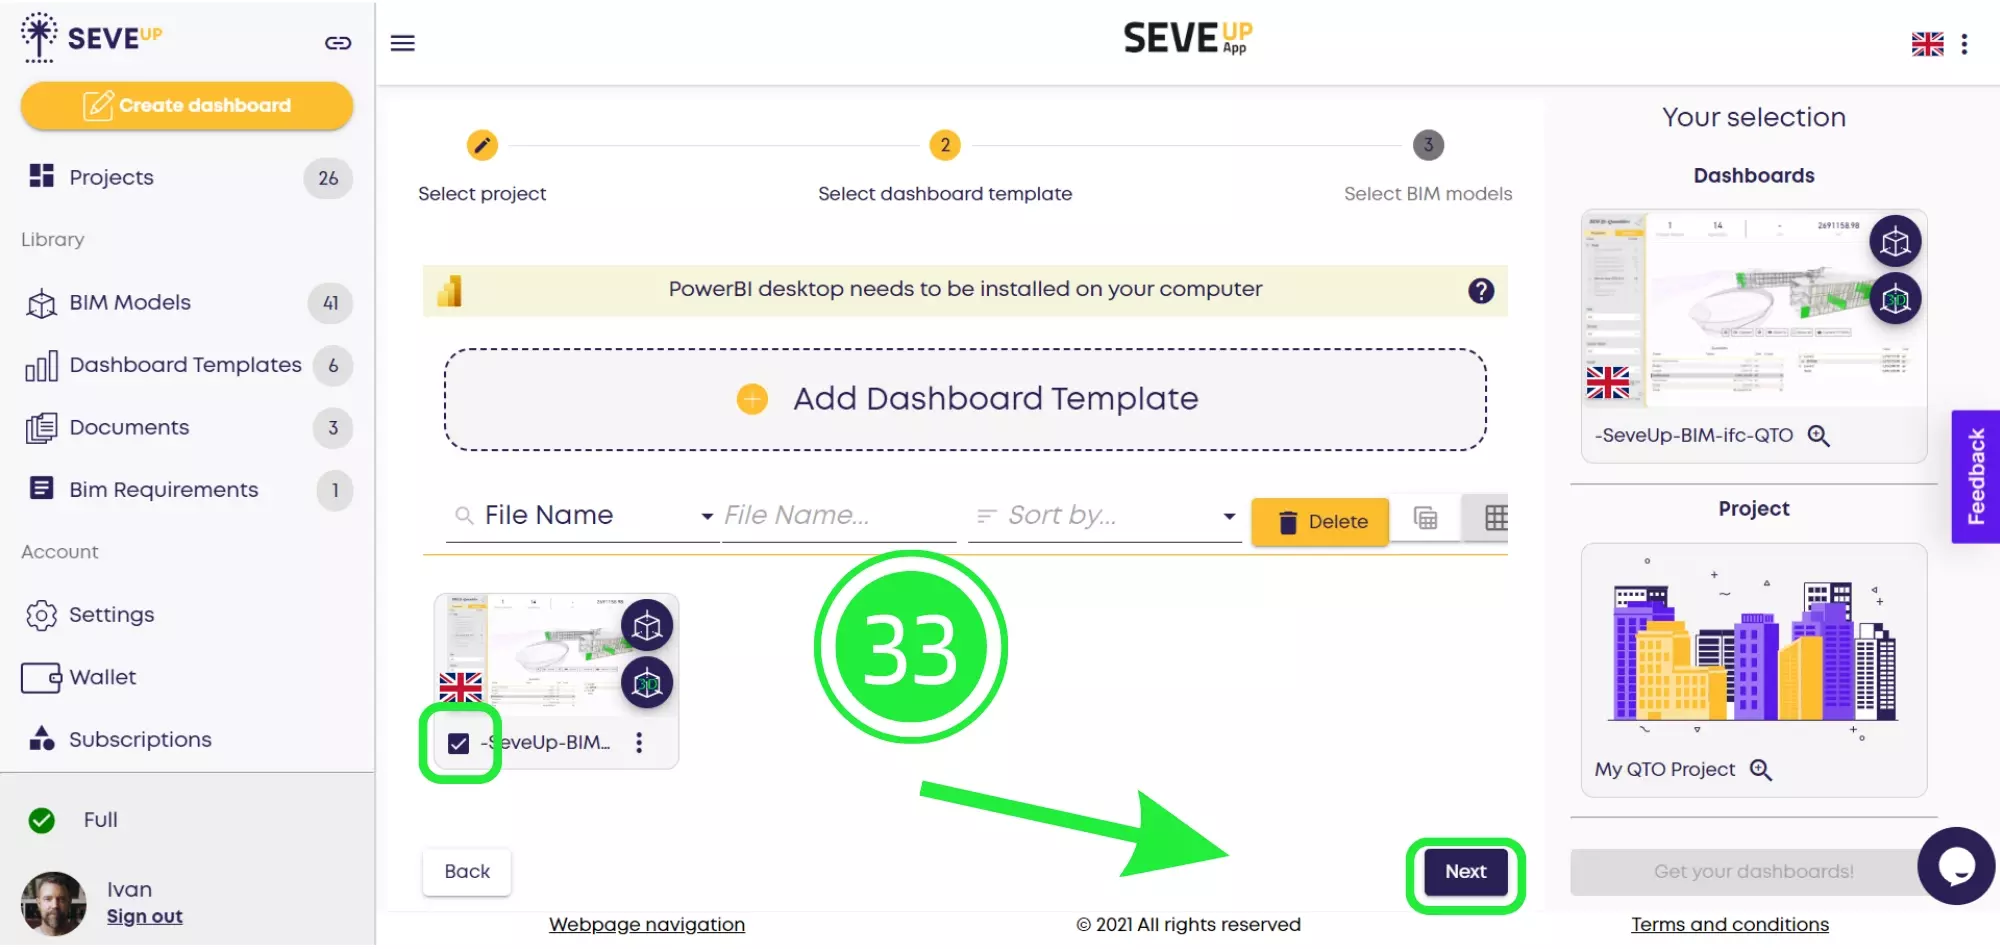
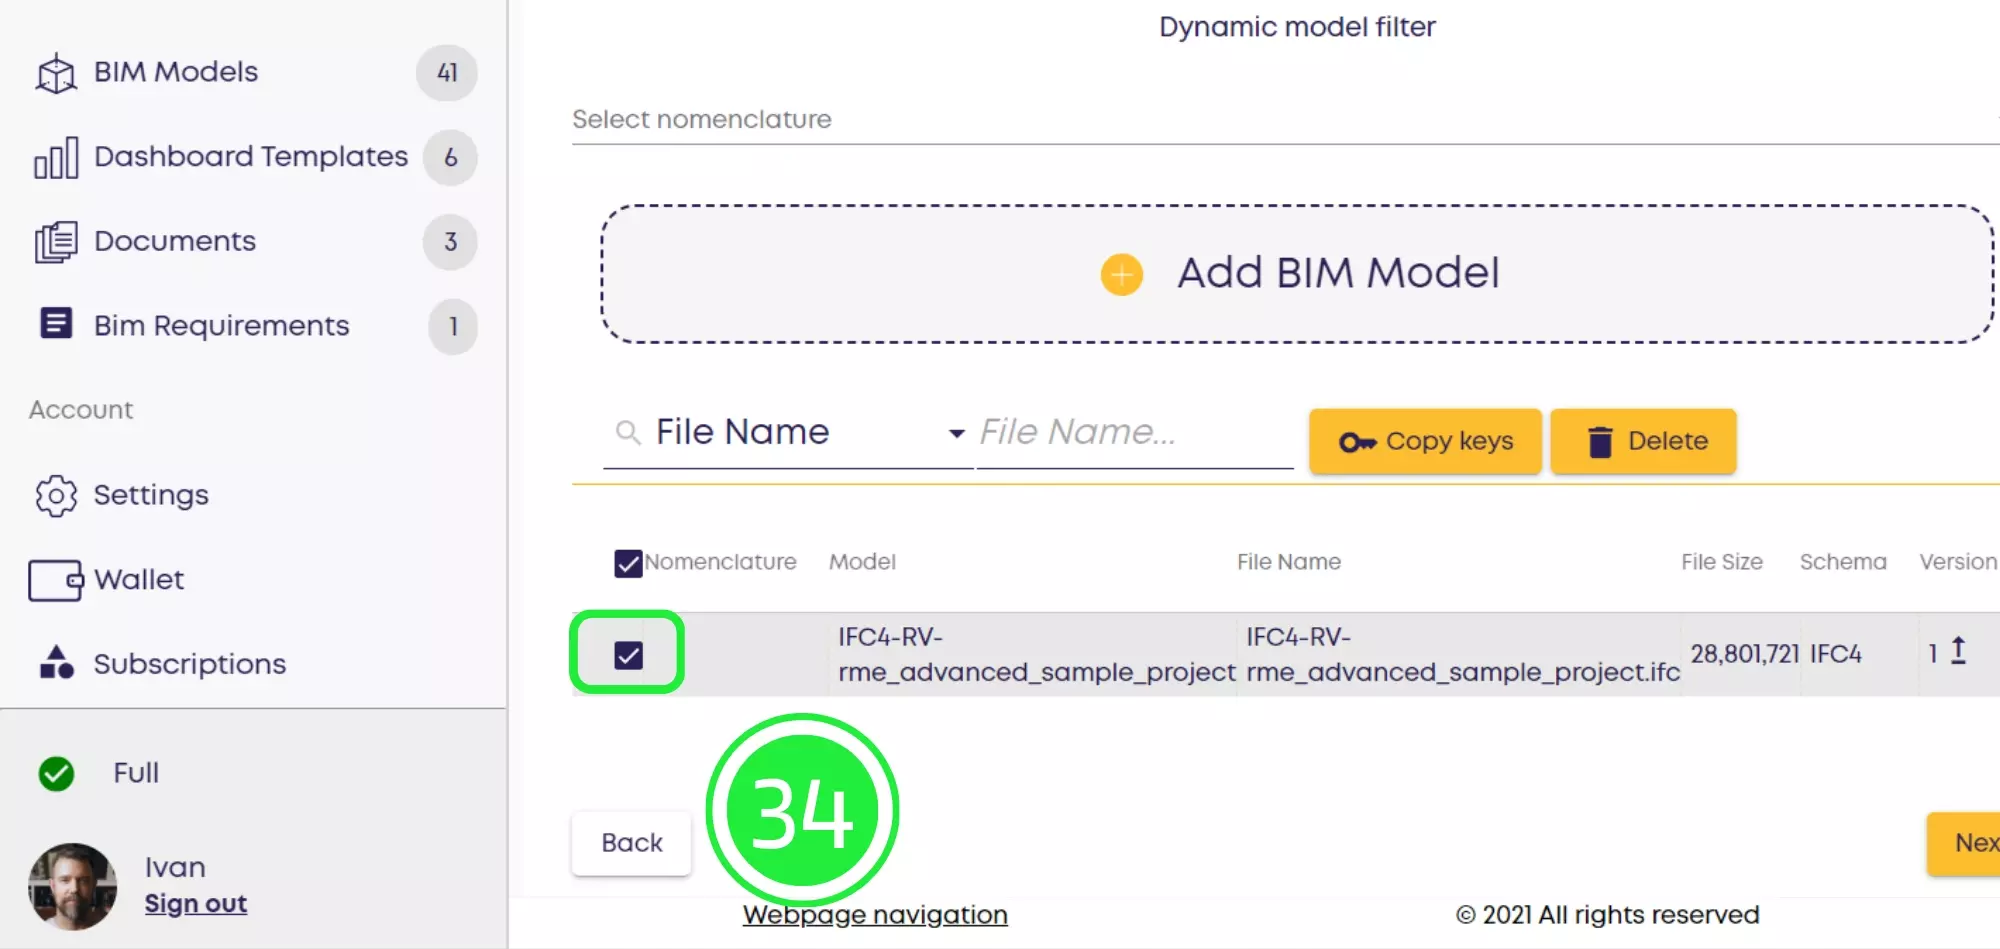
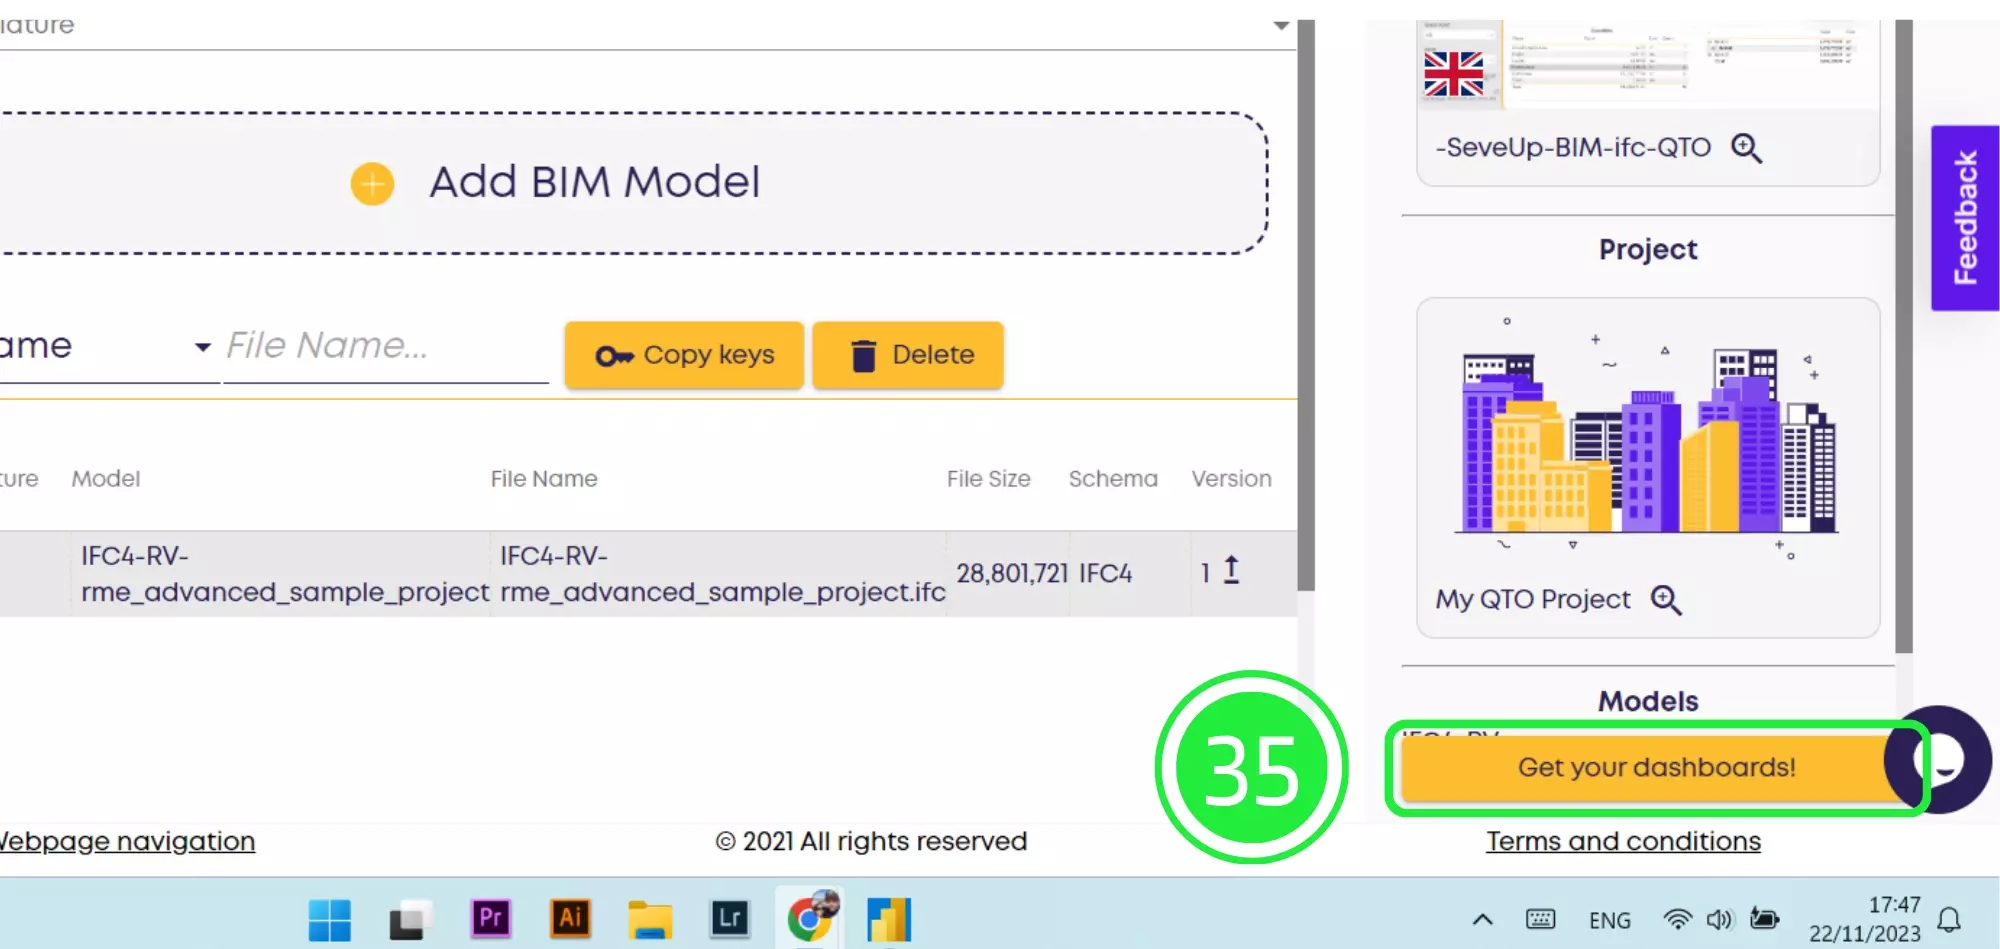
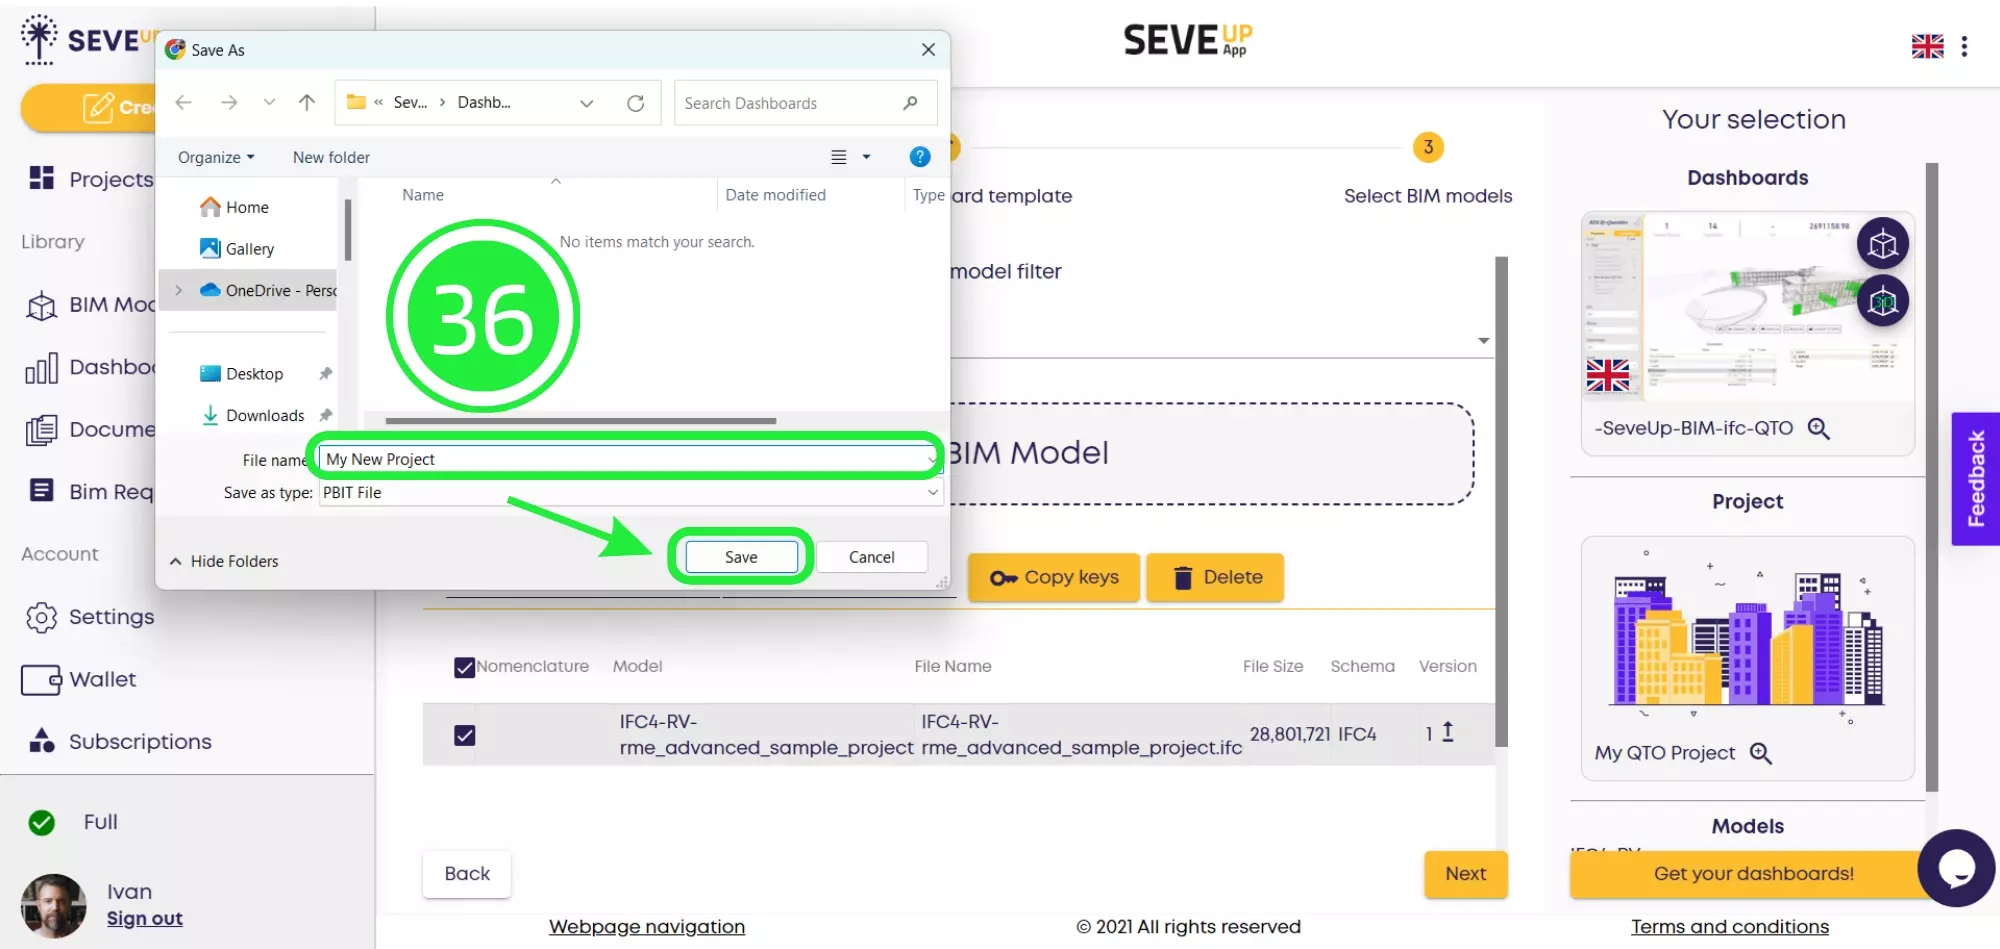
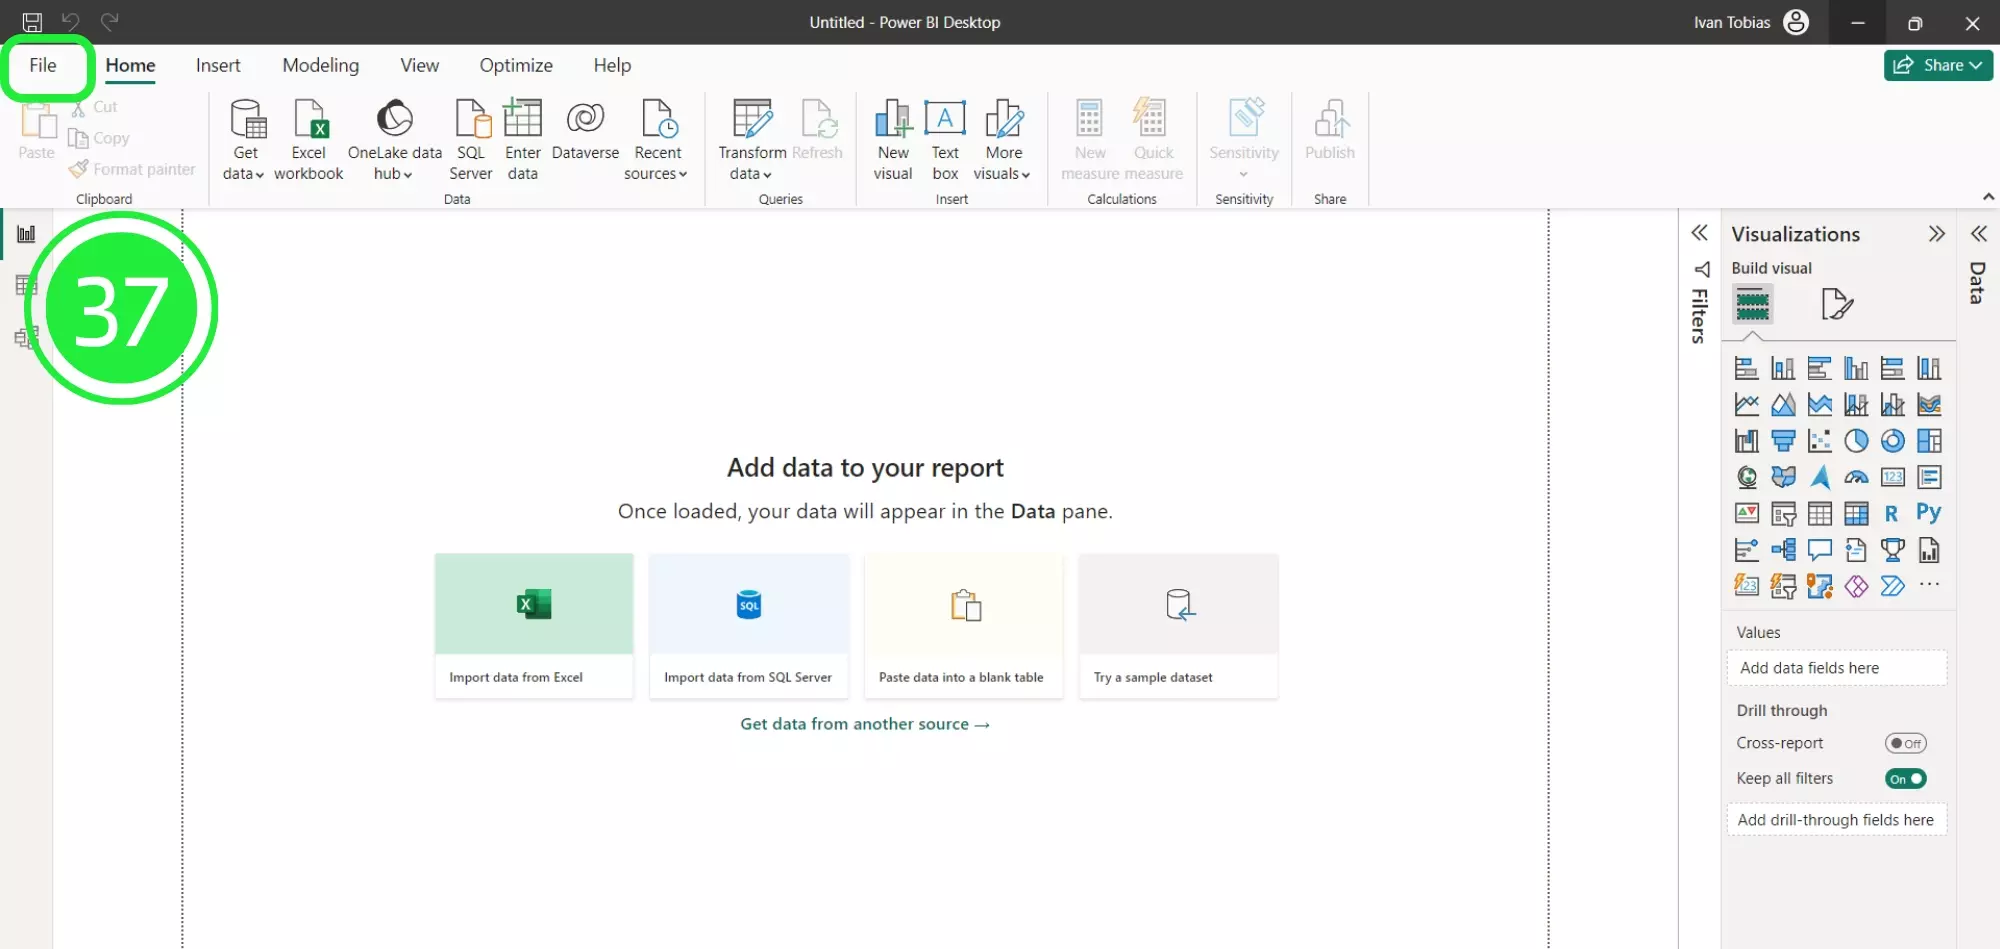
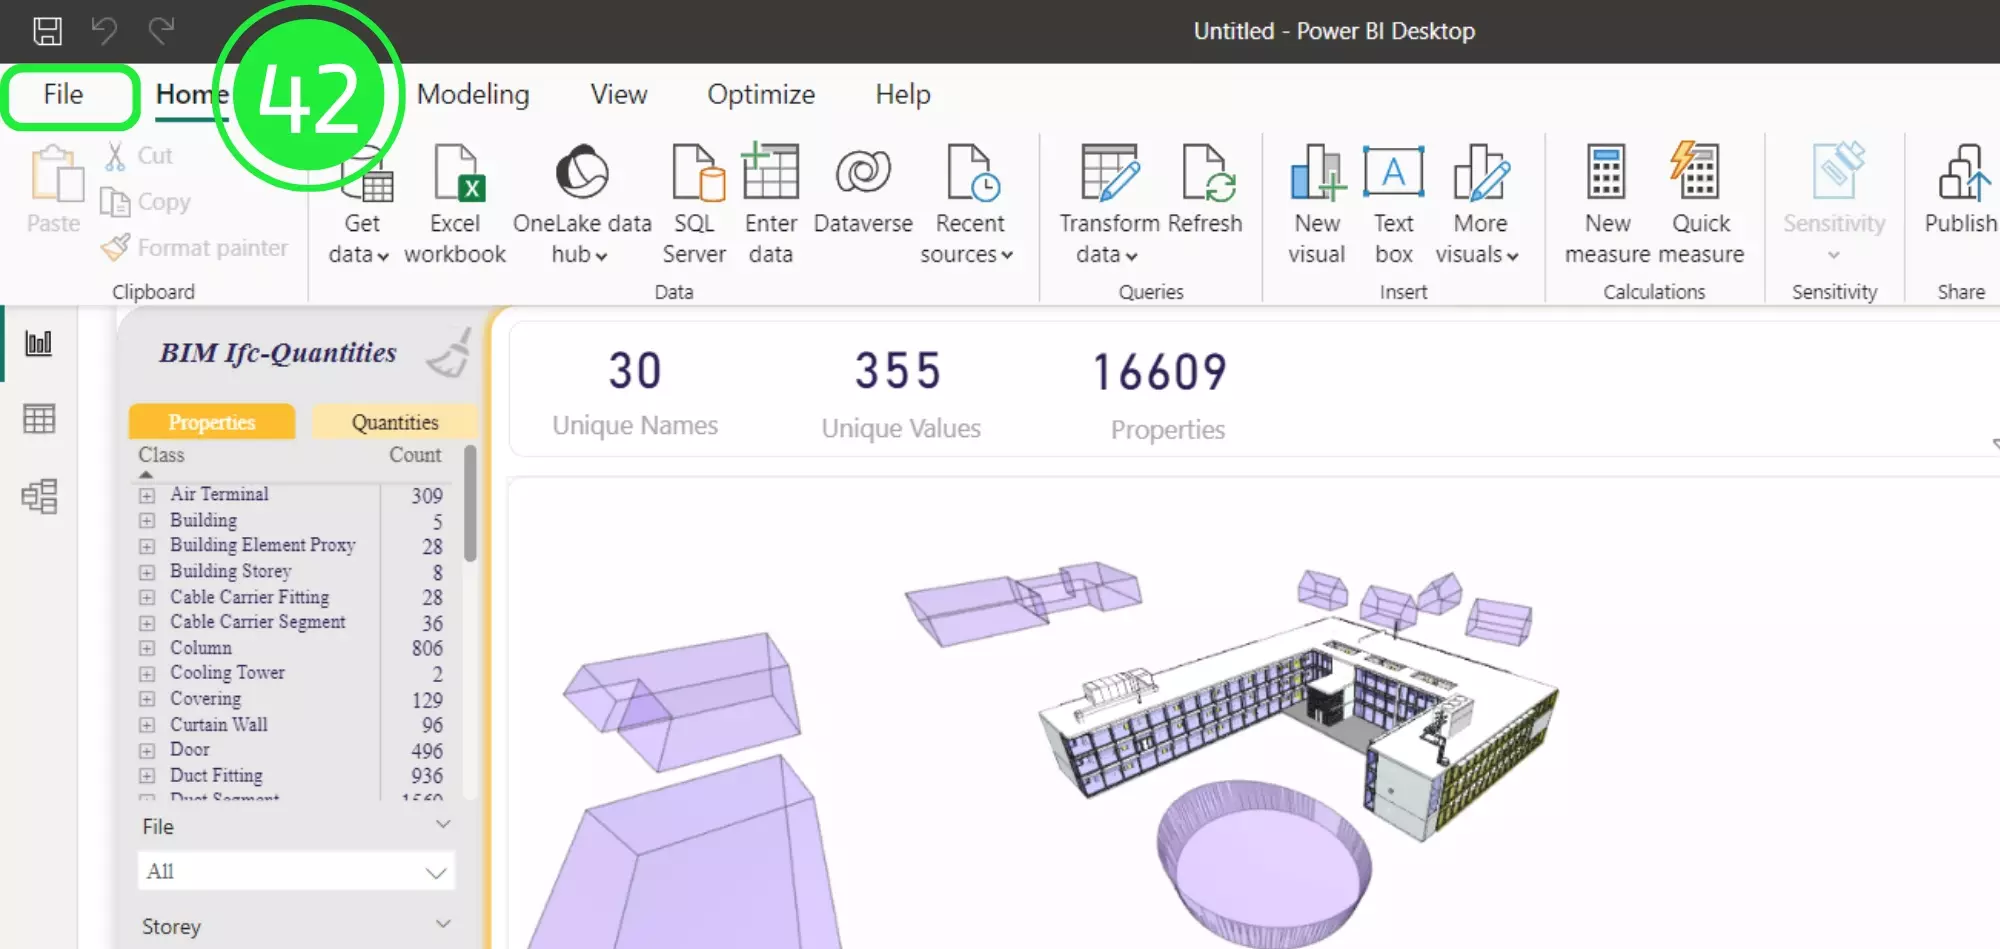
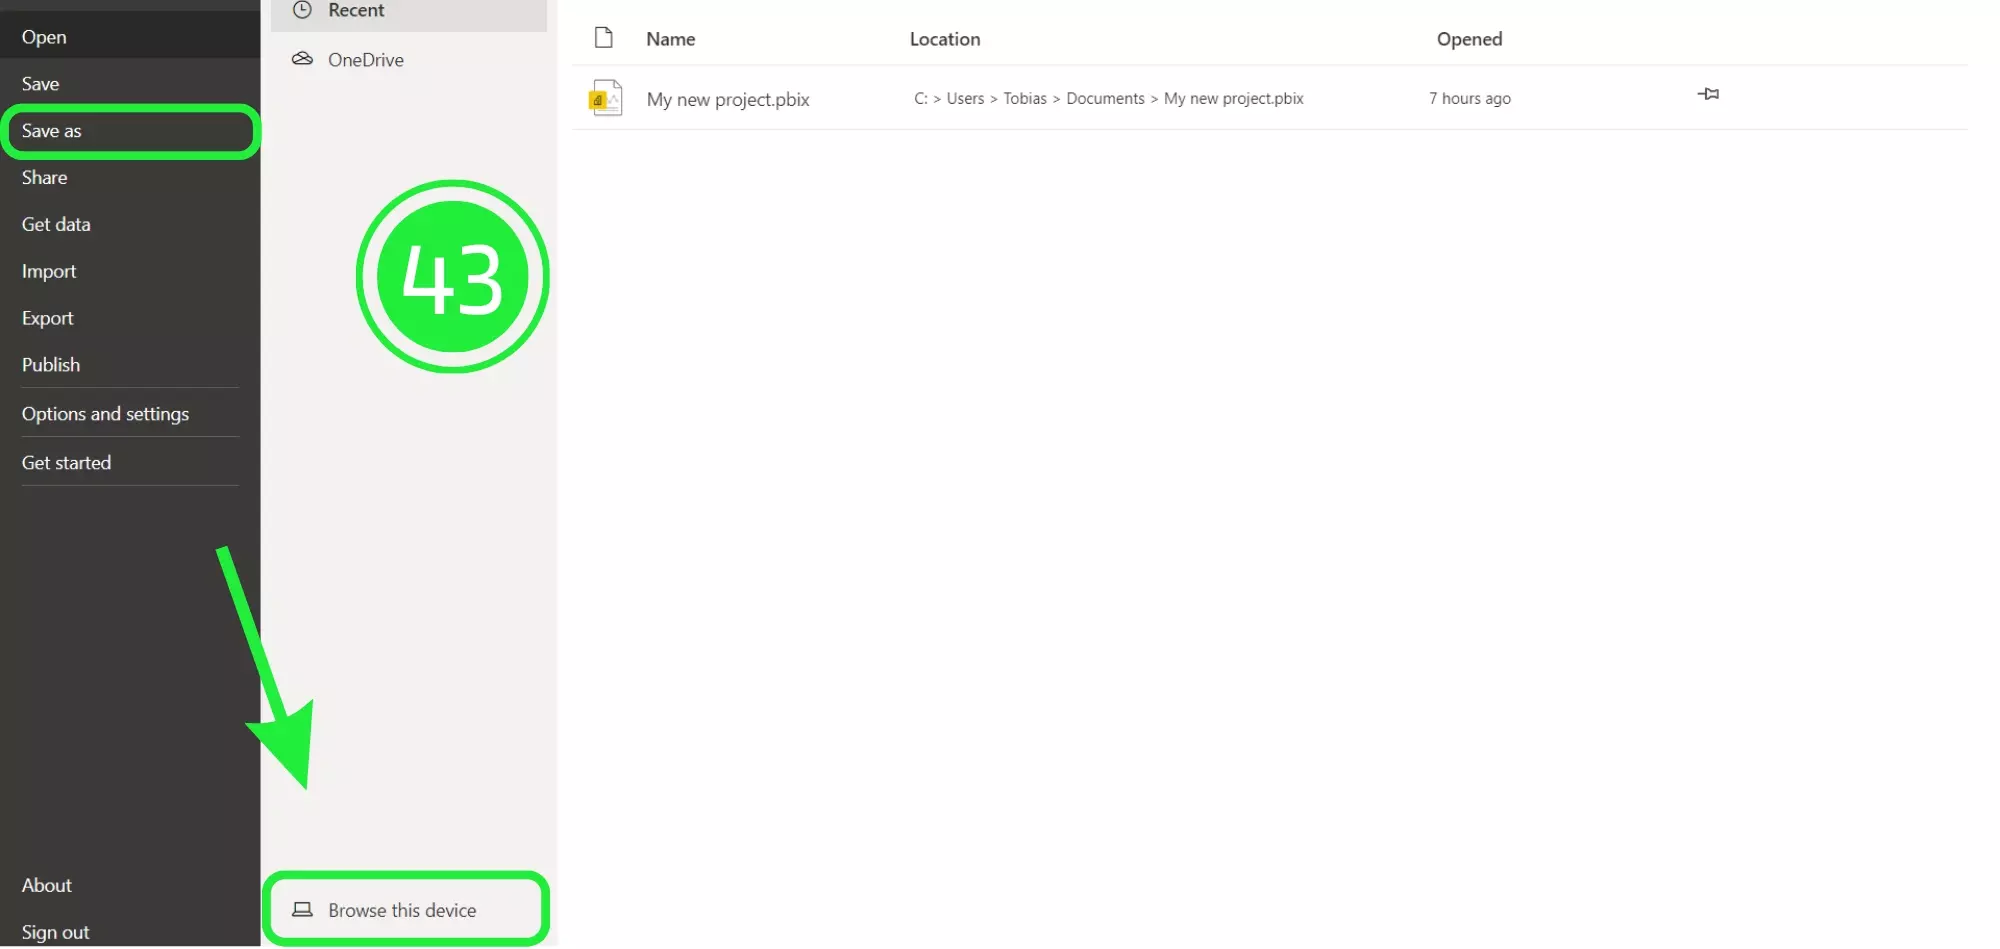
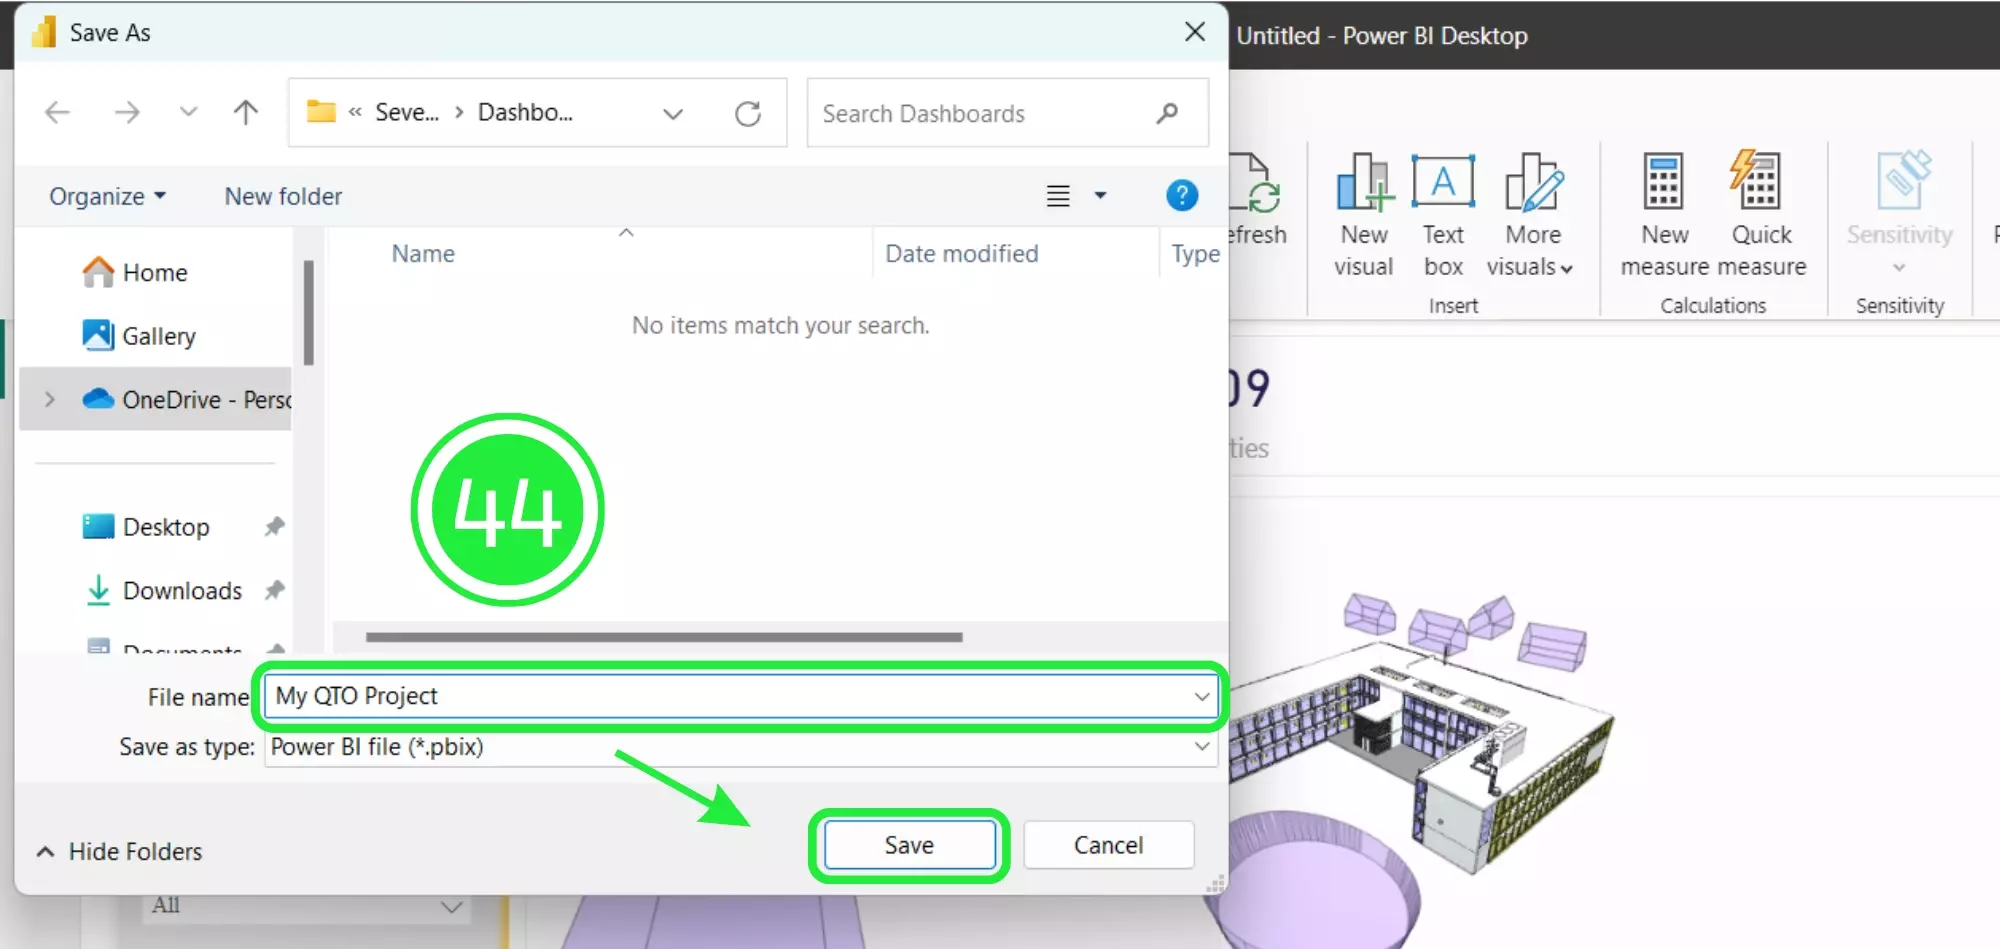
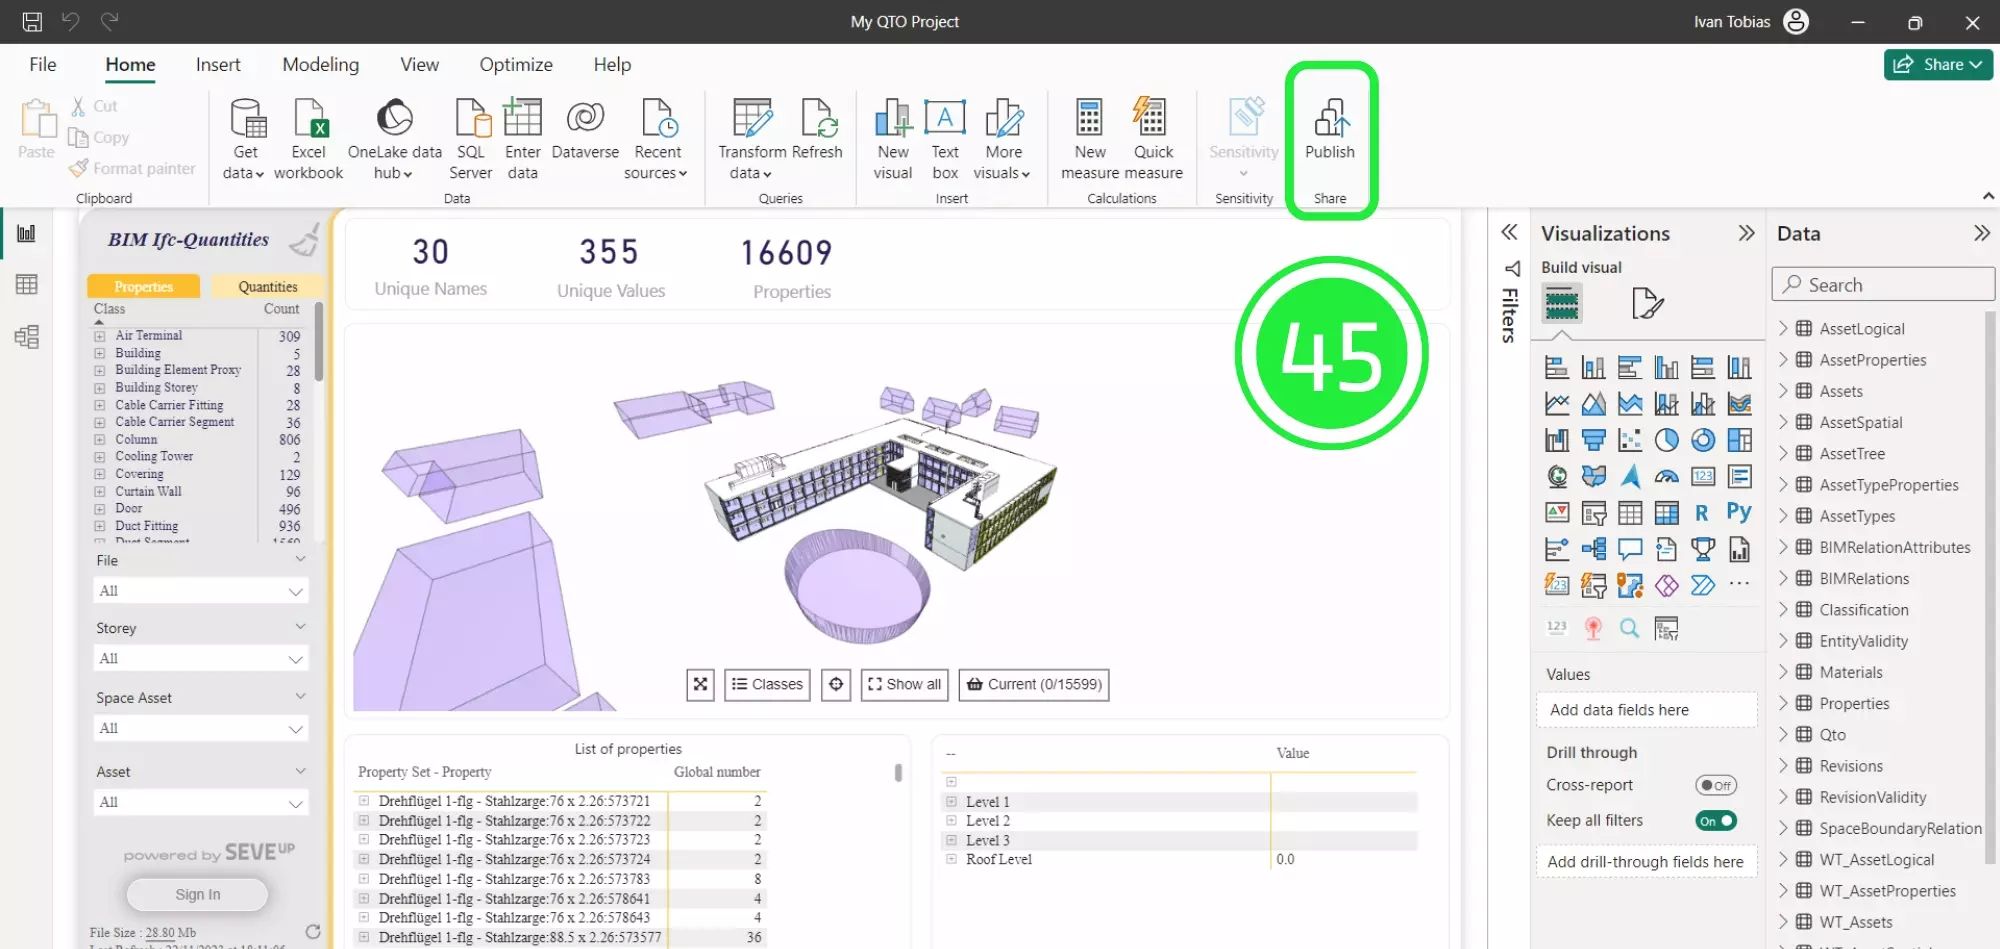
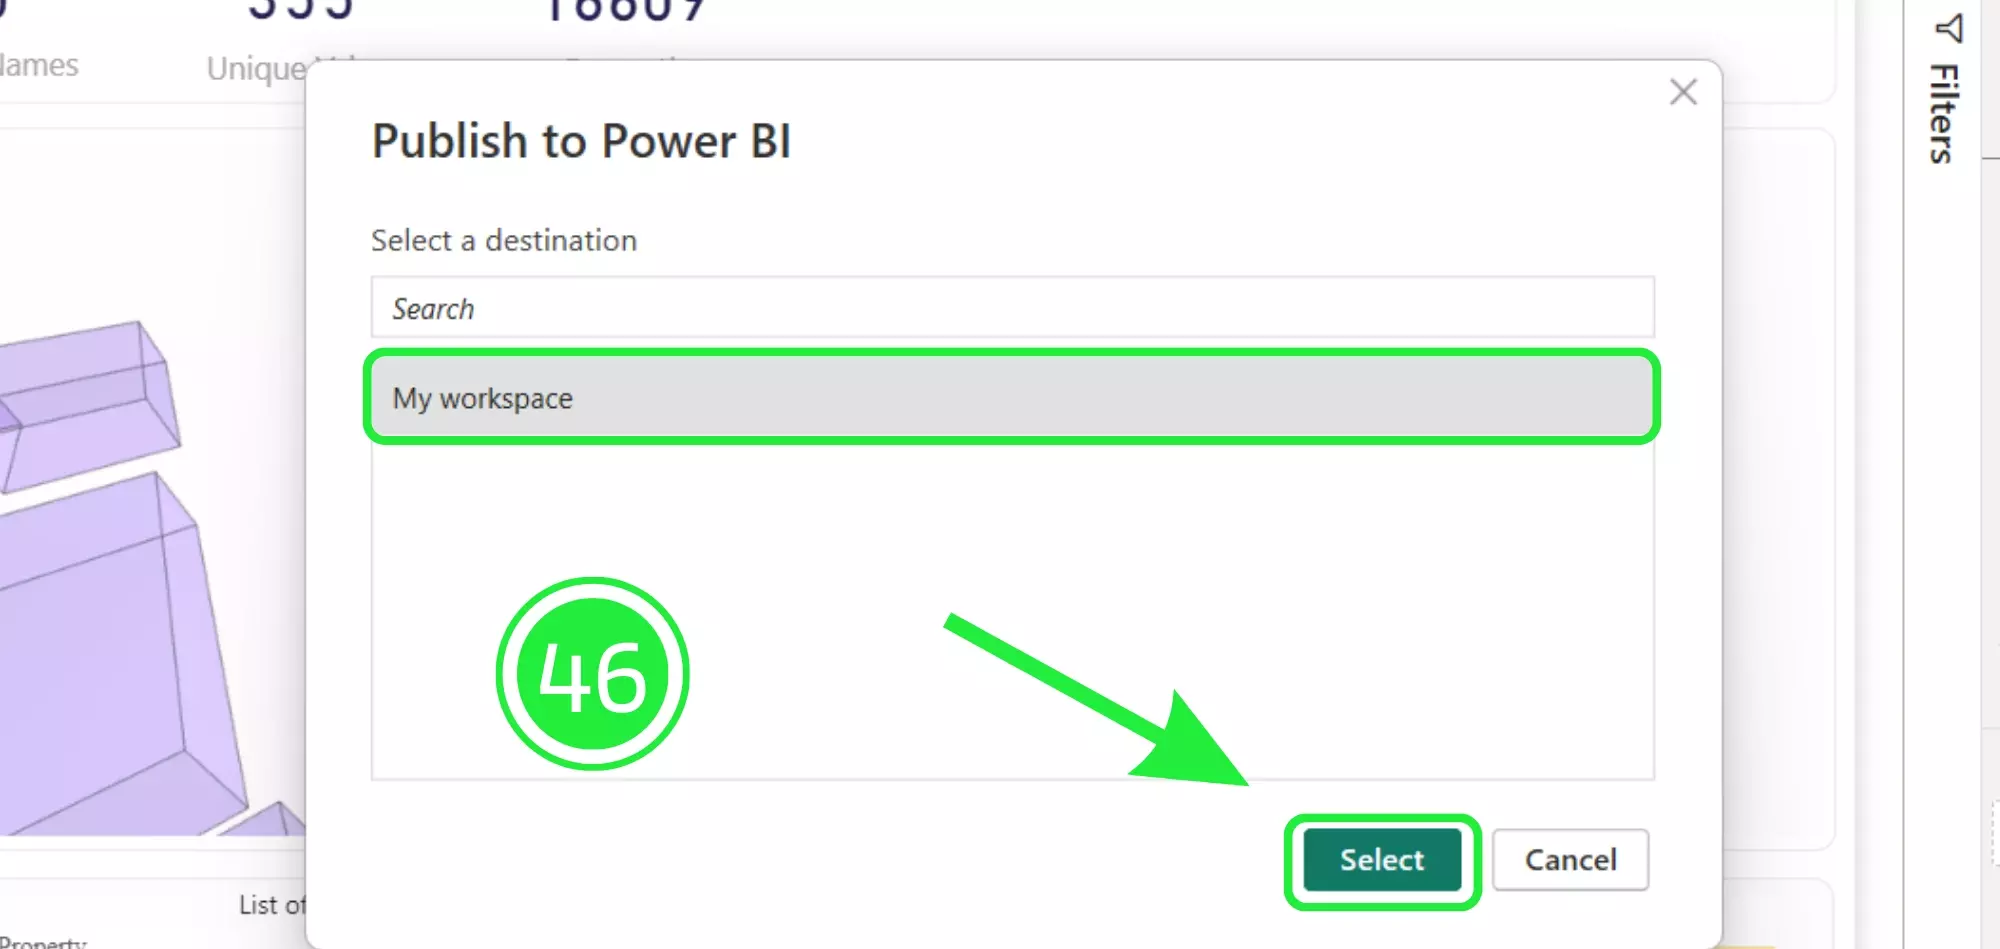
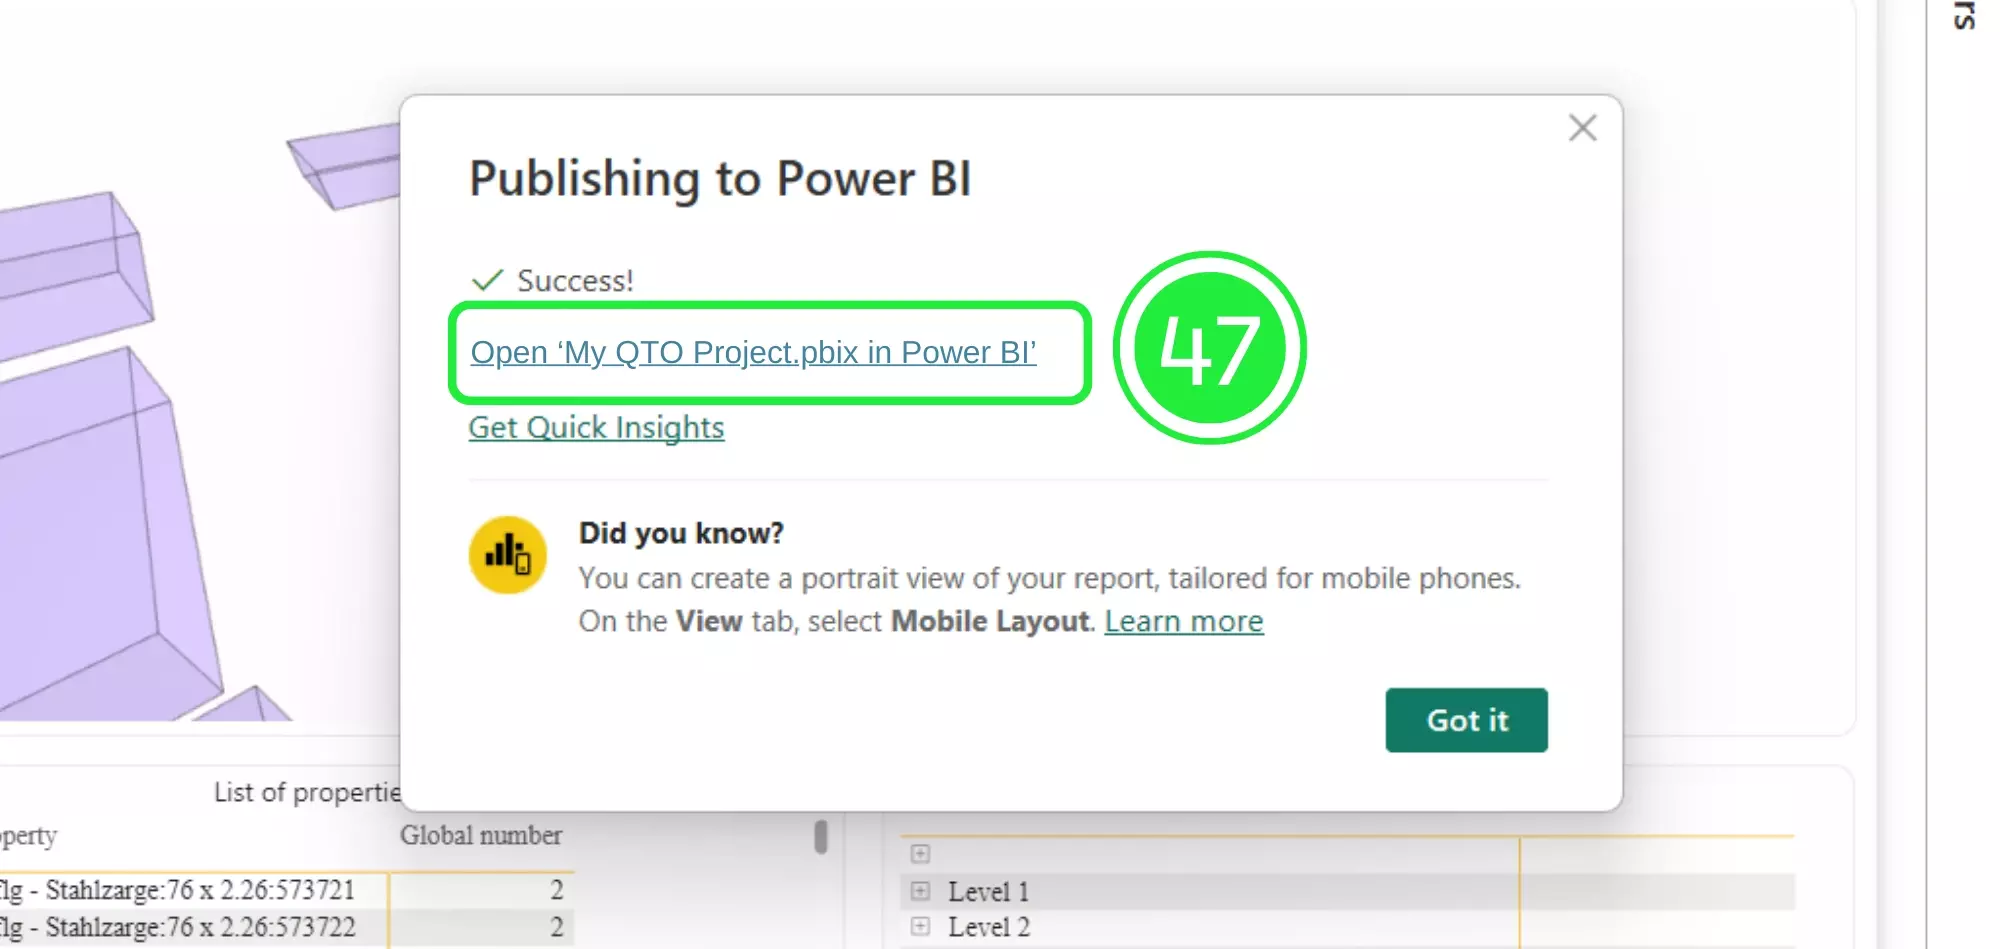
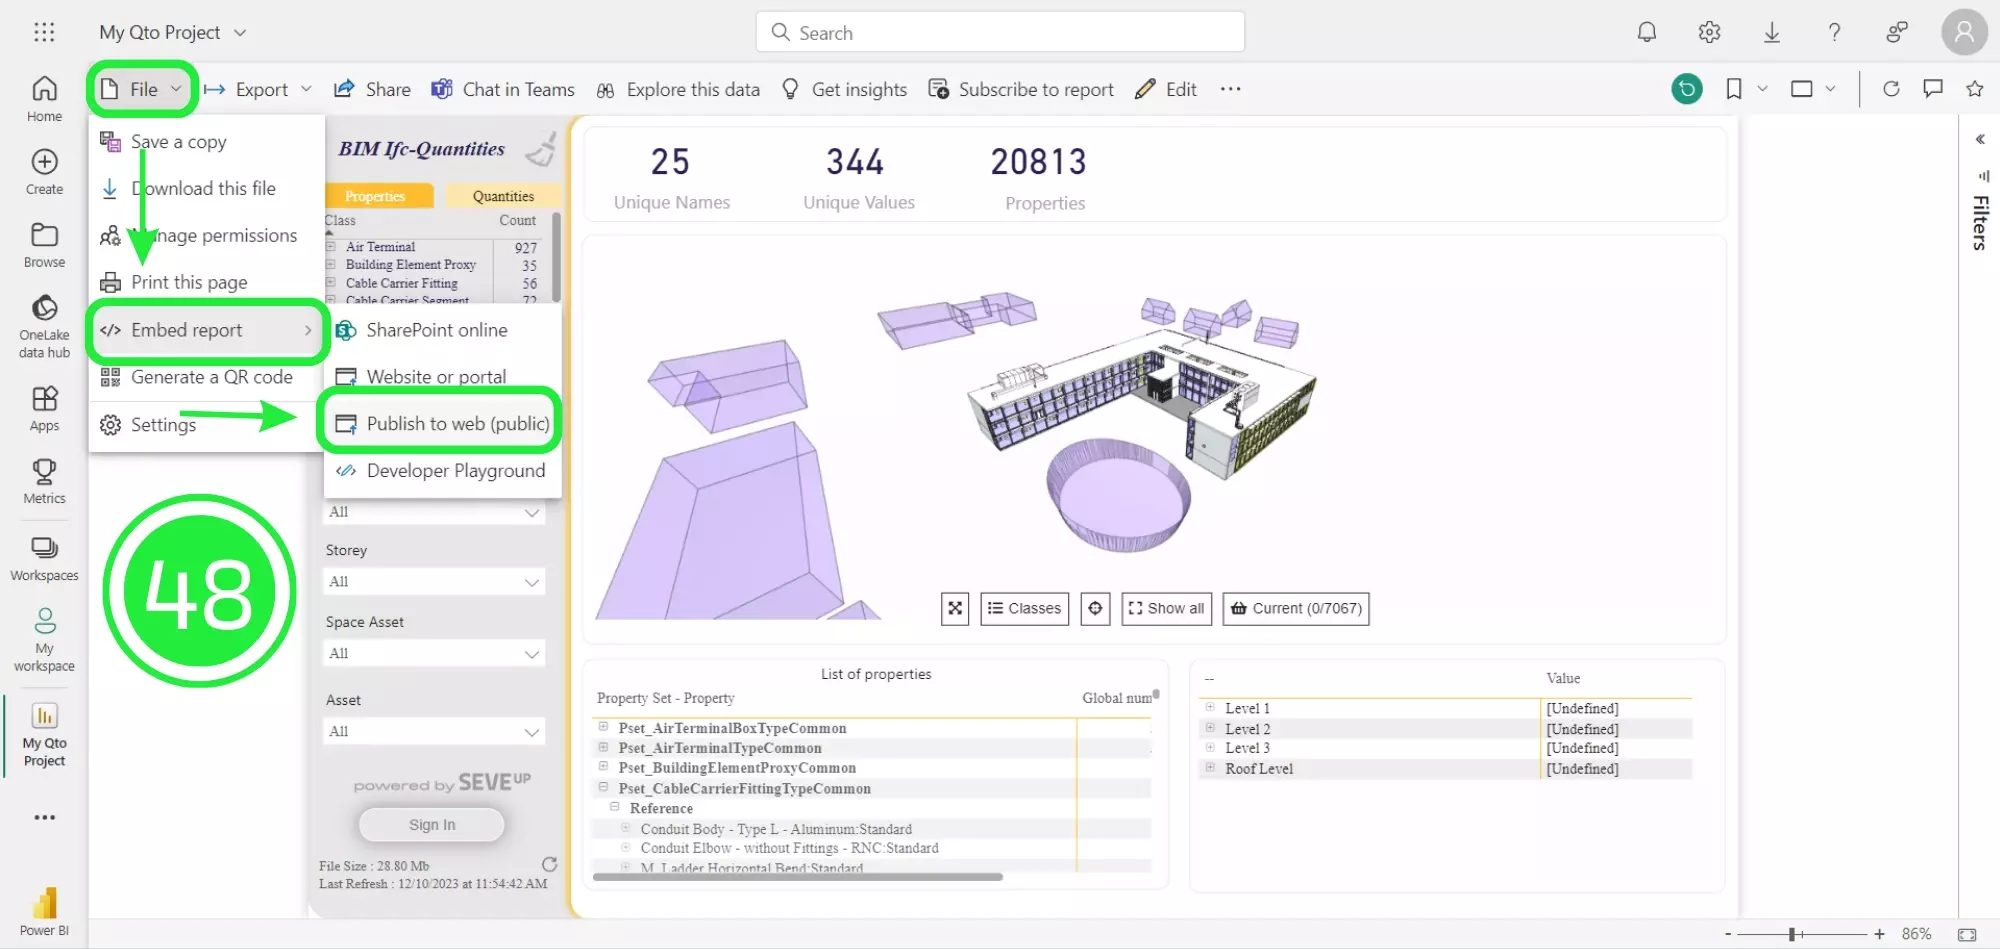
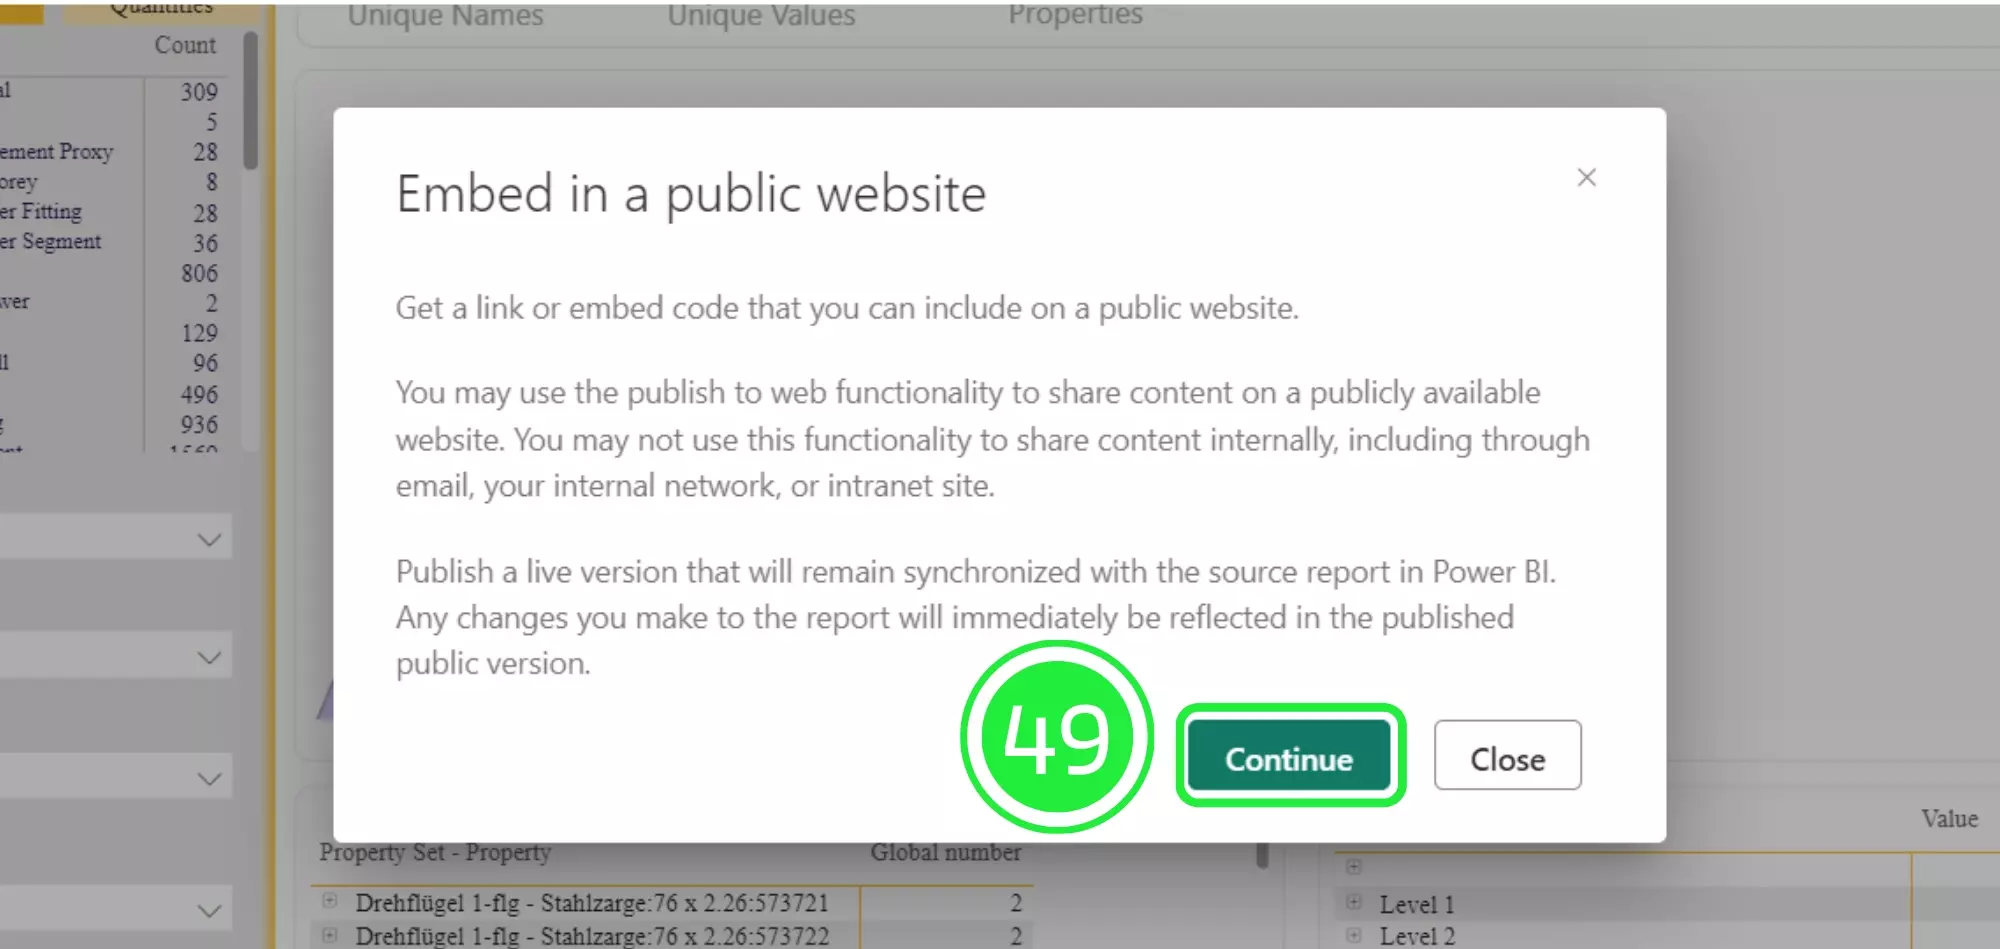
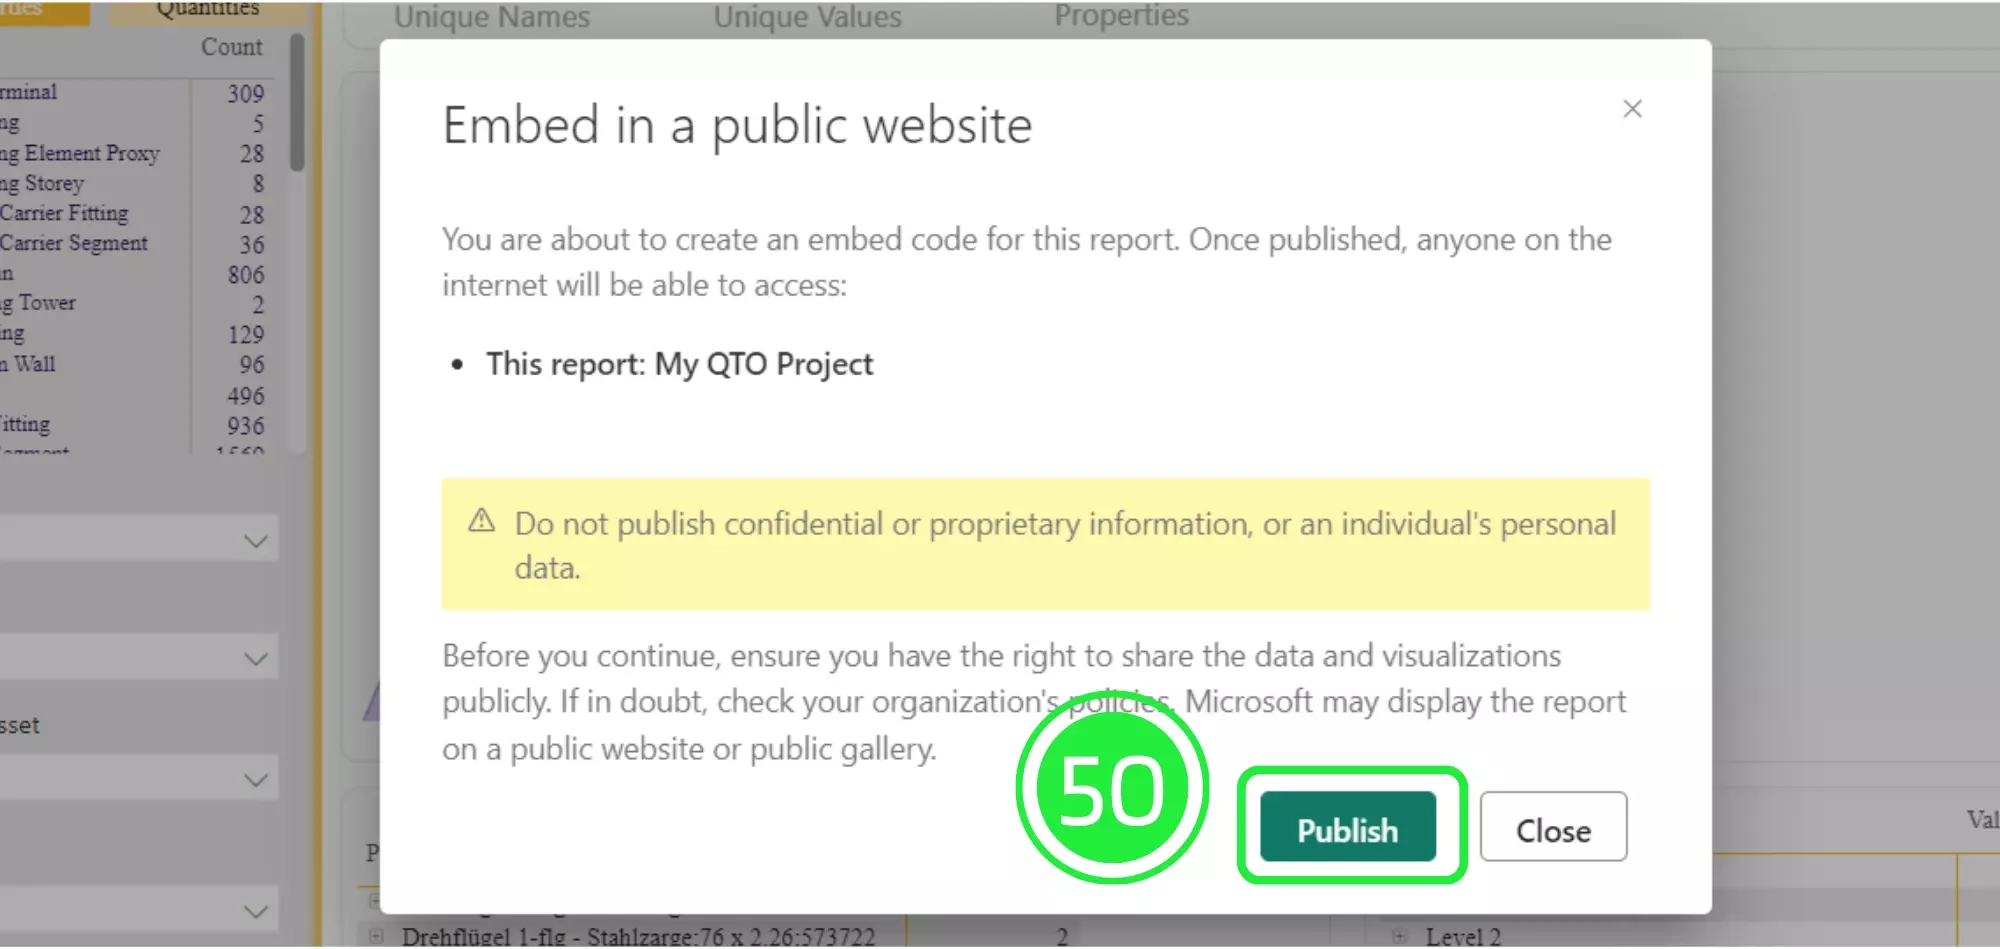
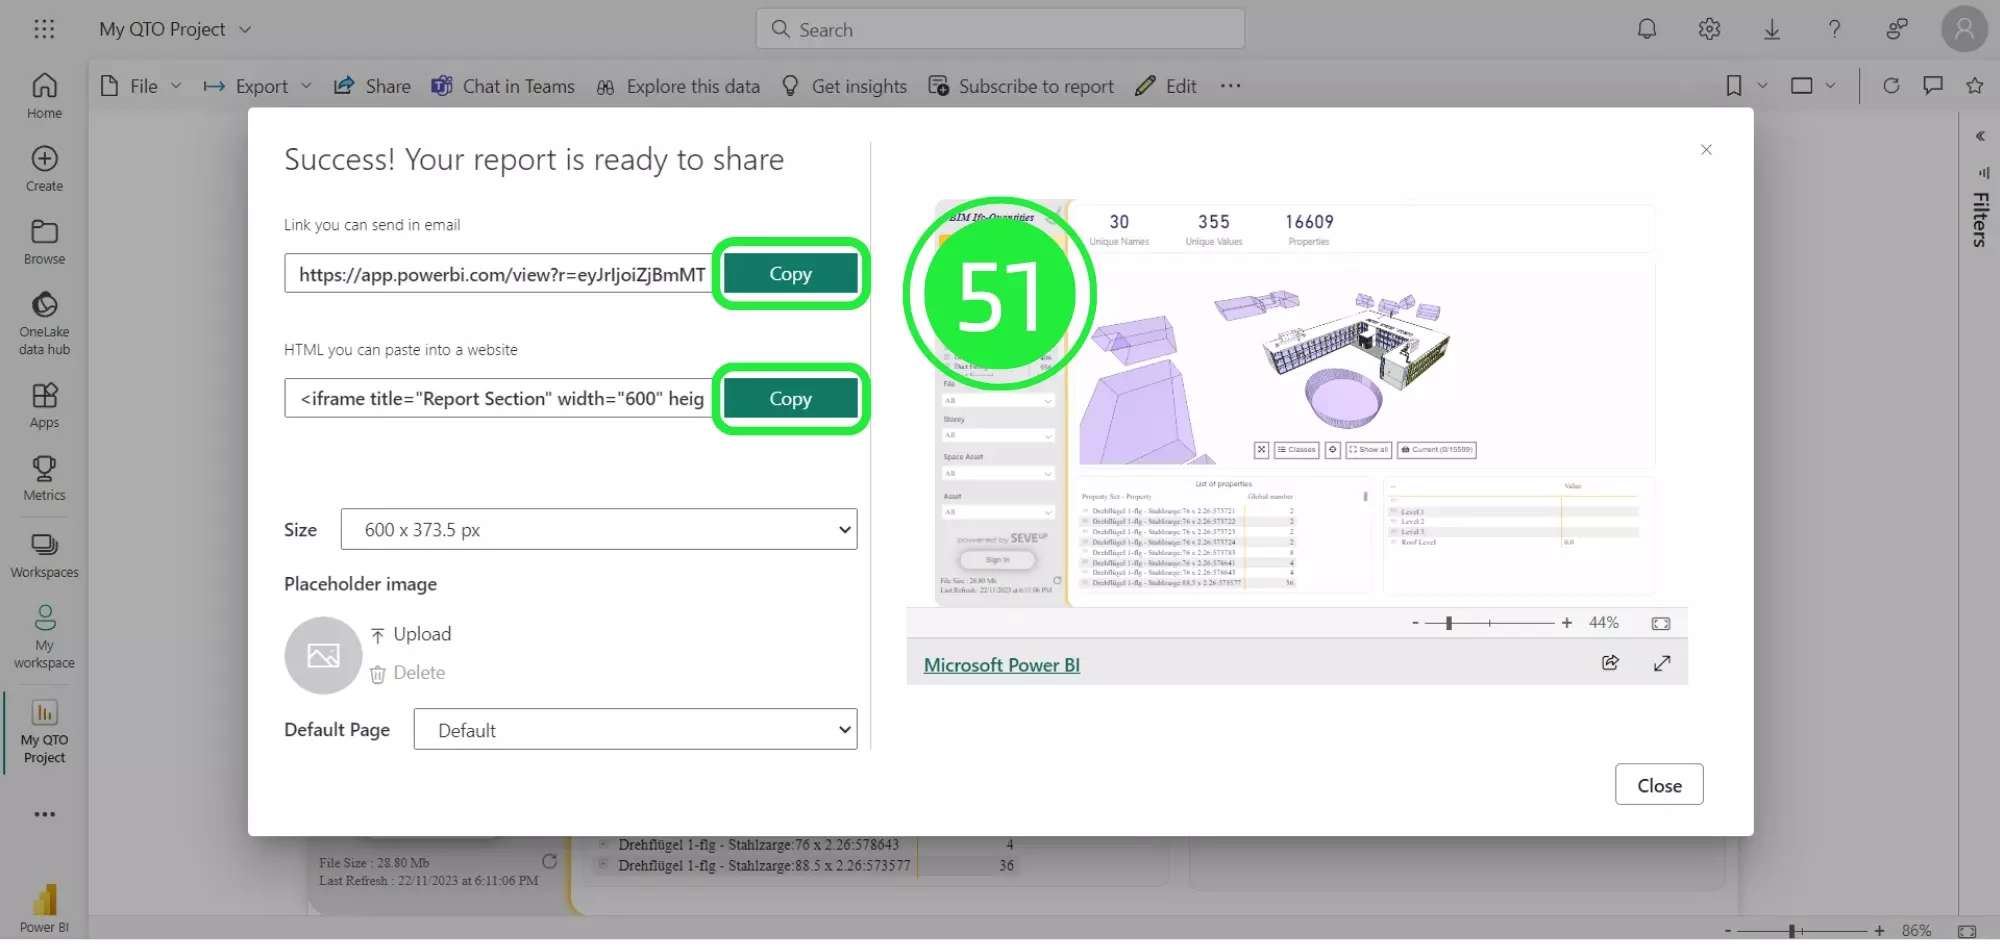
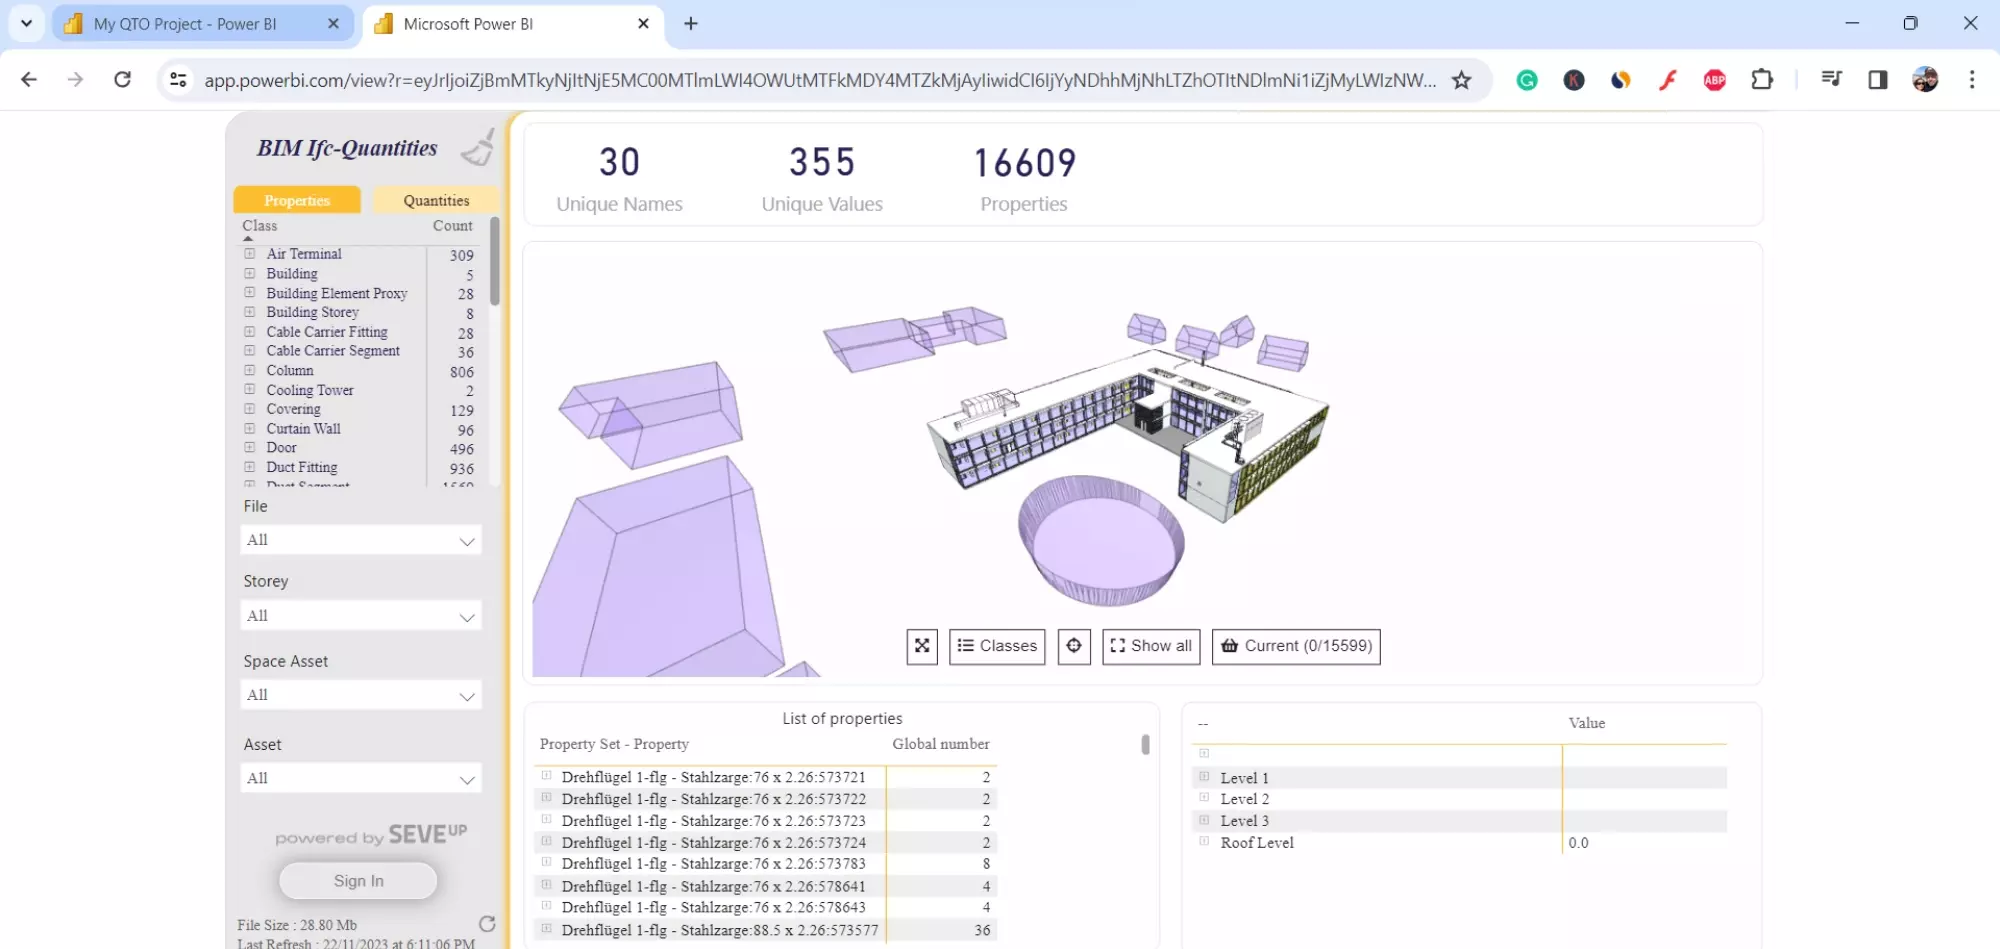
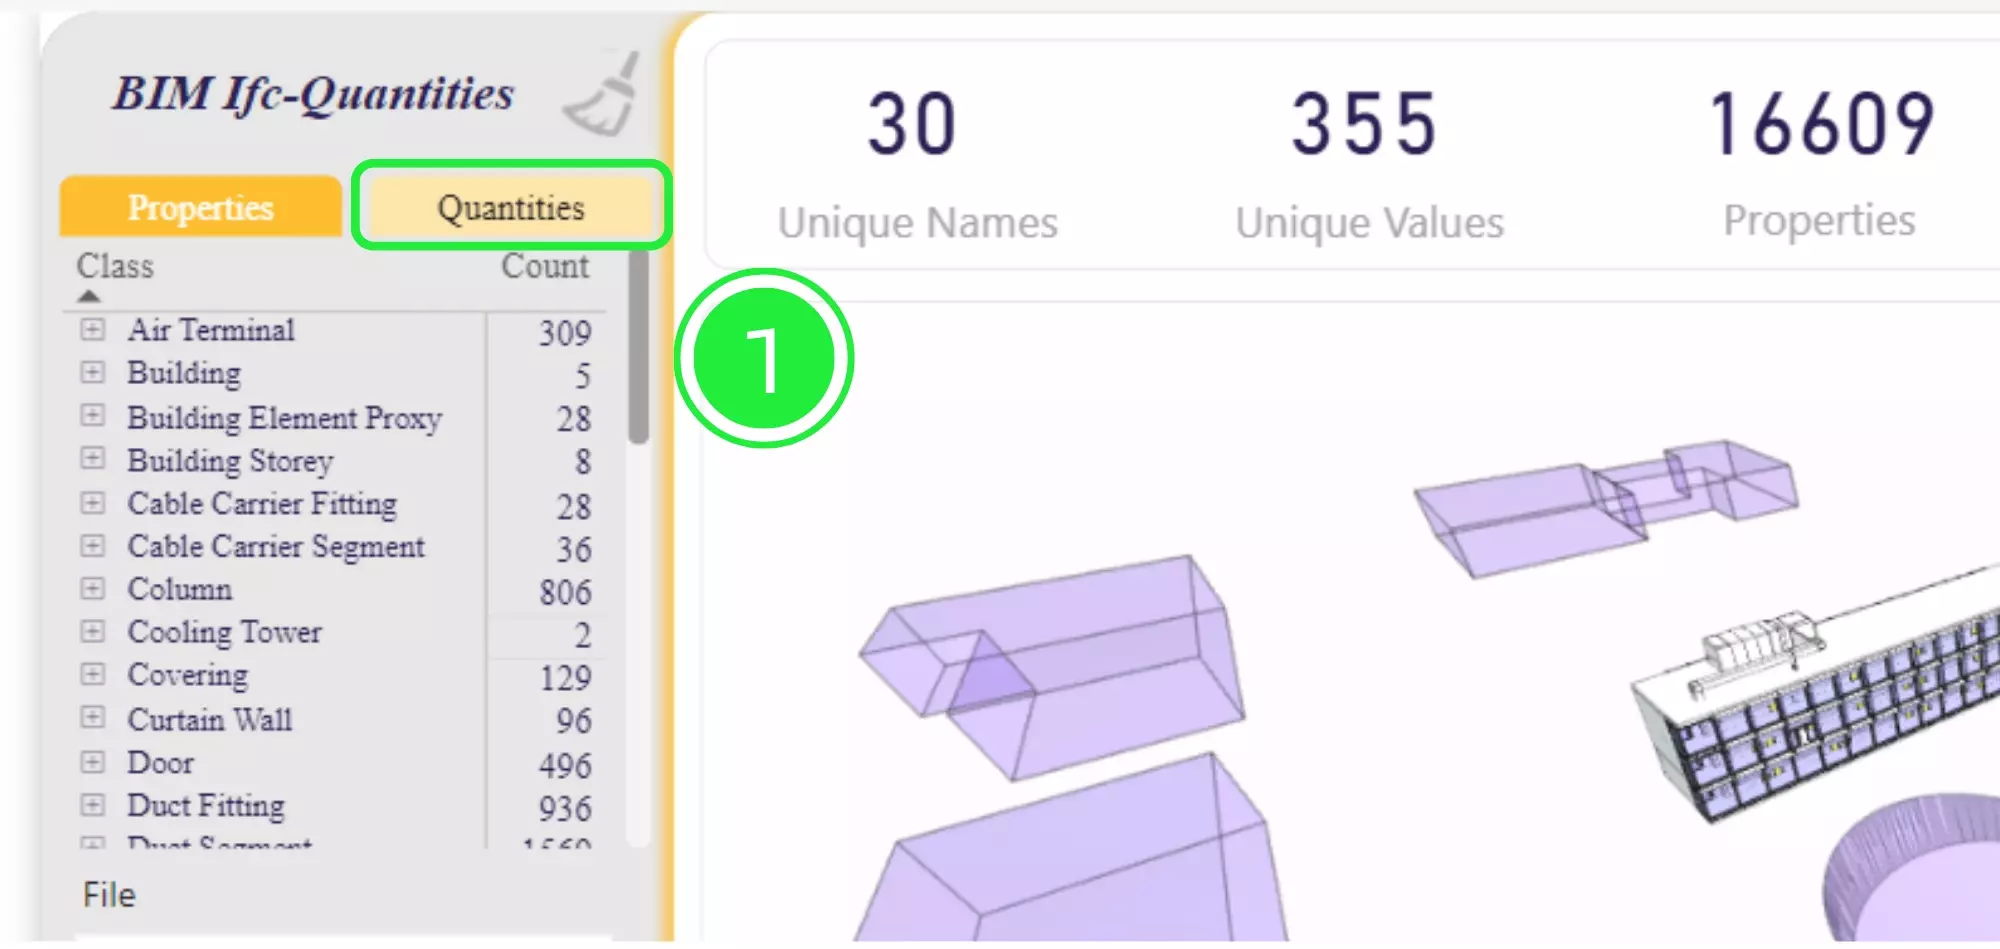
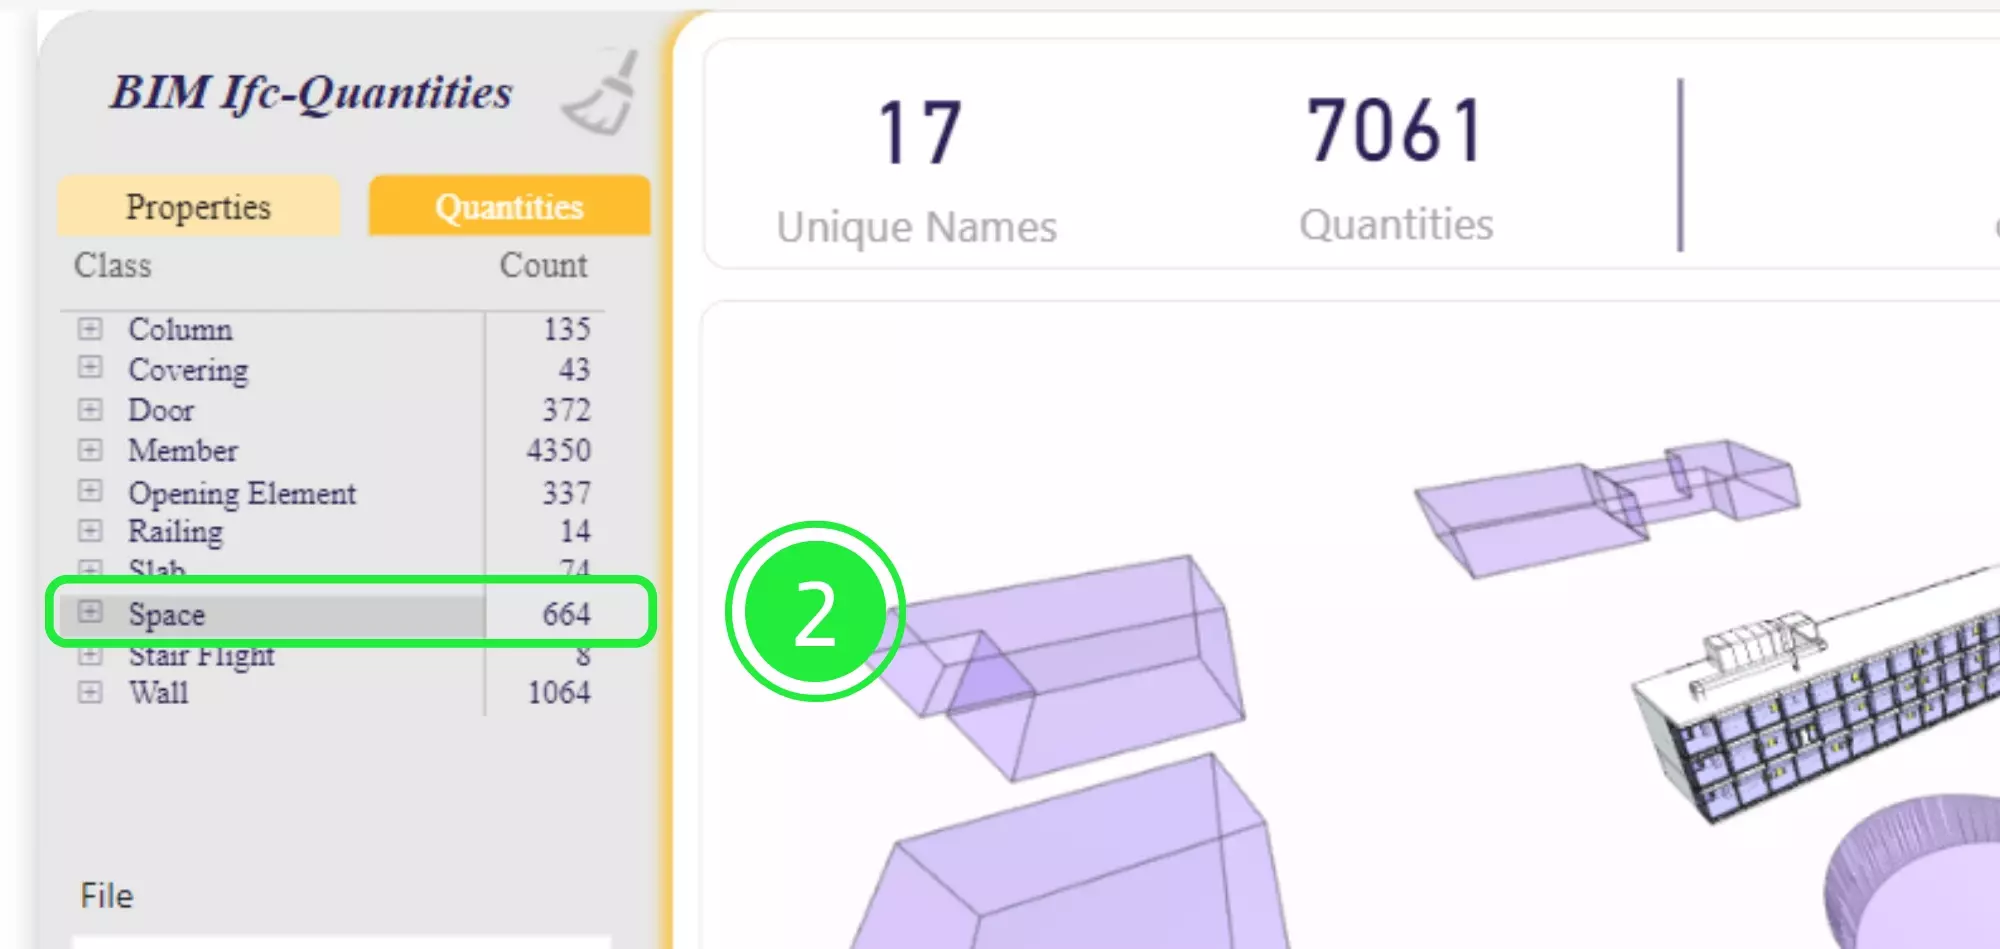
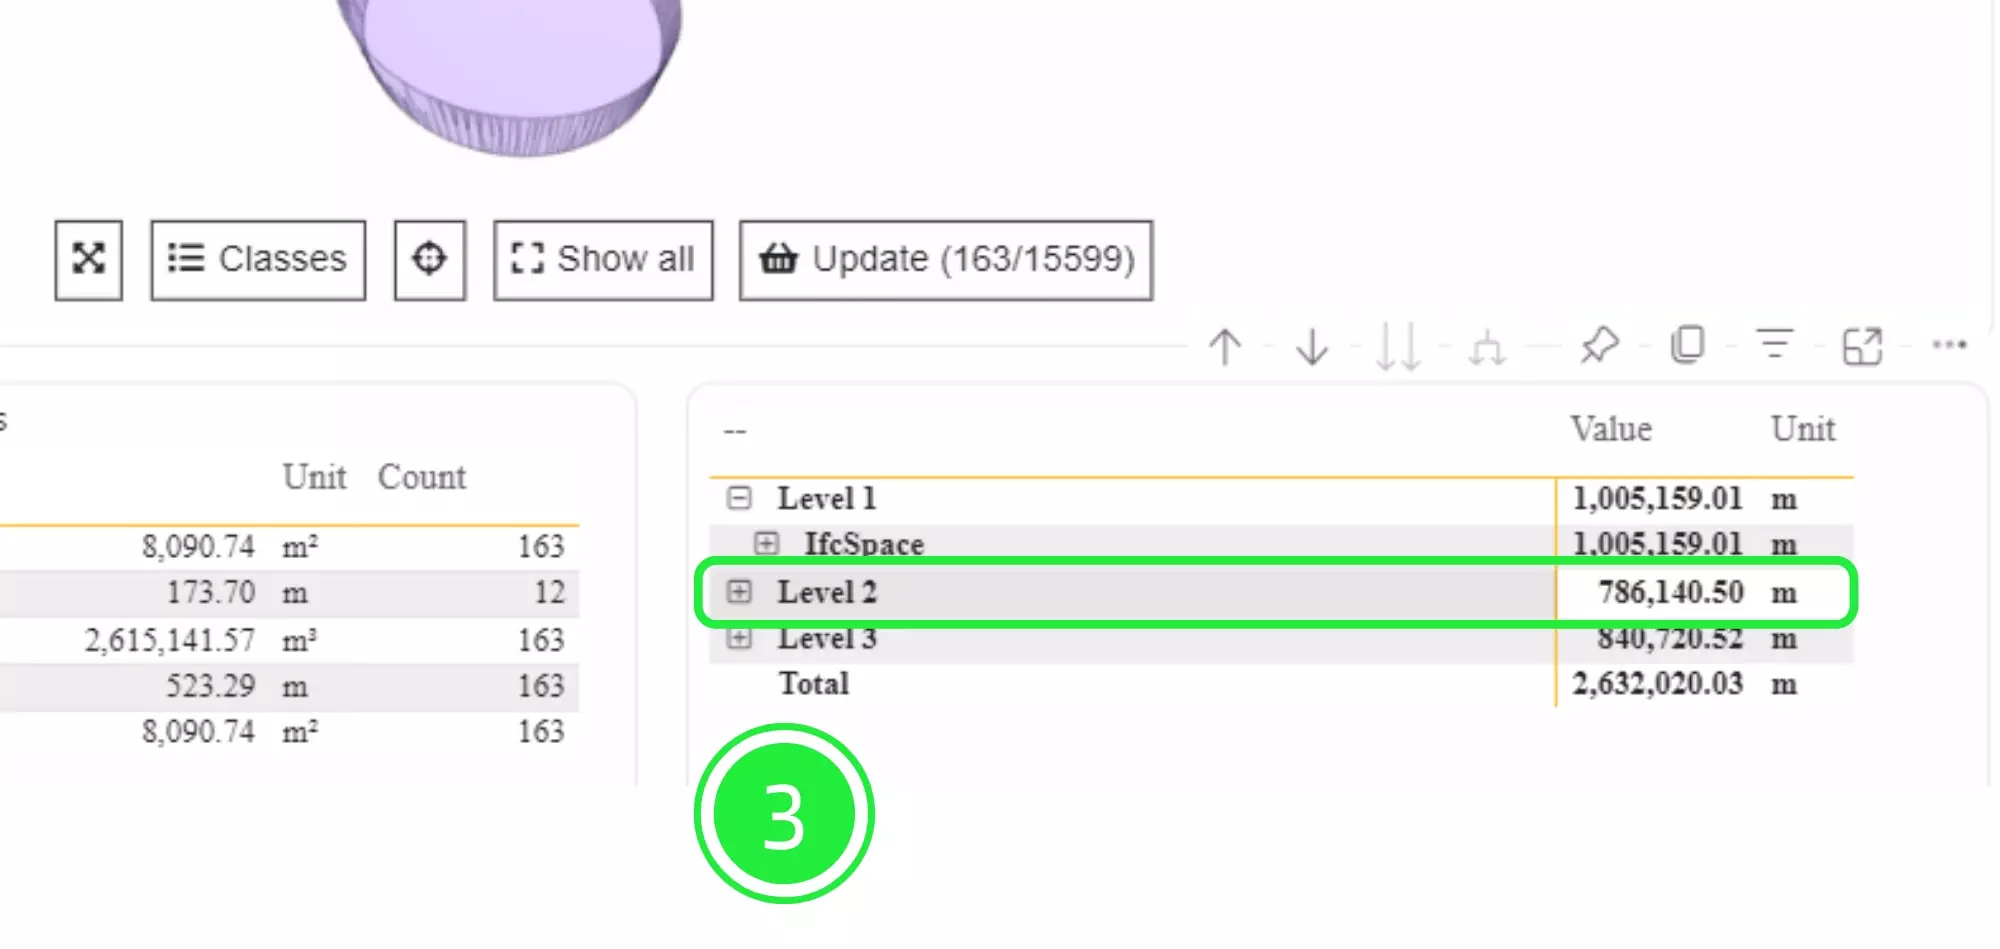
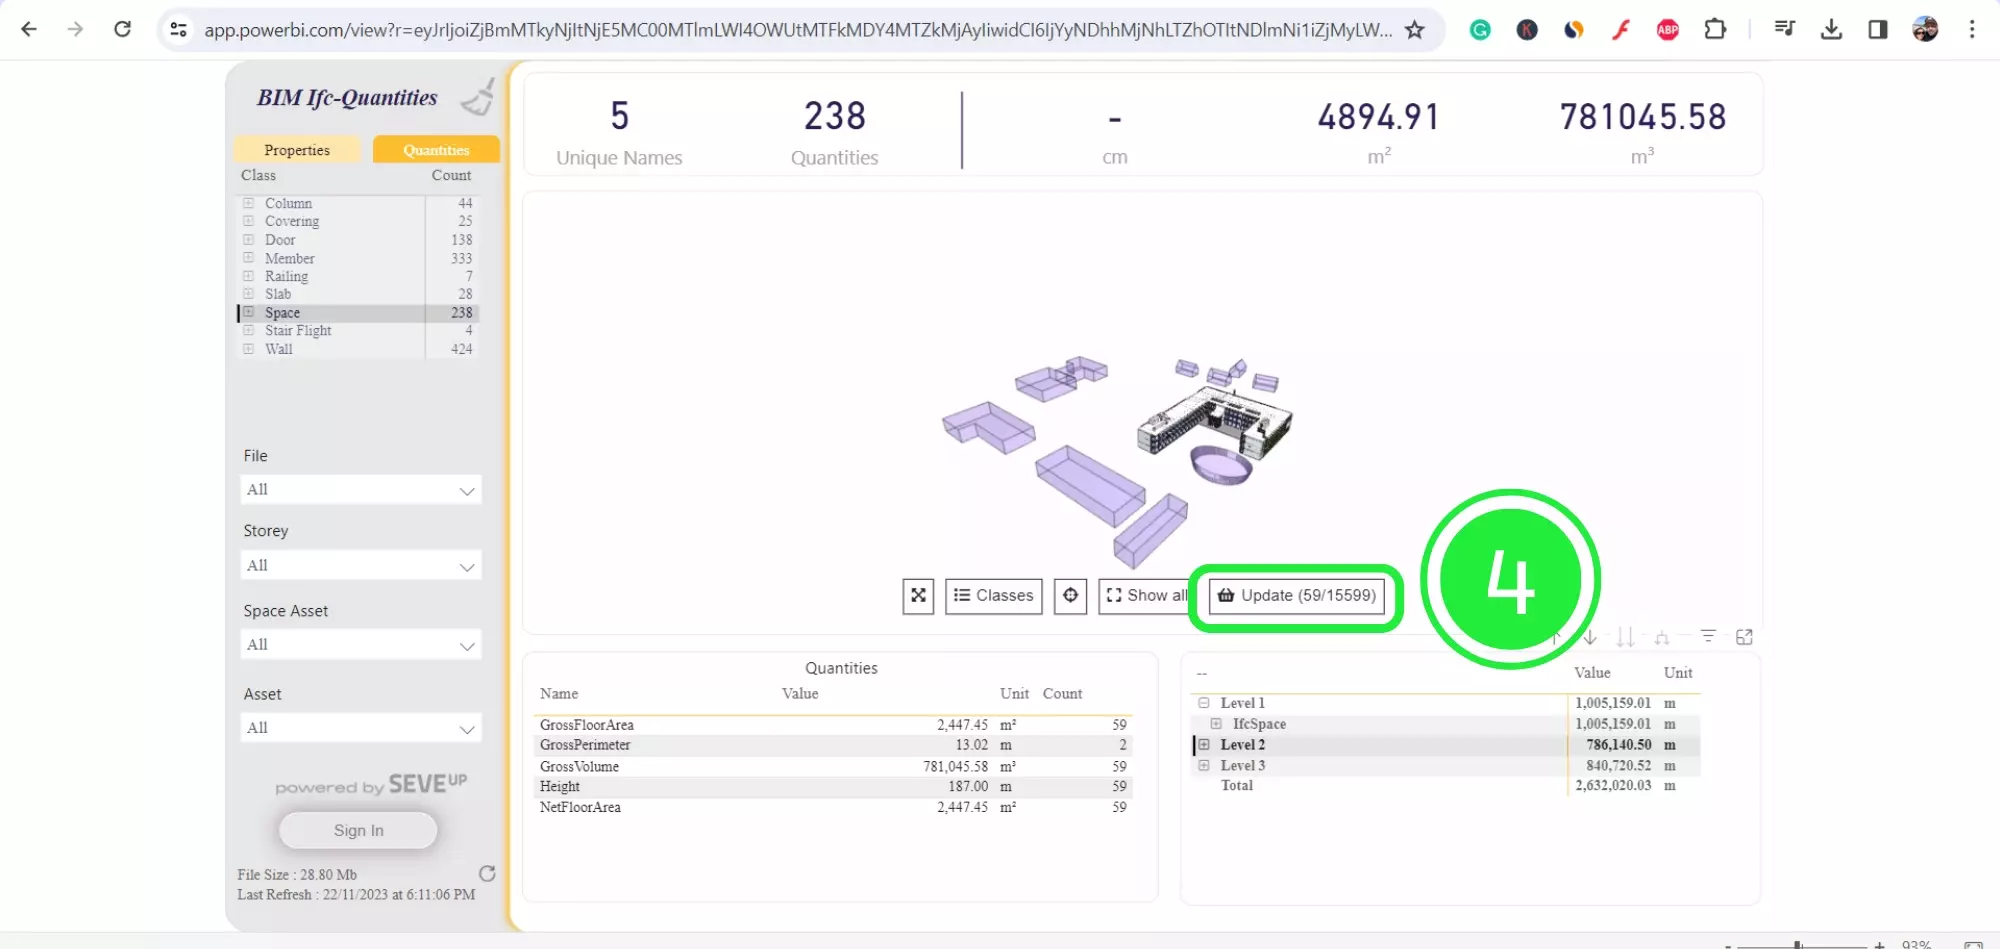
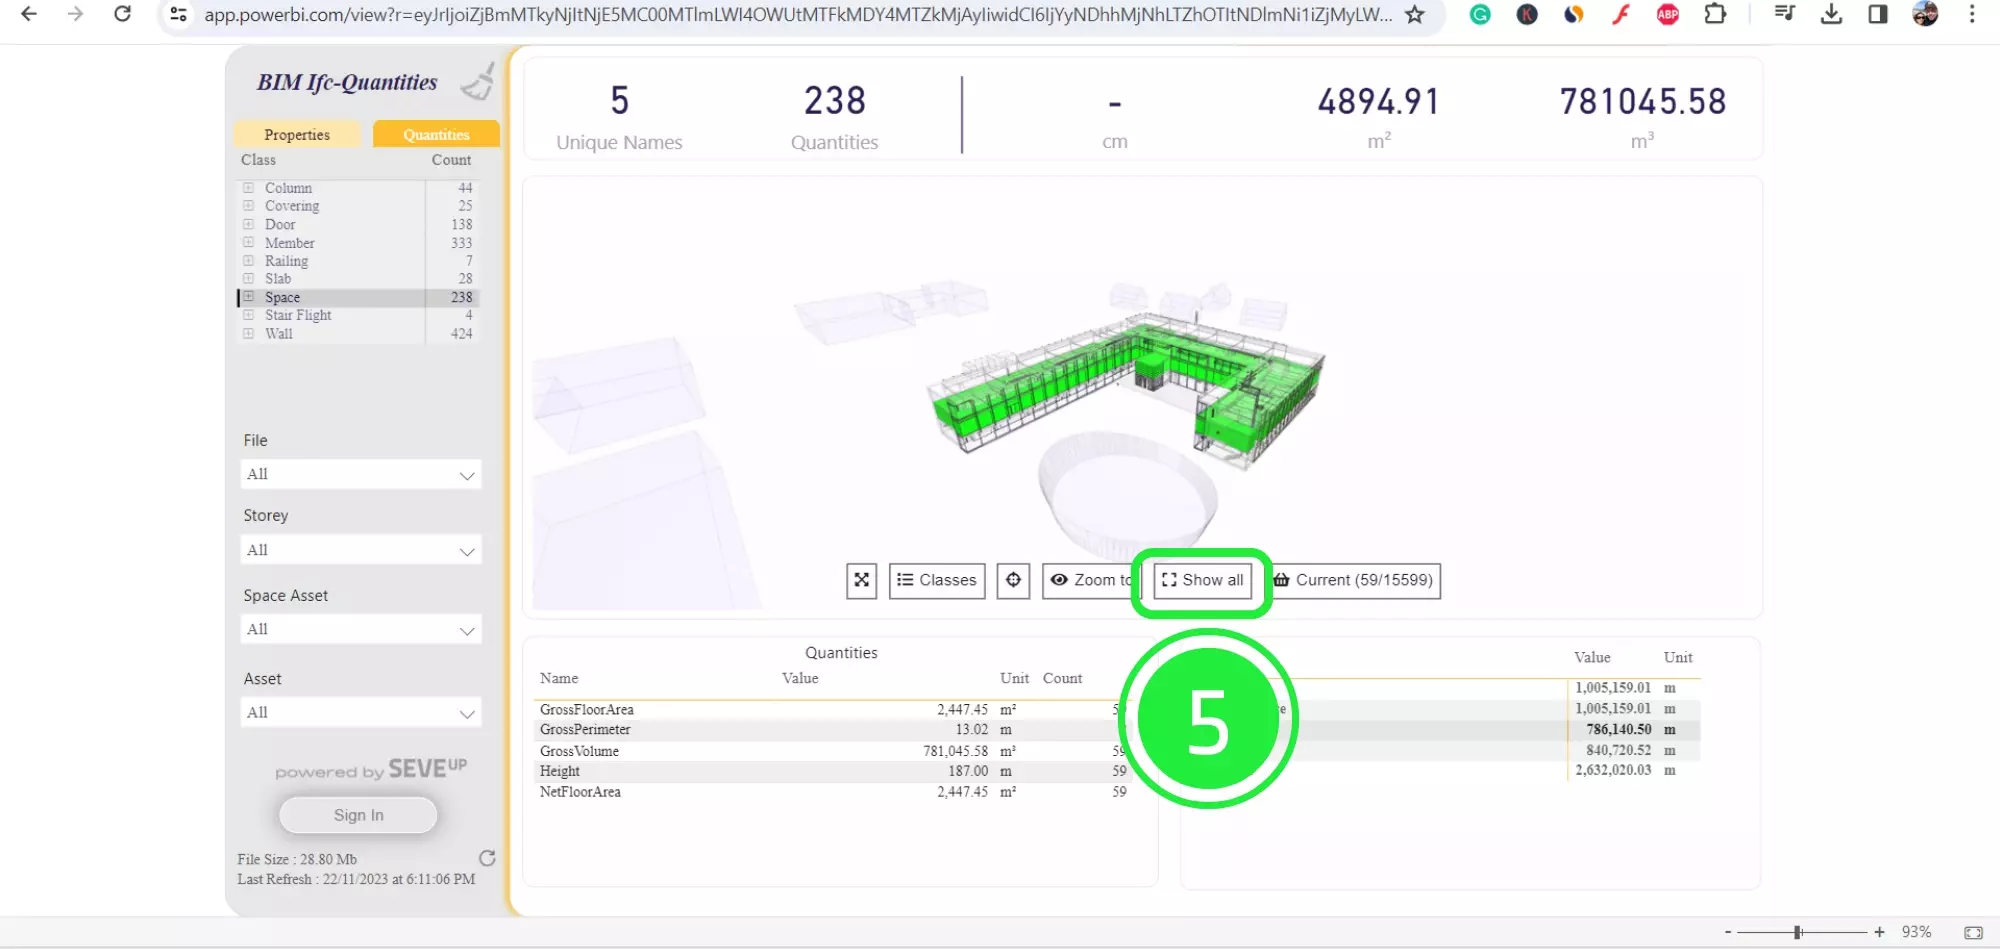
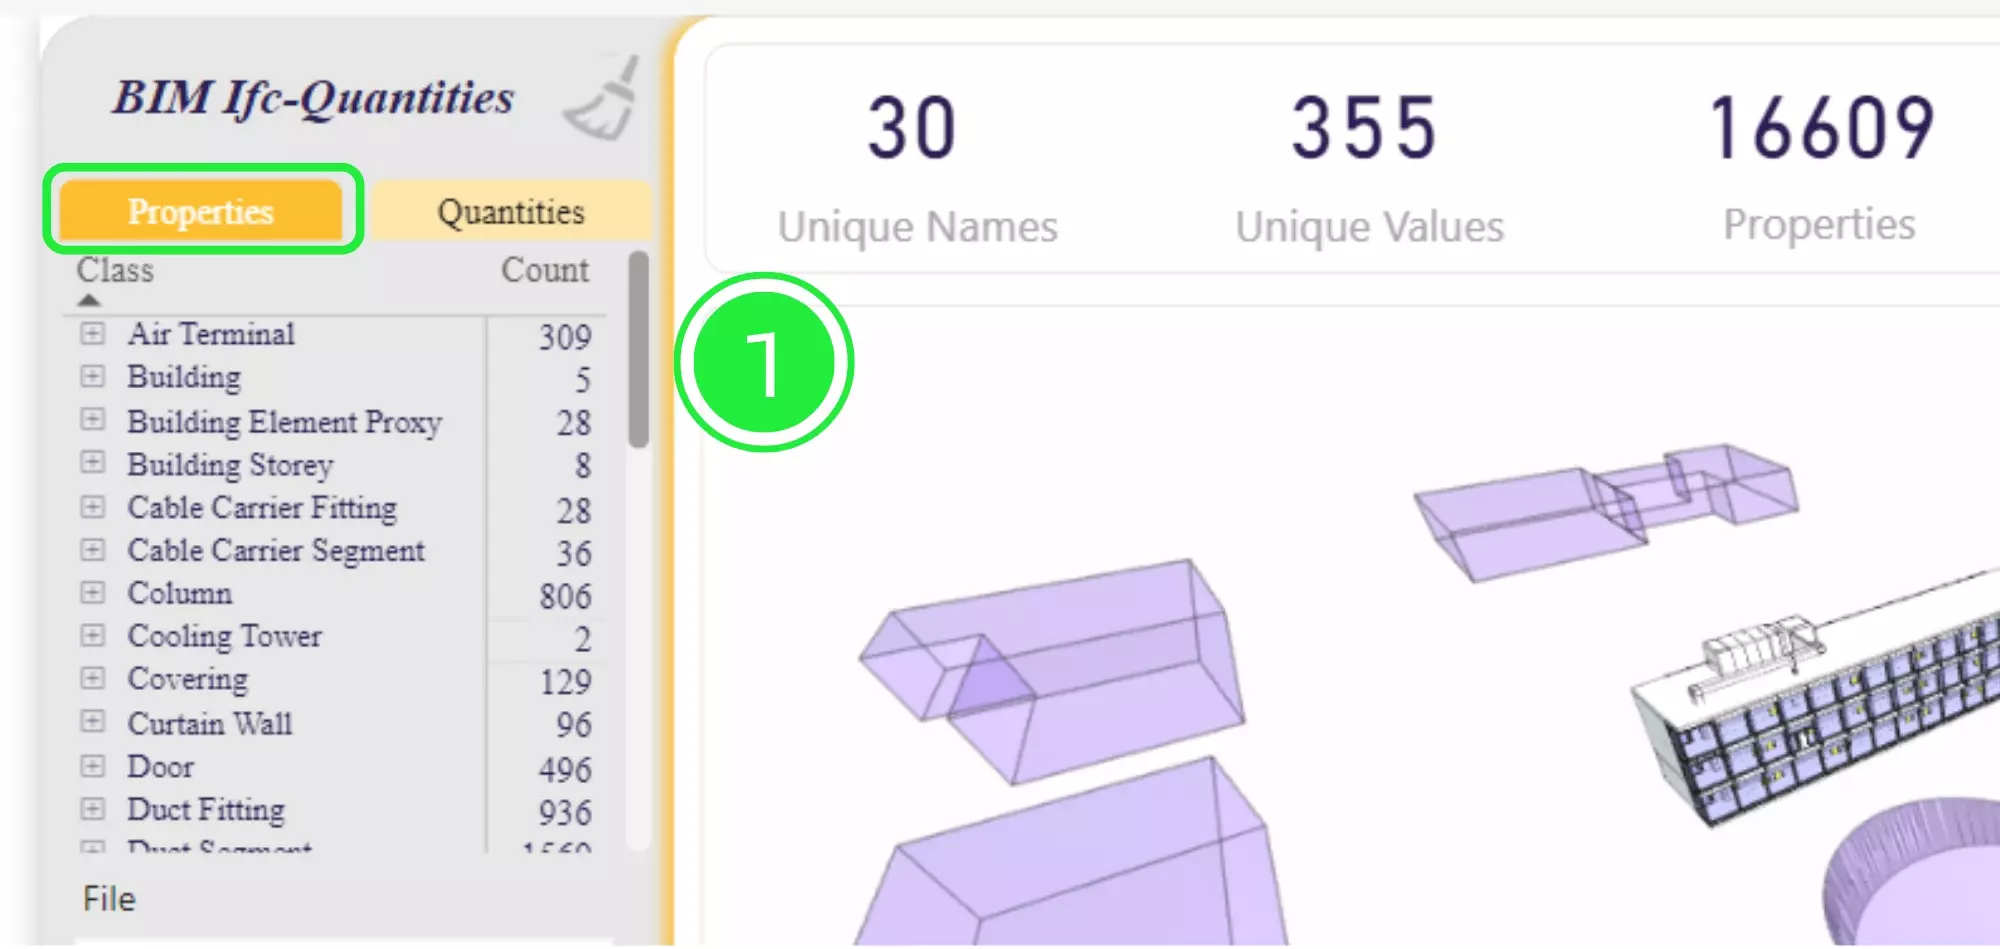
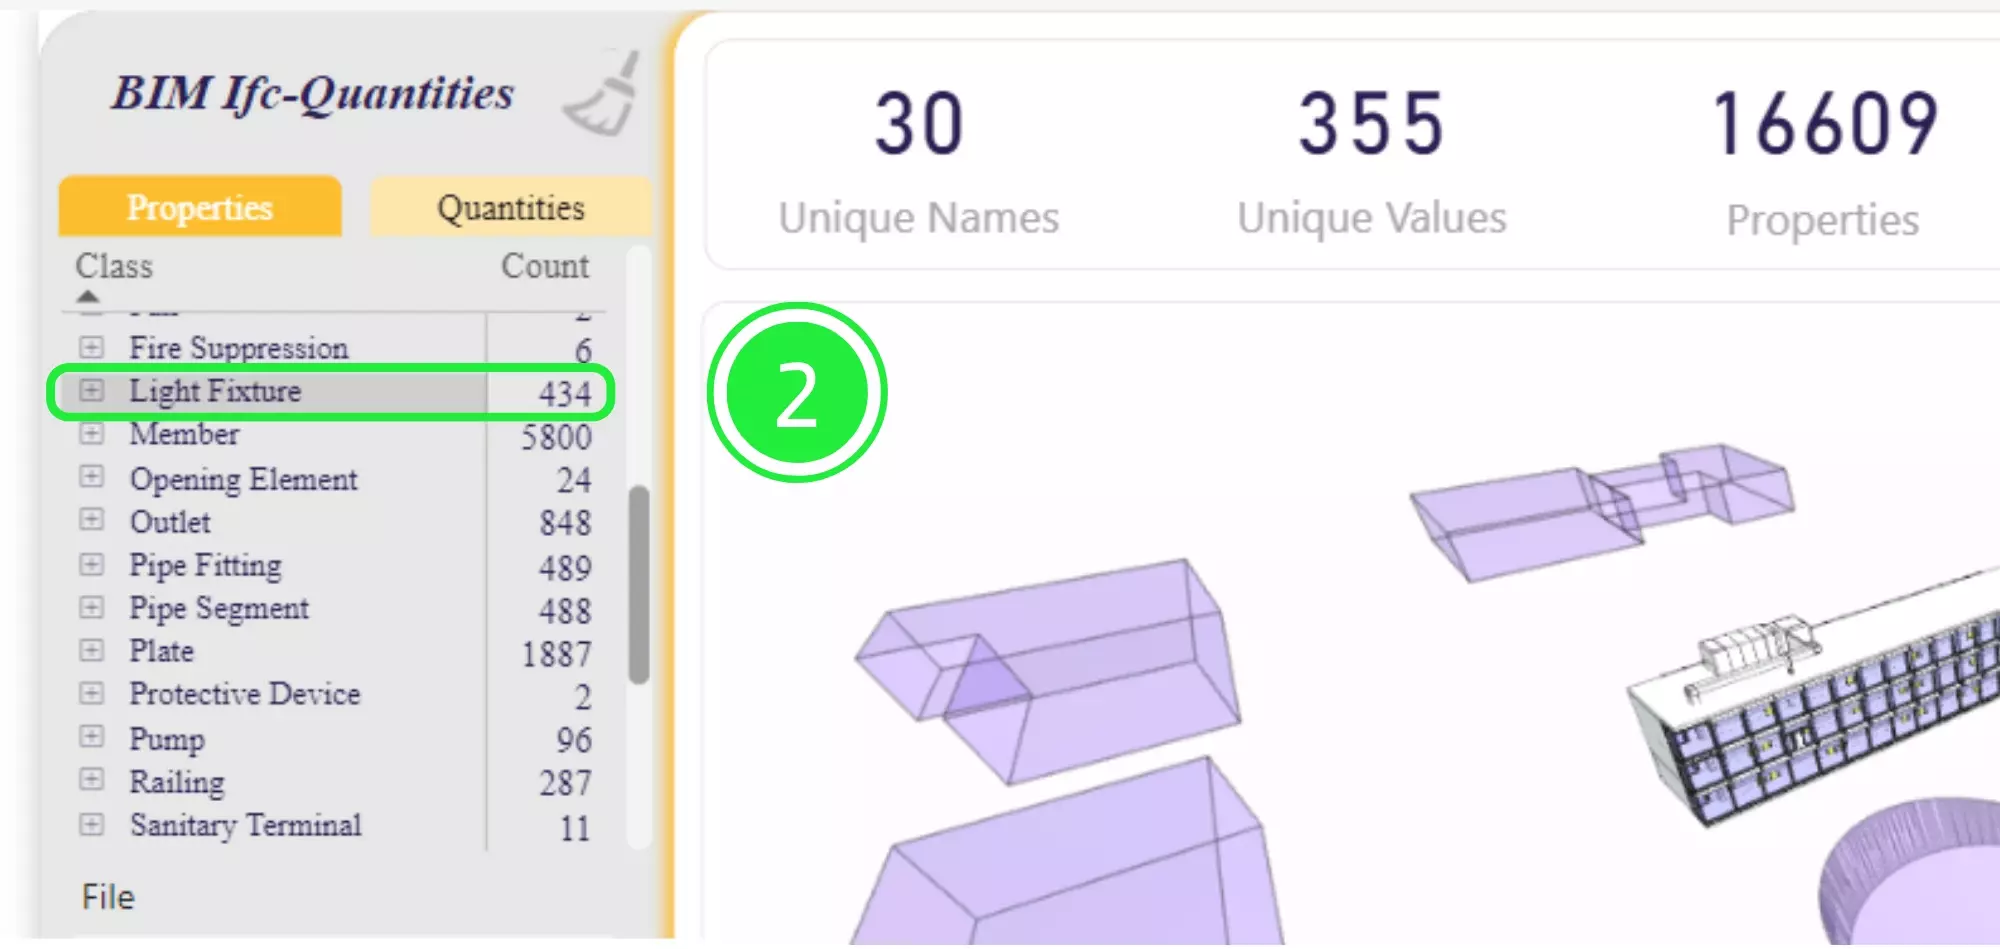
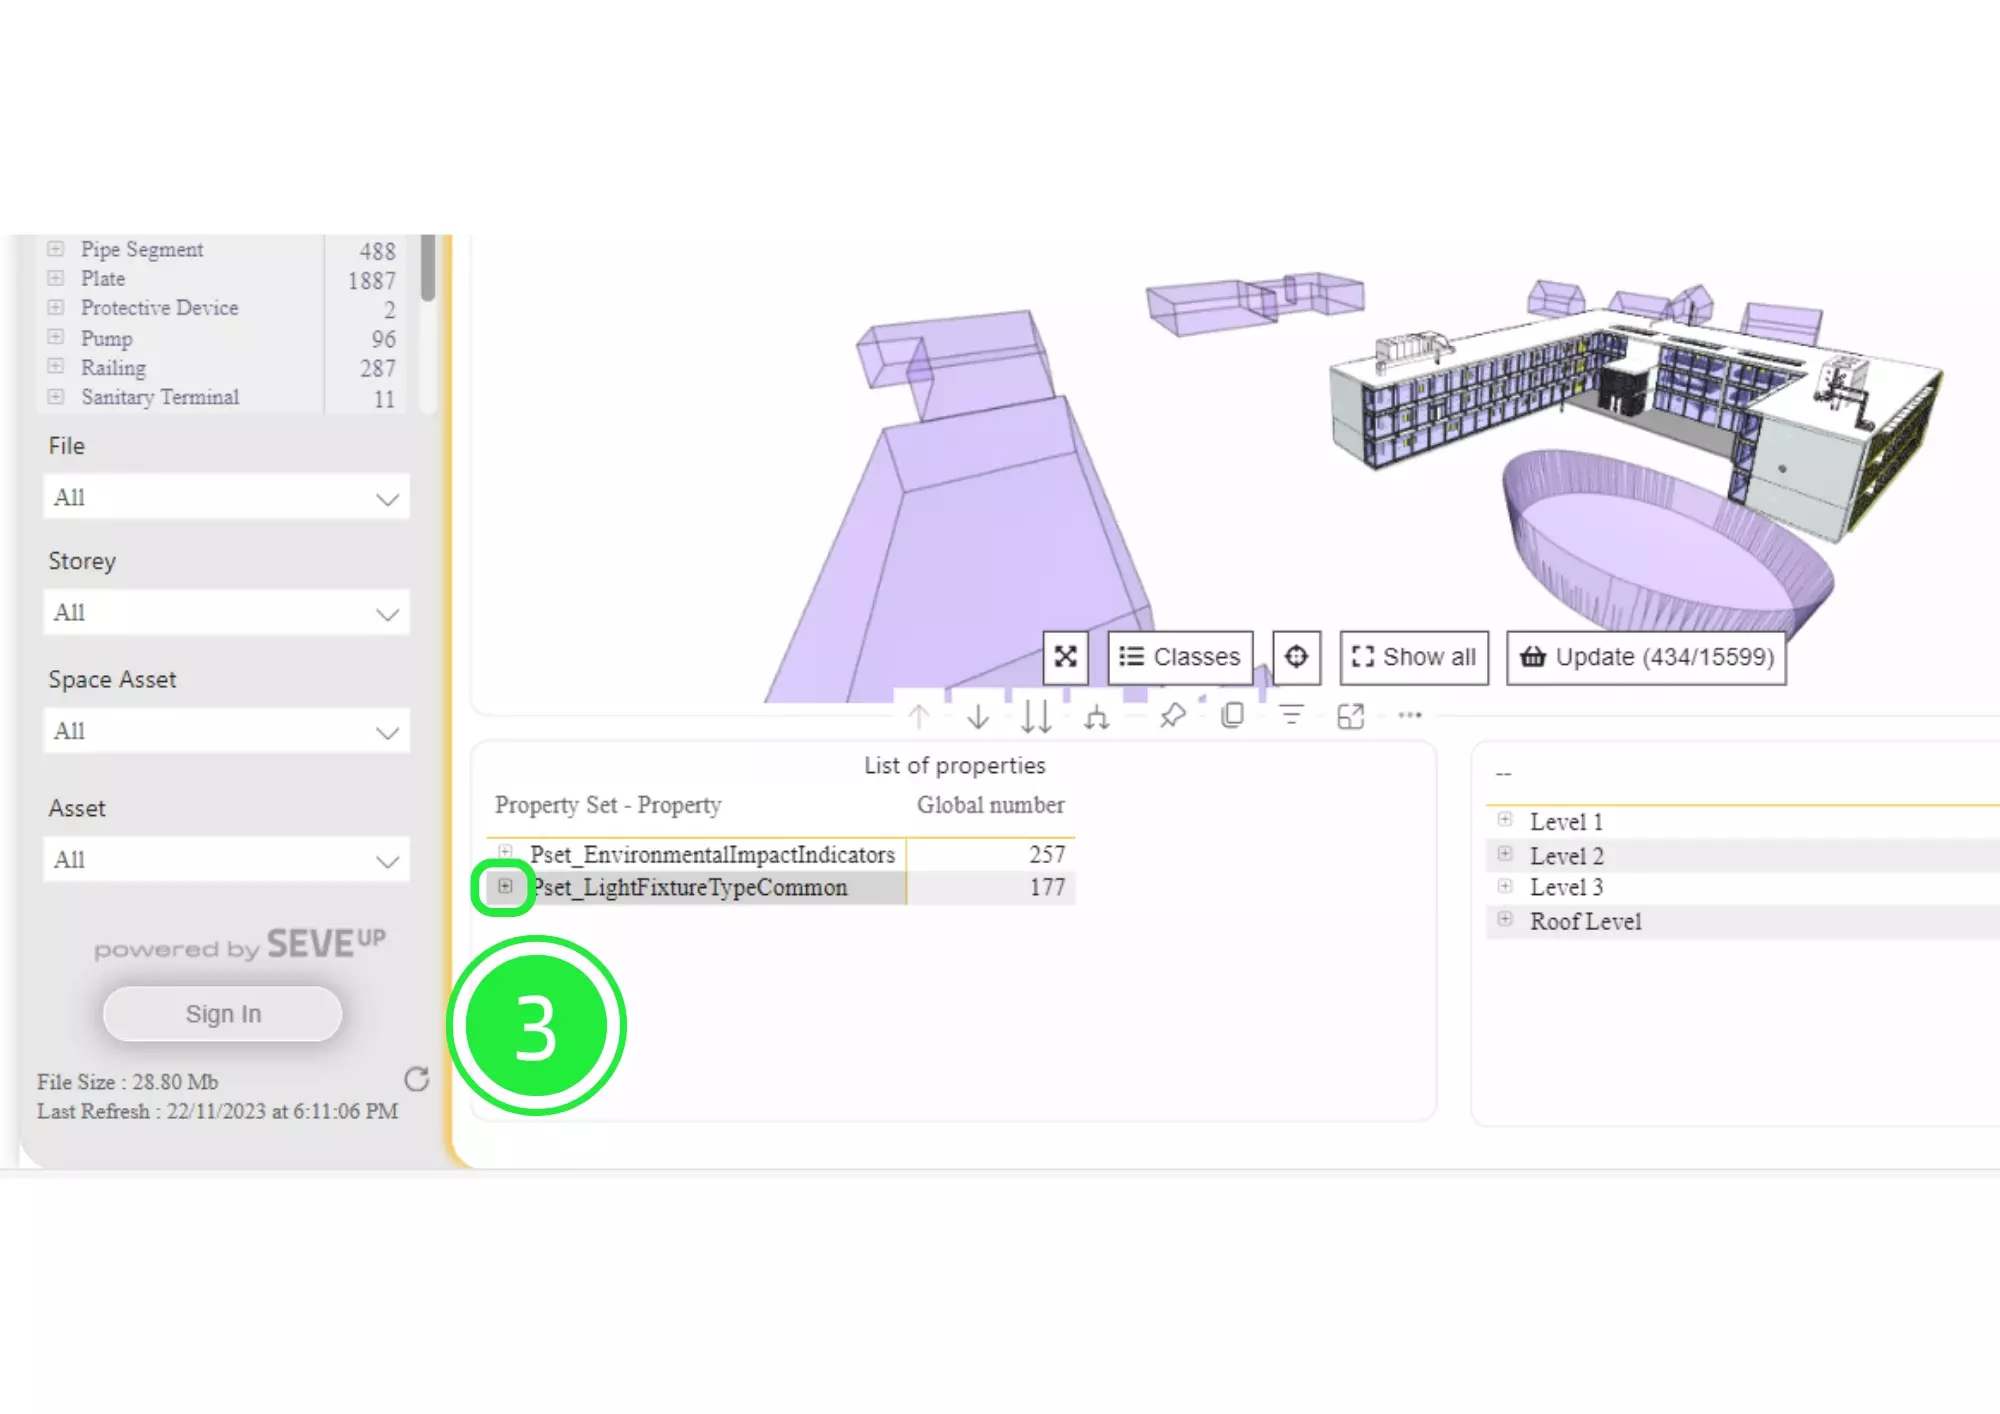
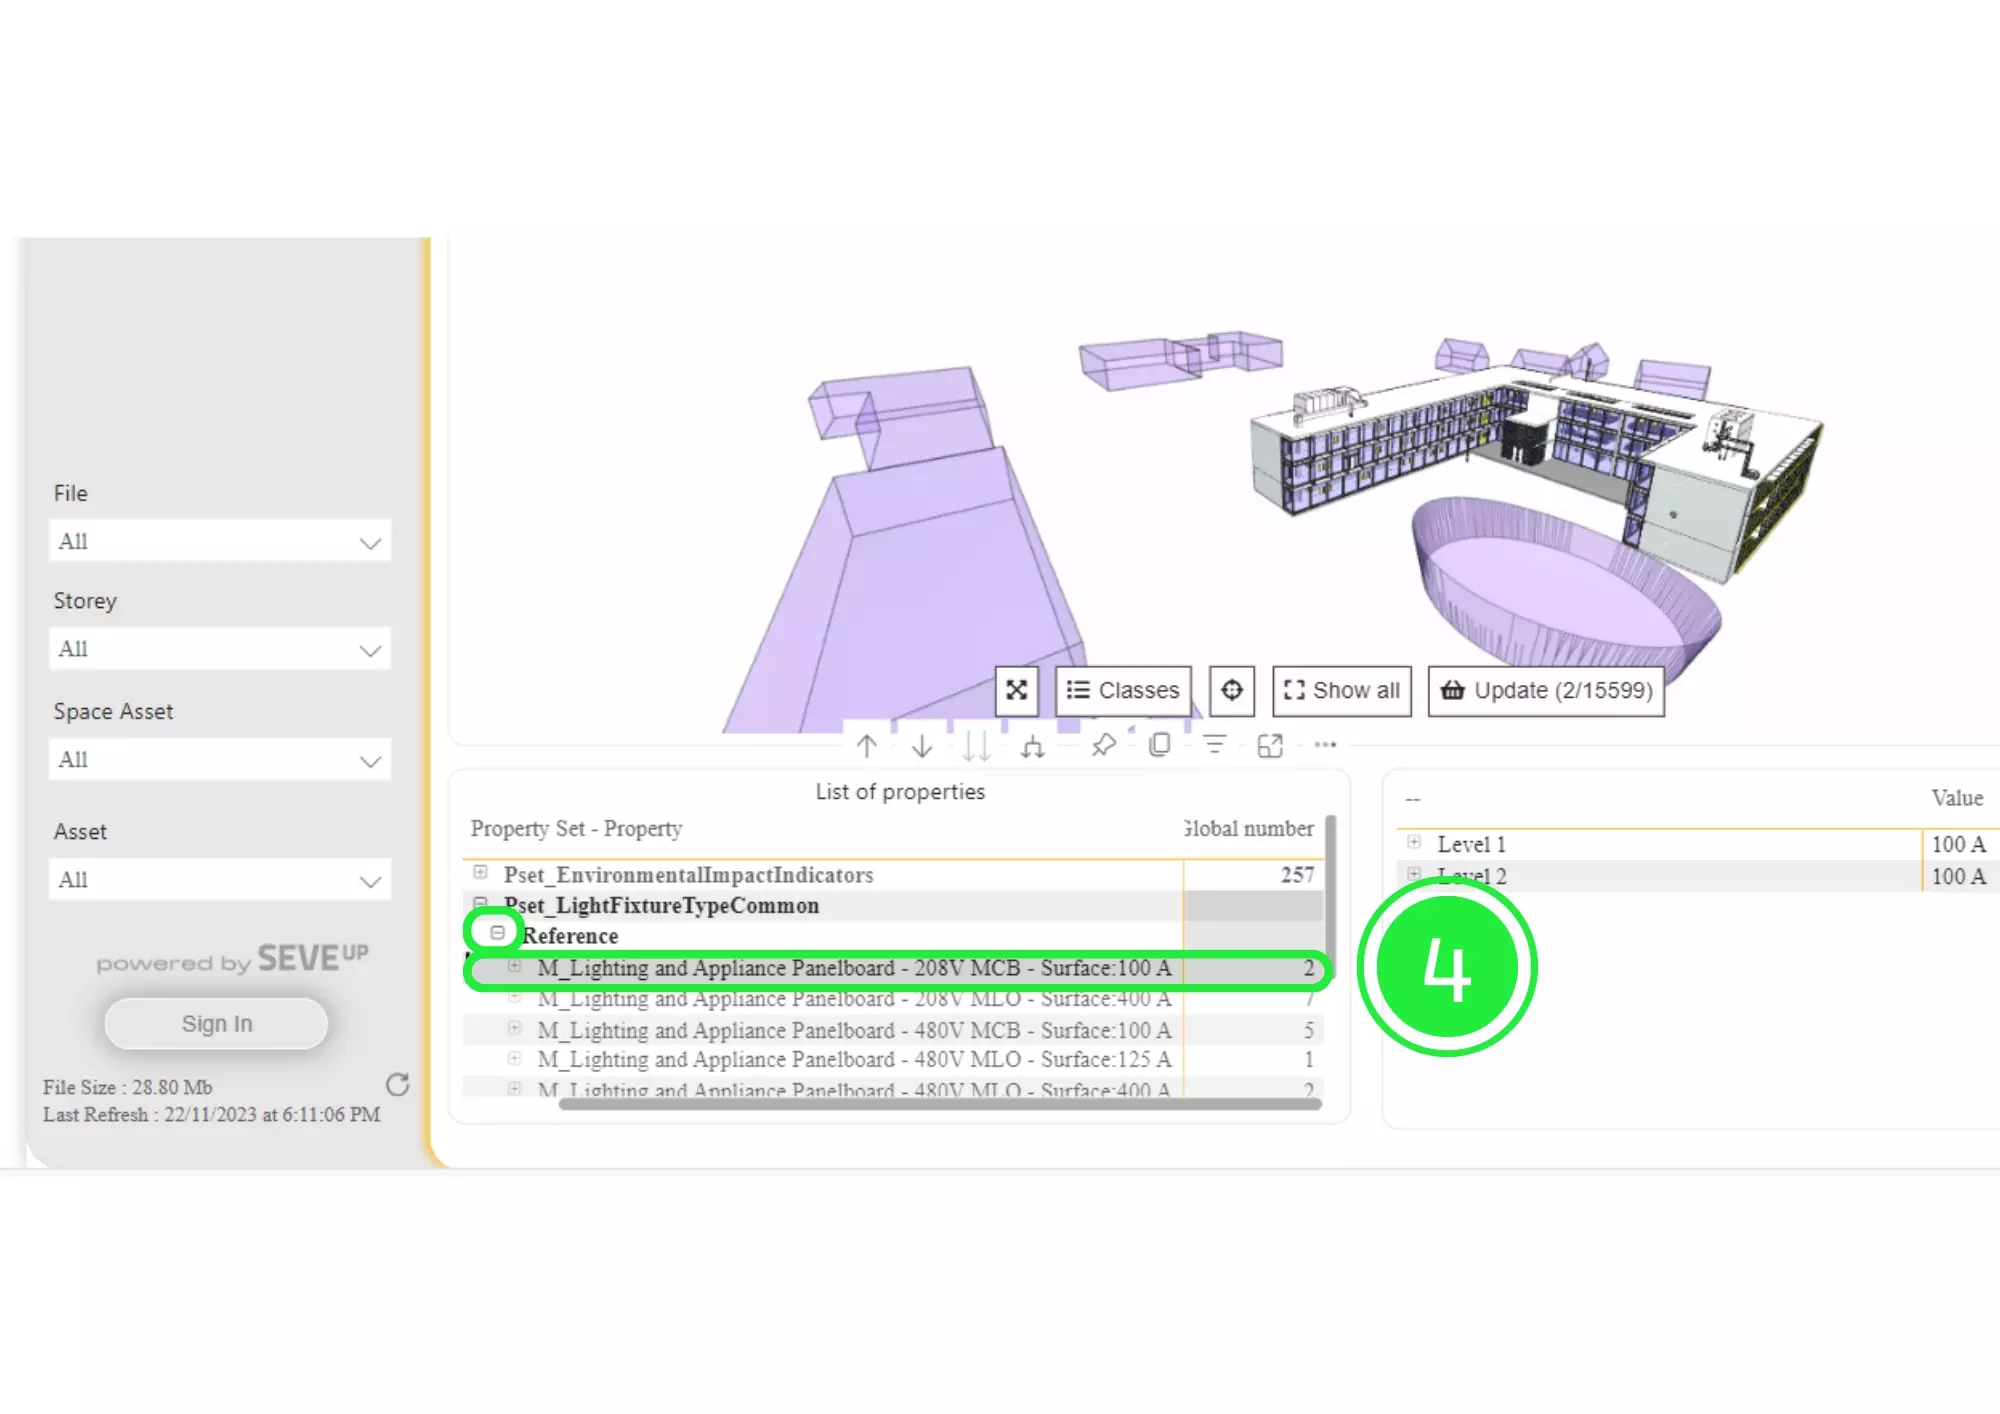
This guide provides a detailed tutorial on creating a QTO Dashboard in Power BI using SeveUp. It covers the initial setup in SeveUp, including uploading BIM models and creating a new project. Key steps involve adding a dashboard template and integrating it with Power BI. The article offers a step-by-step walkthrough for building, exporting, and publishing the dashboard to Power BI for advanced data analysis. Practical demonstrations on using the dashboard for QTO data are included, showcasing its application in project management. The guide concludes by highlighting the usefulness of SeveUp in enhancing construction project analytics with a QTO Dashboard in Power BI.

Start Your Journey: Create a Free SeveUp Account for QTO Dashboard in Power BI

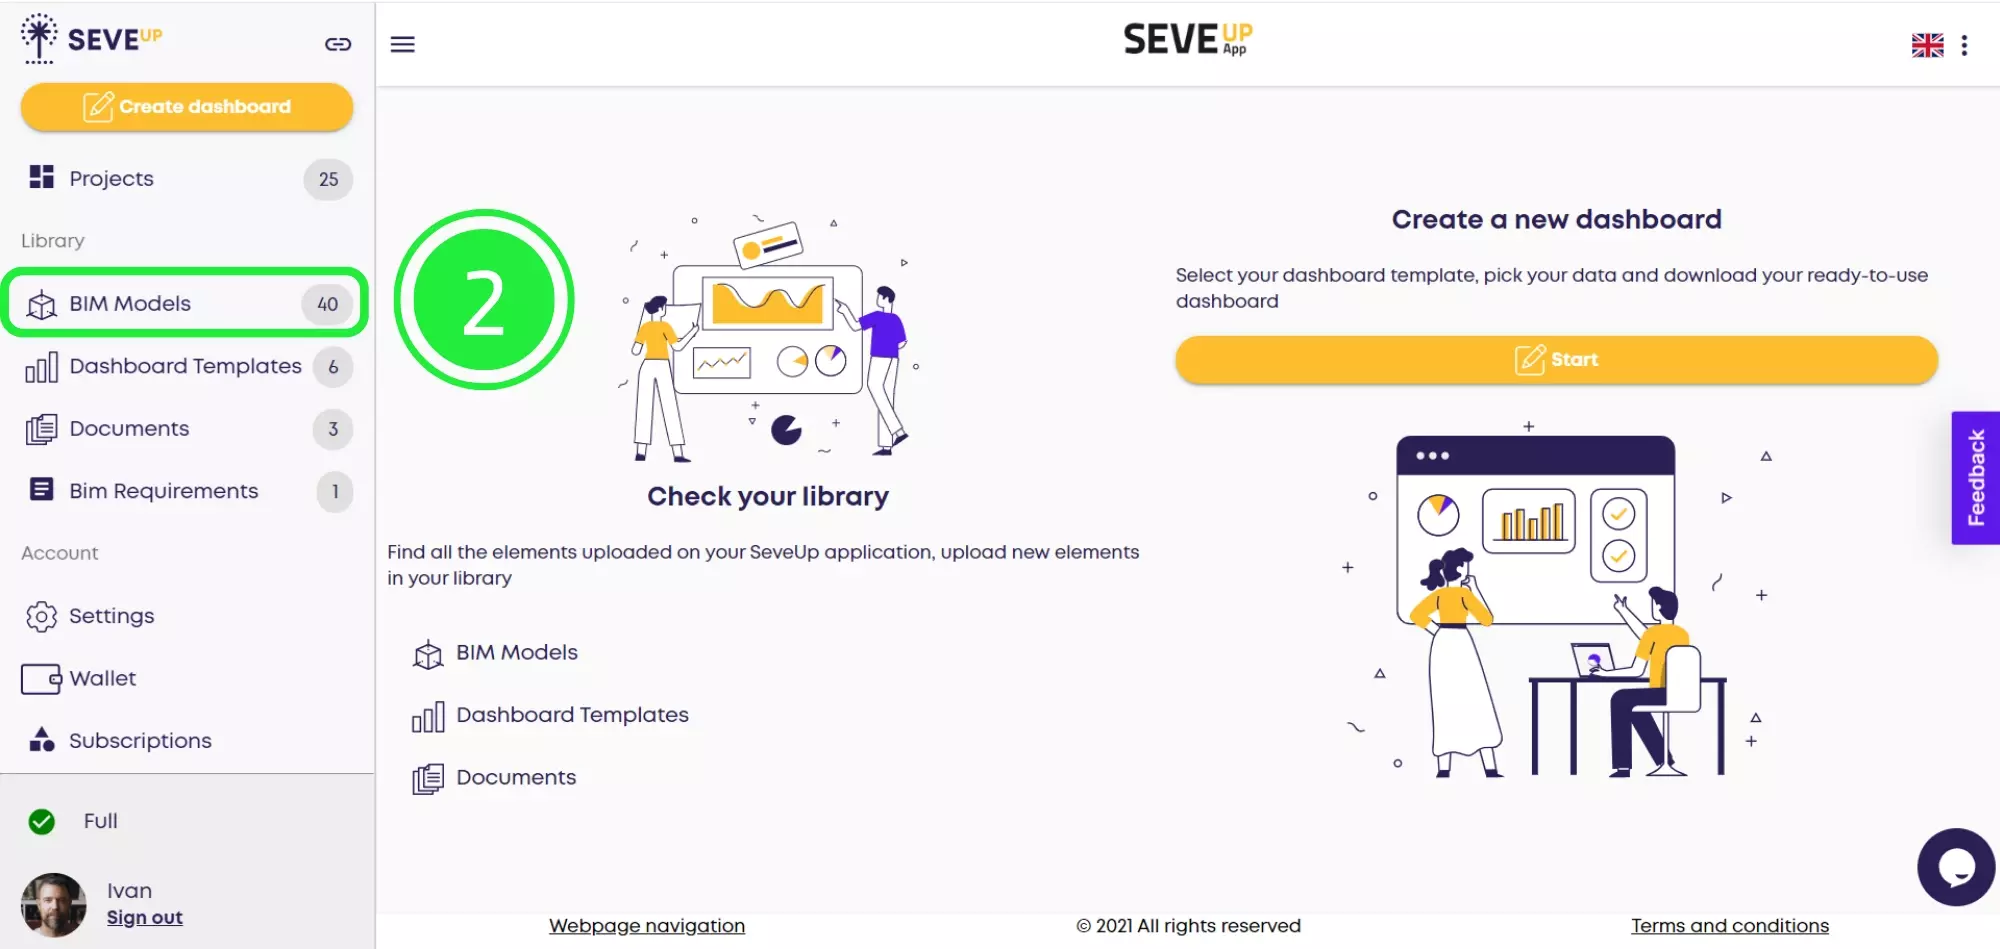
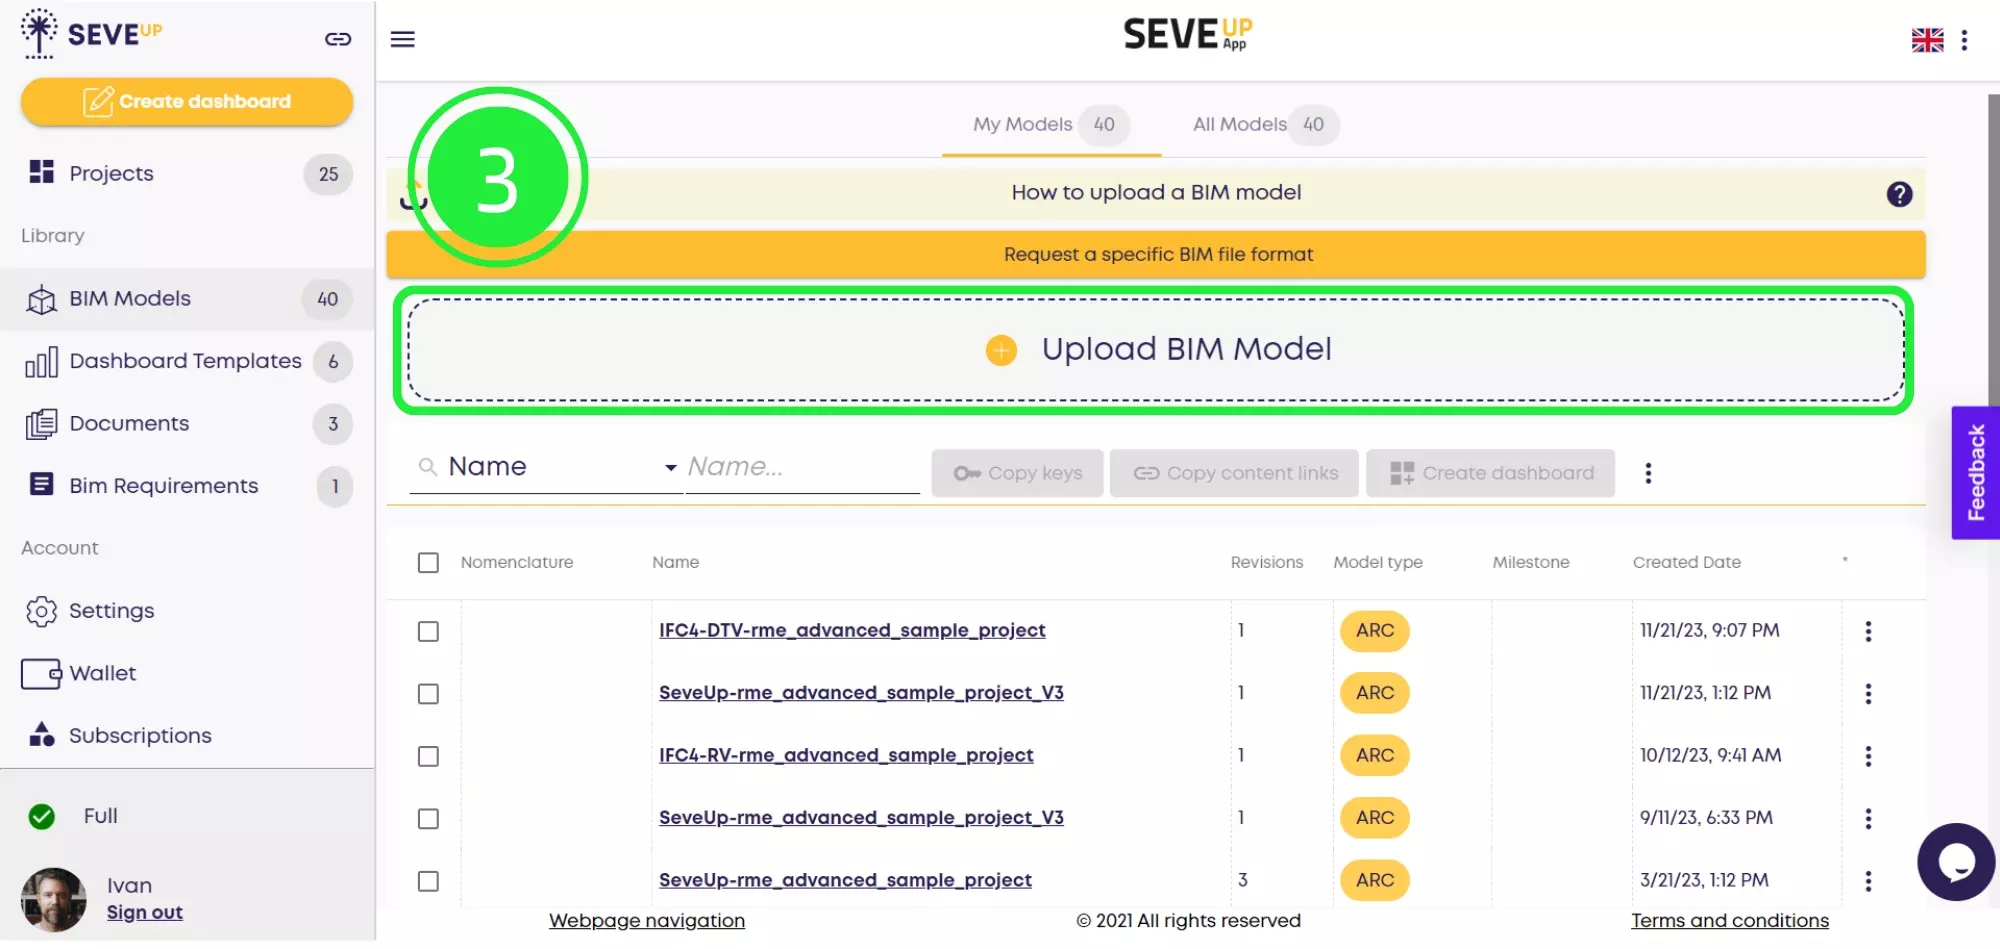
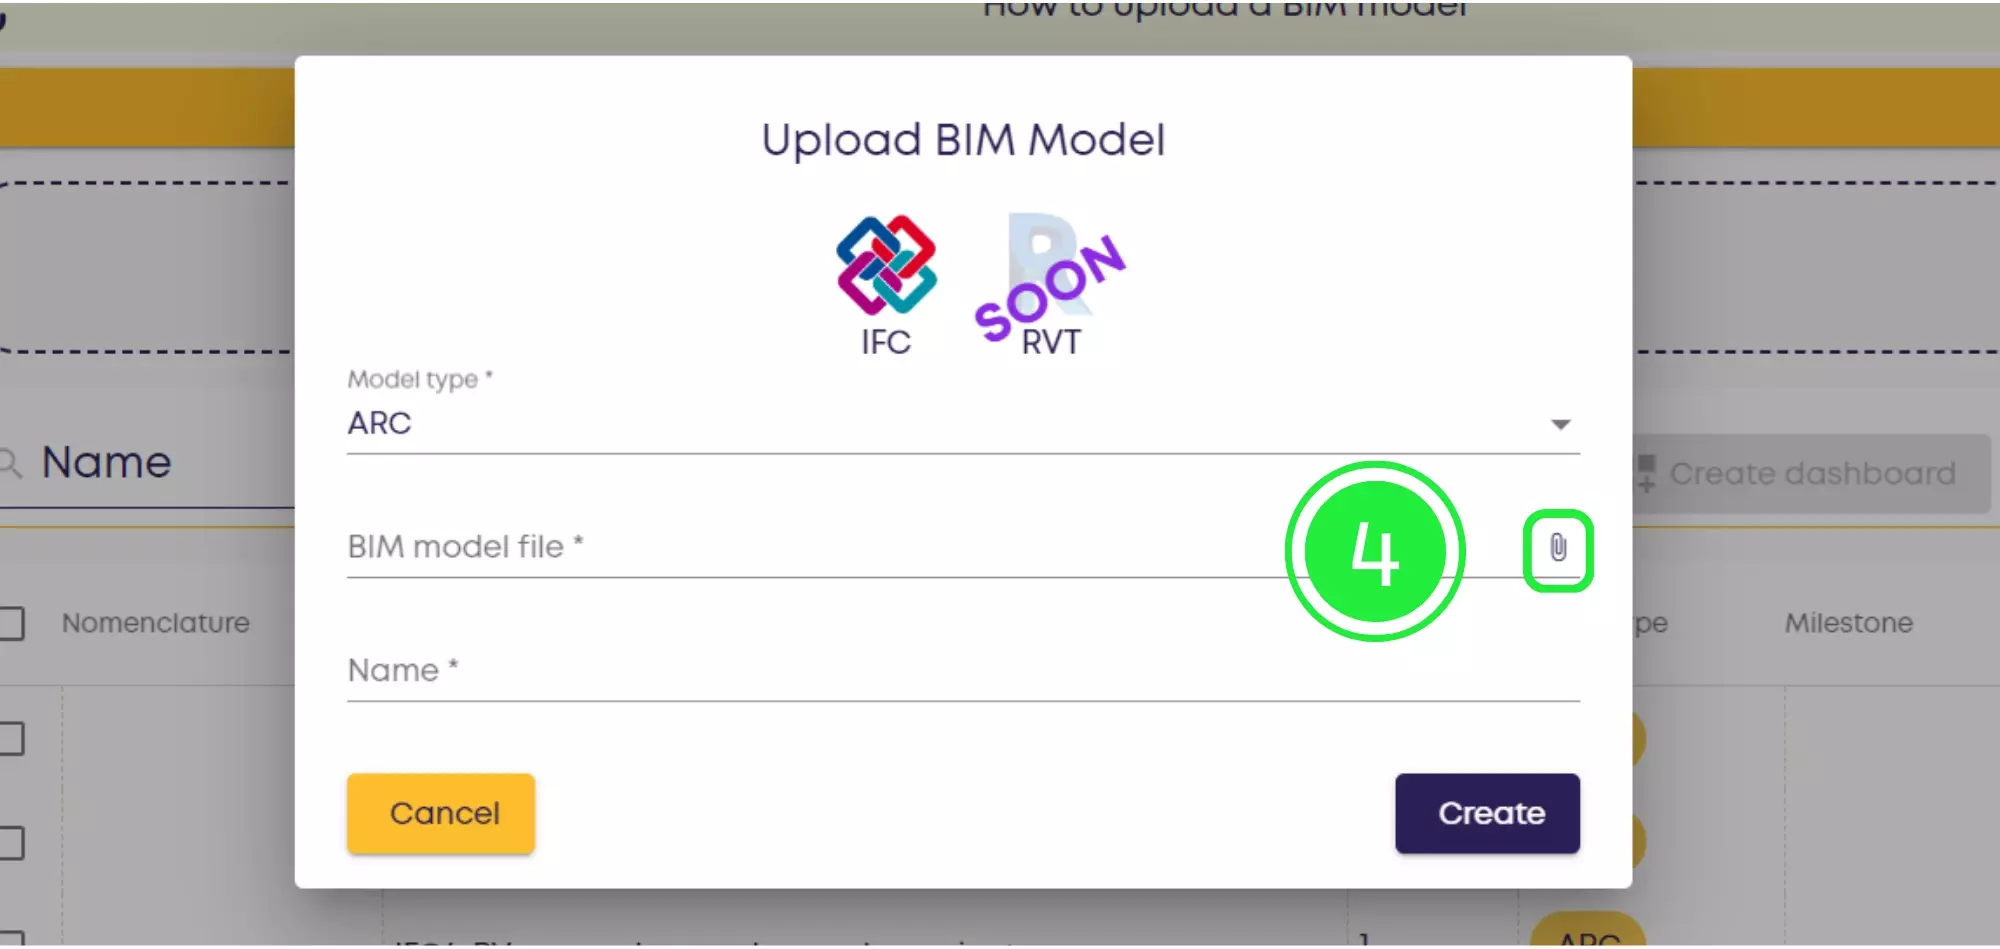
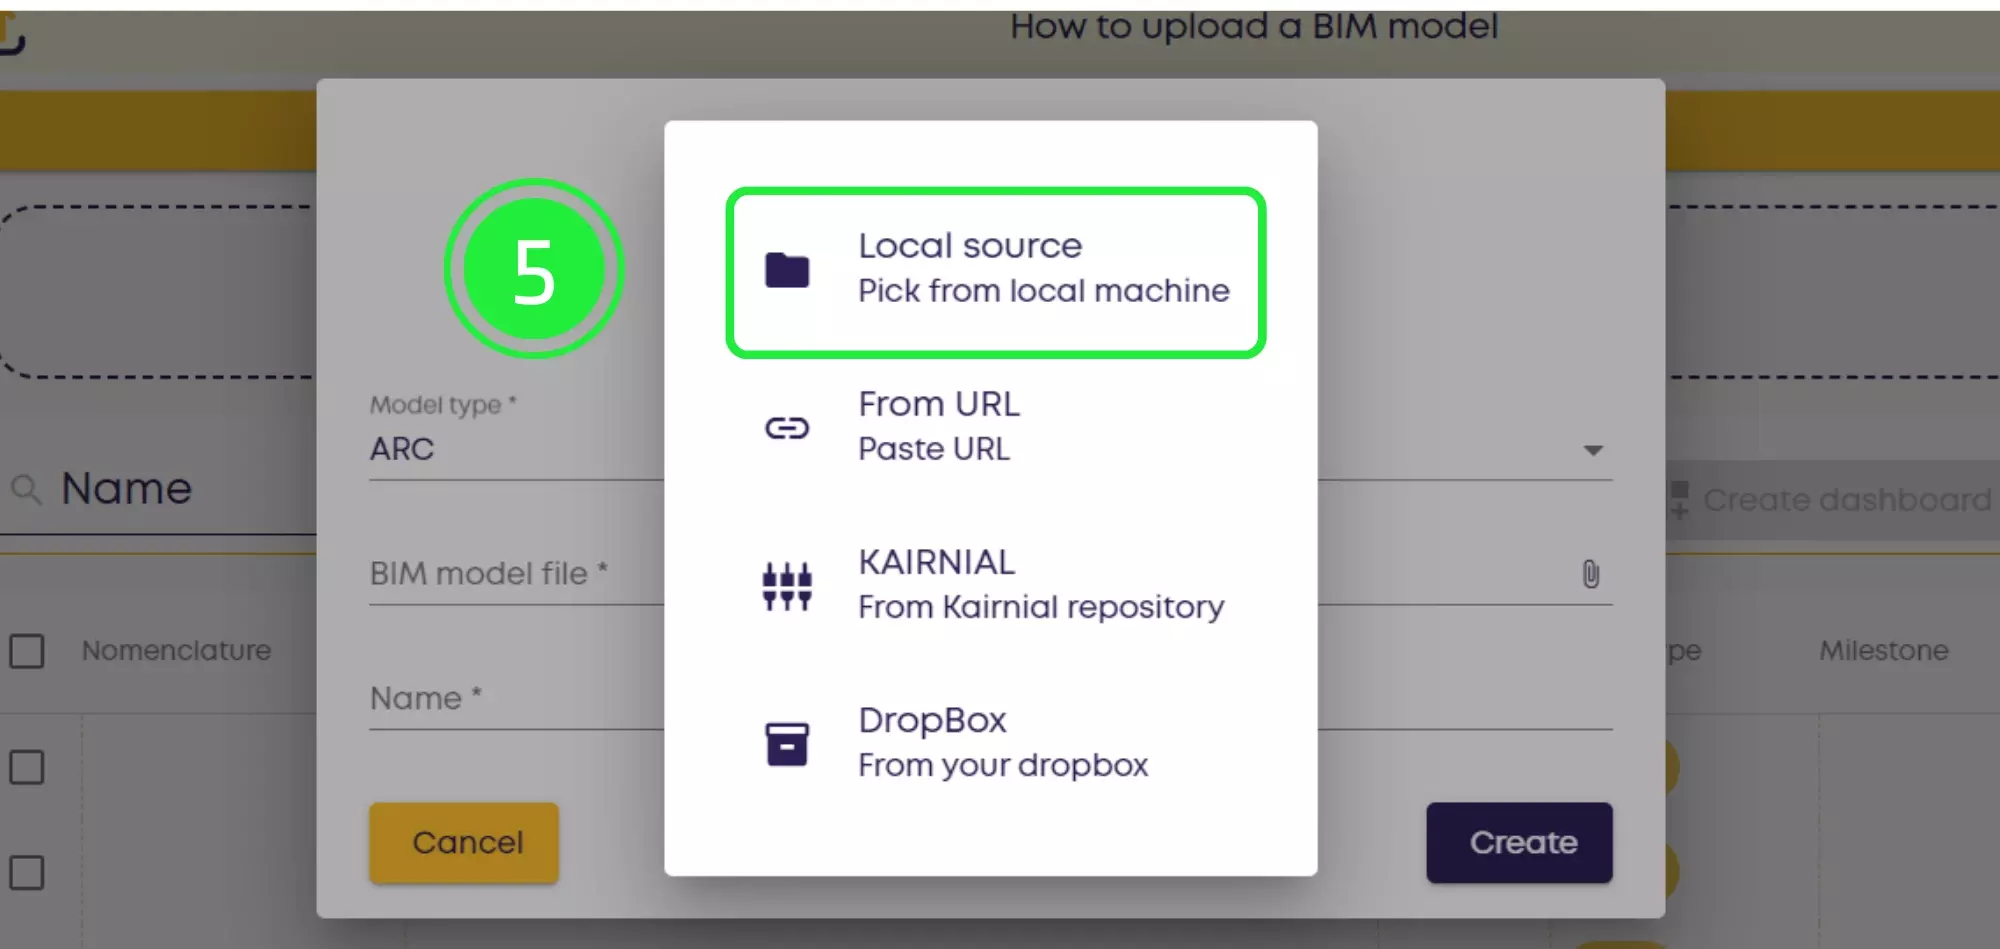
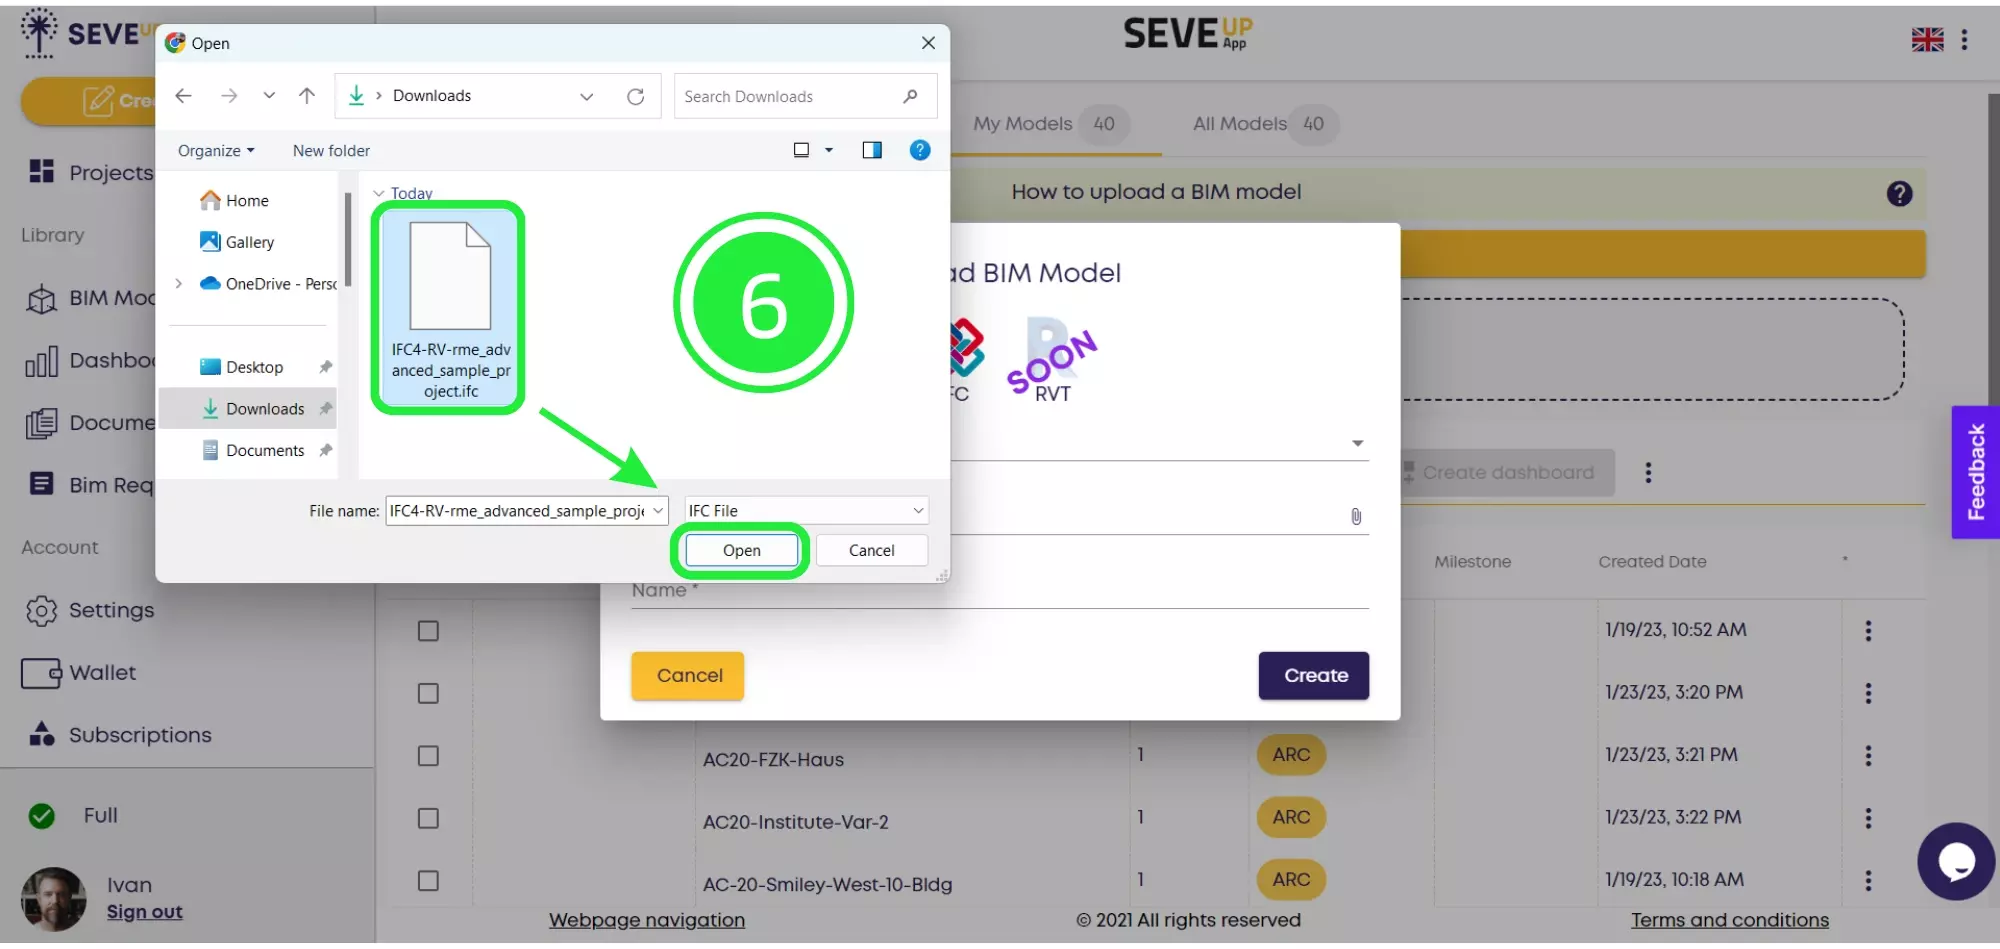
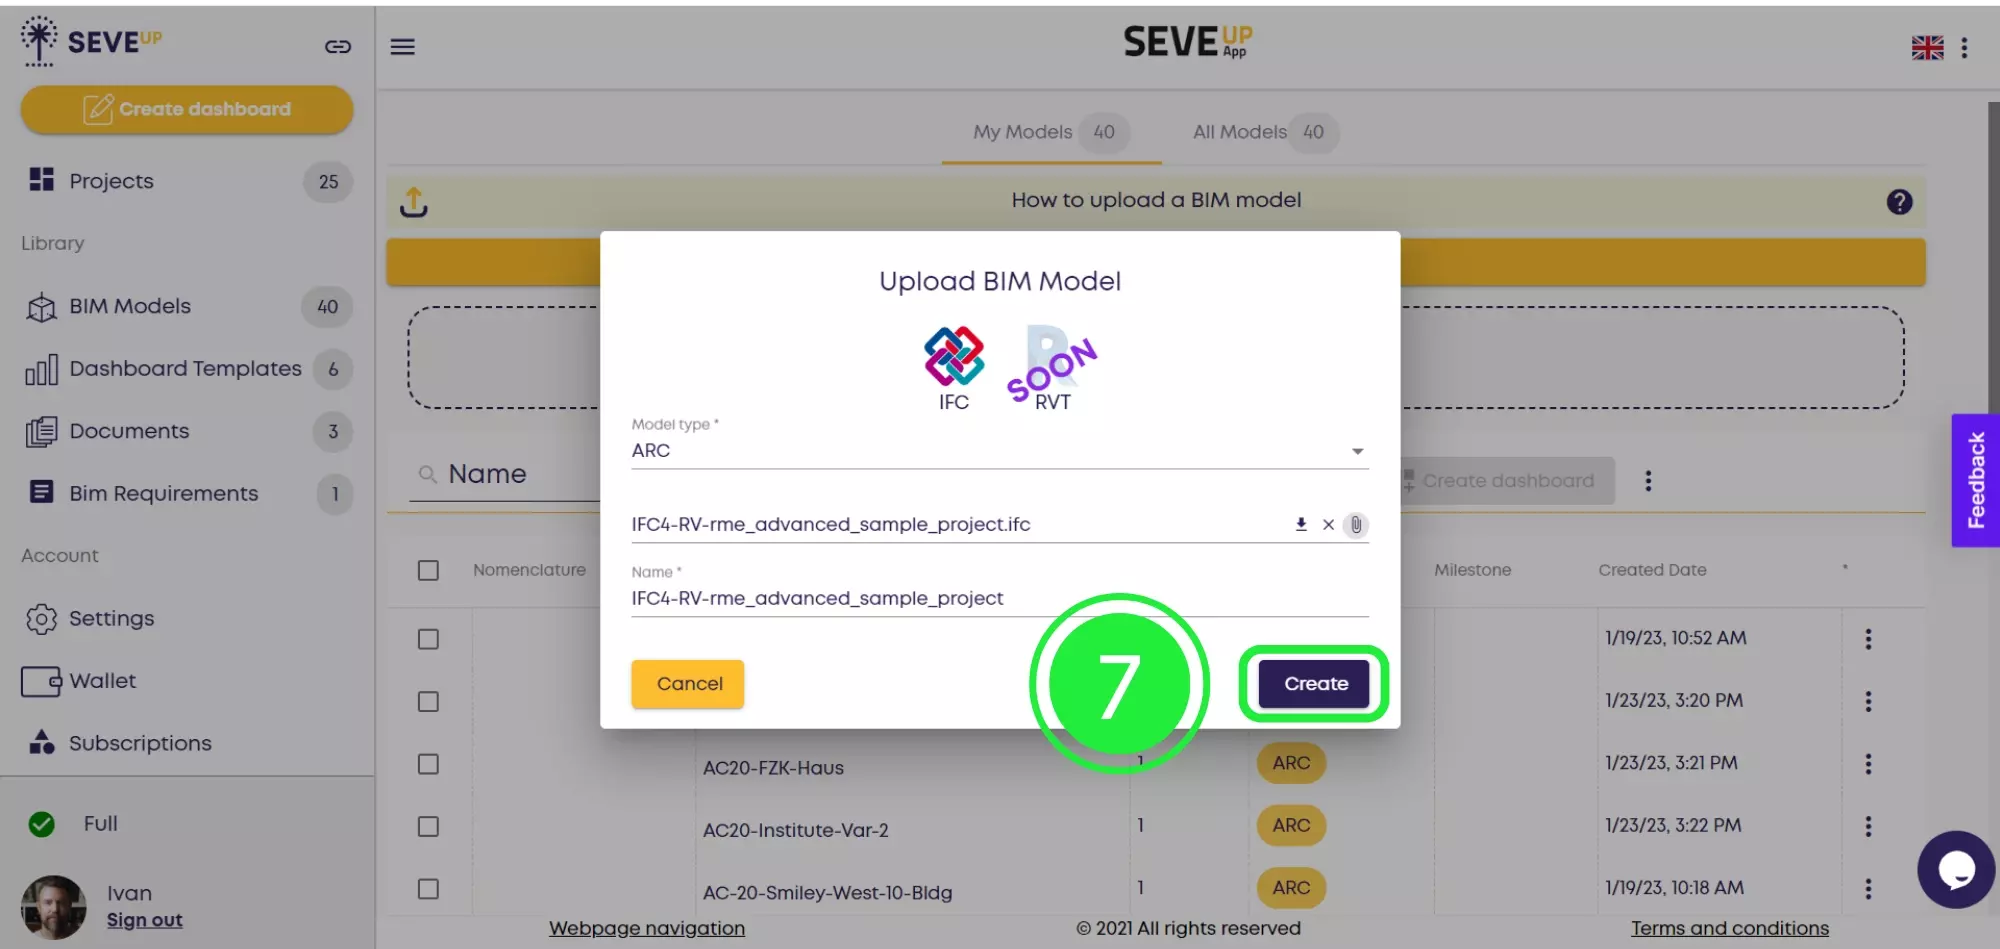
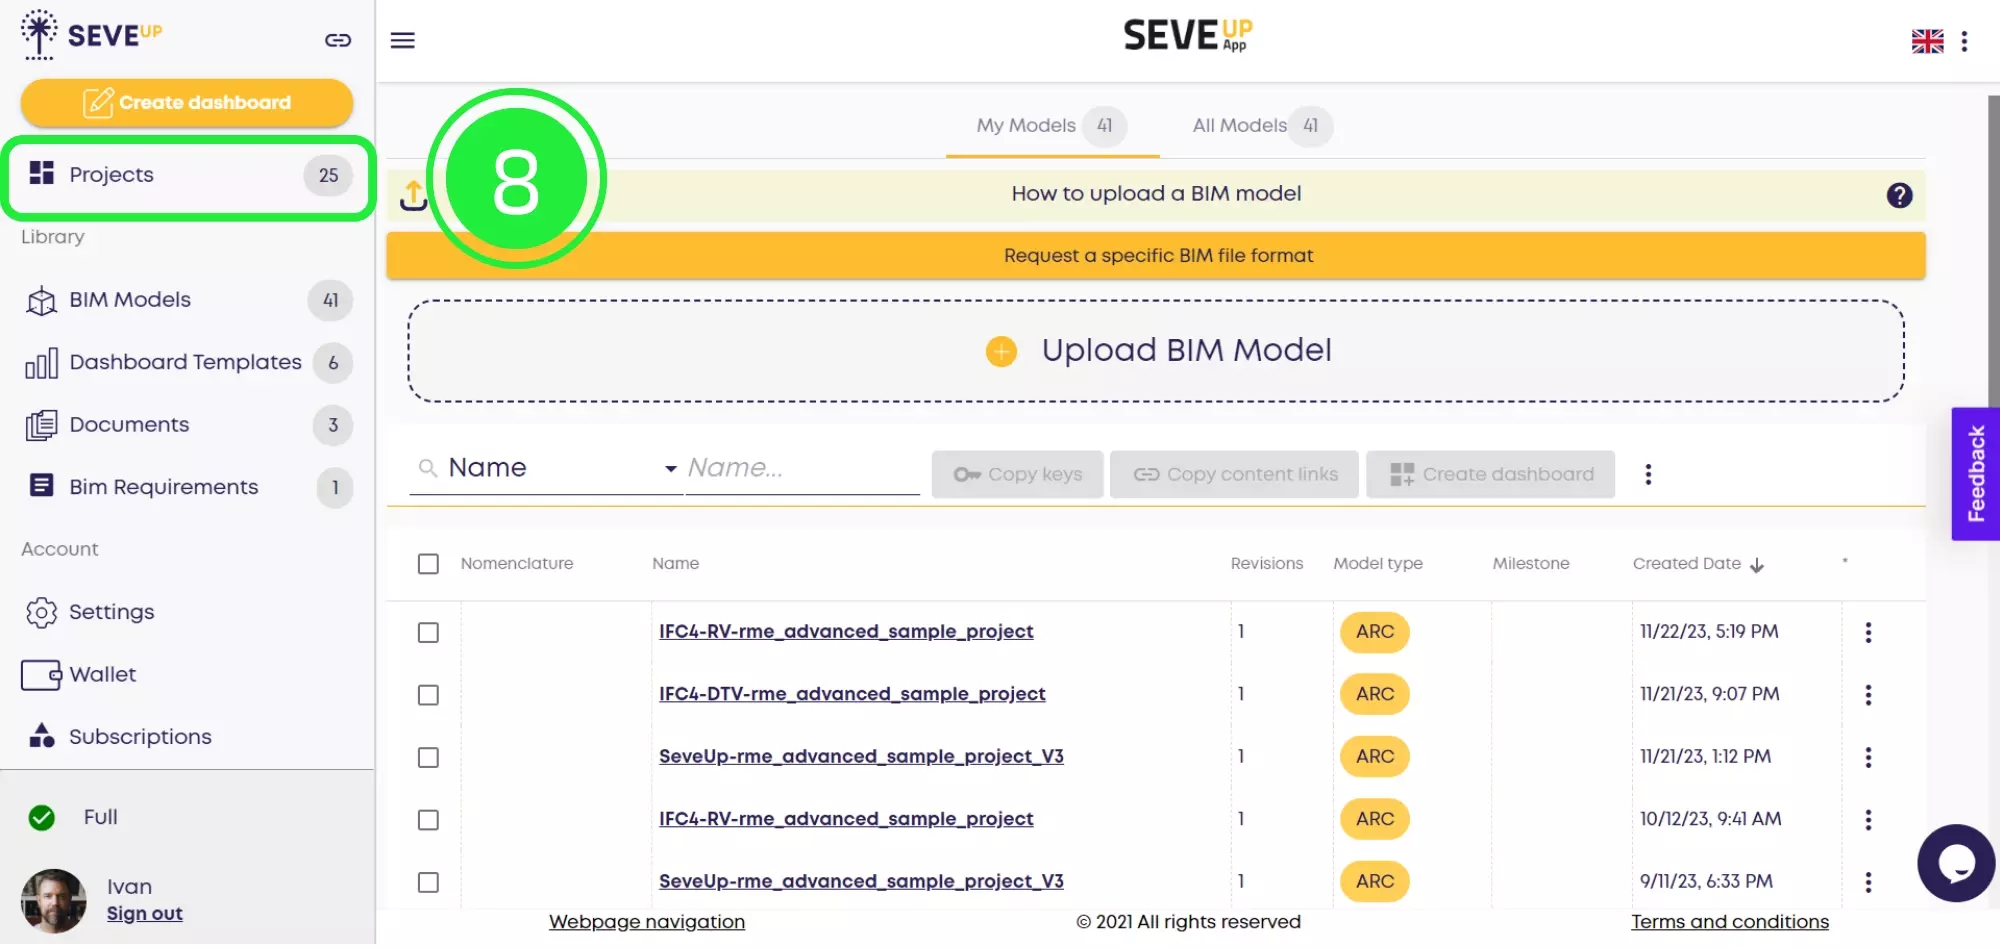
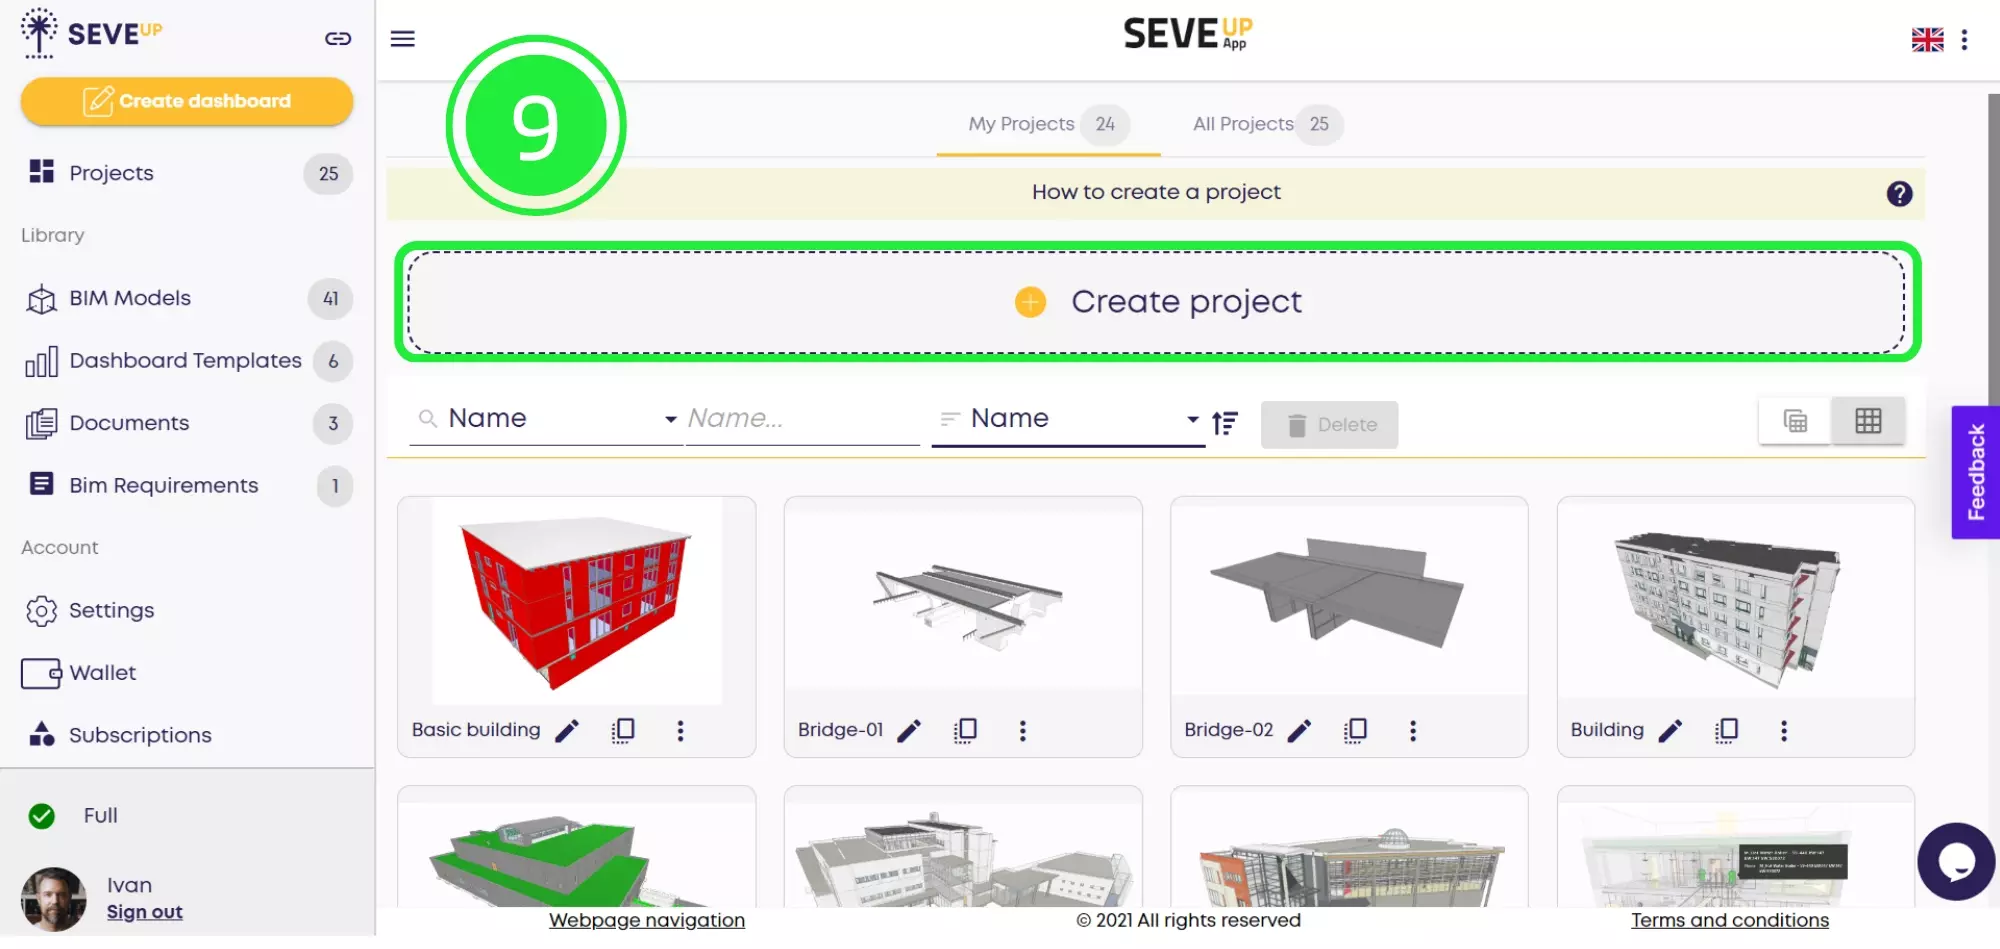
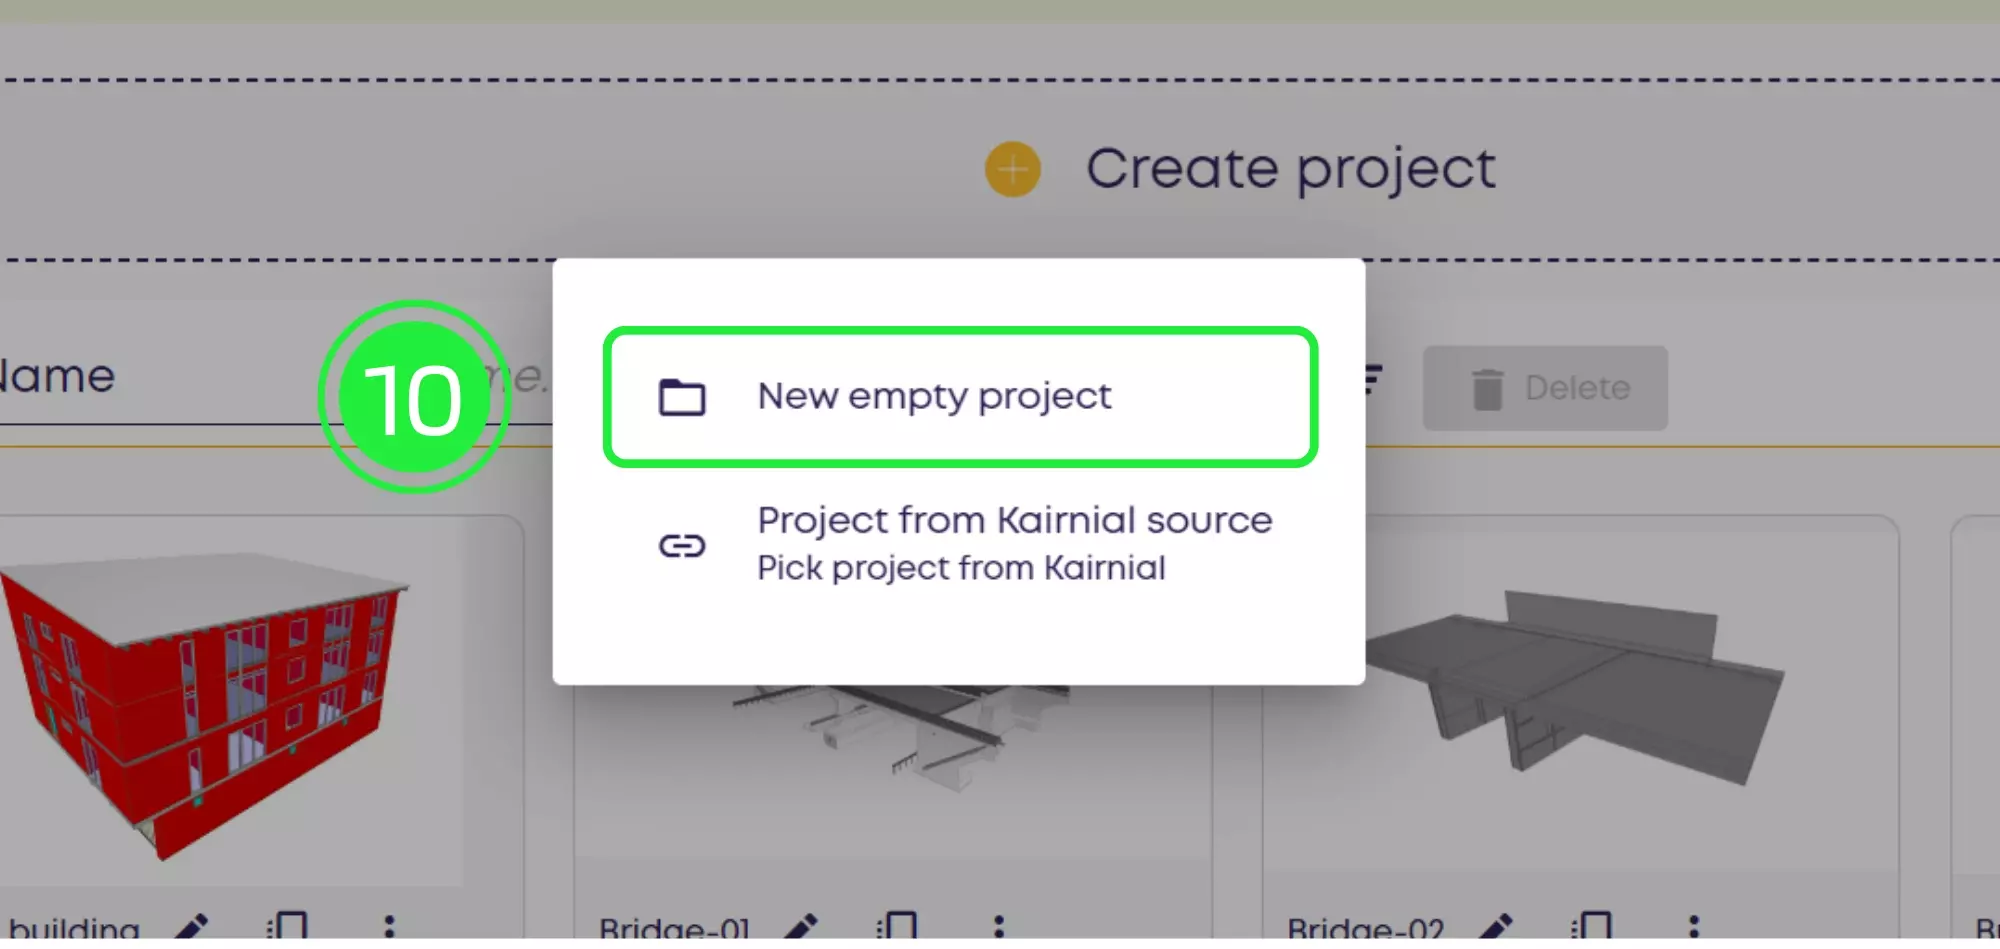
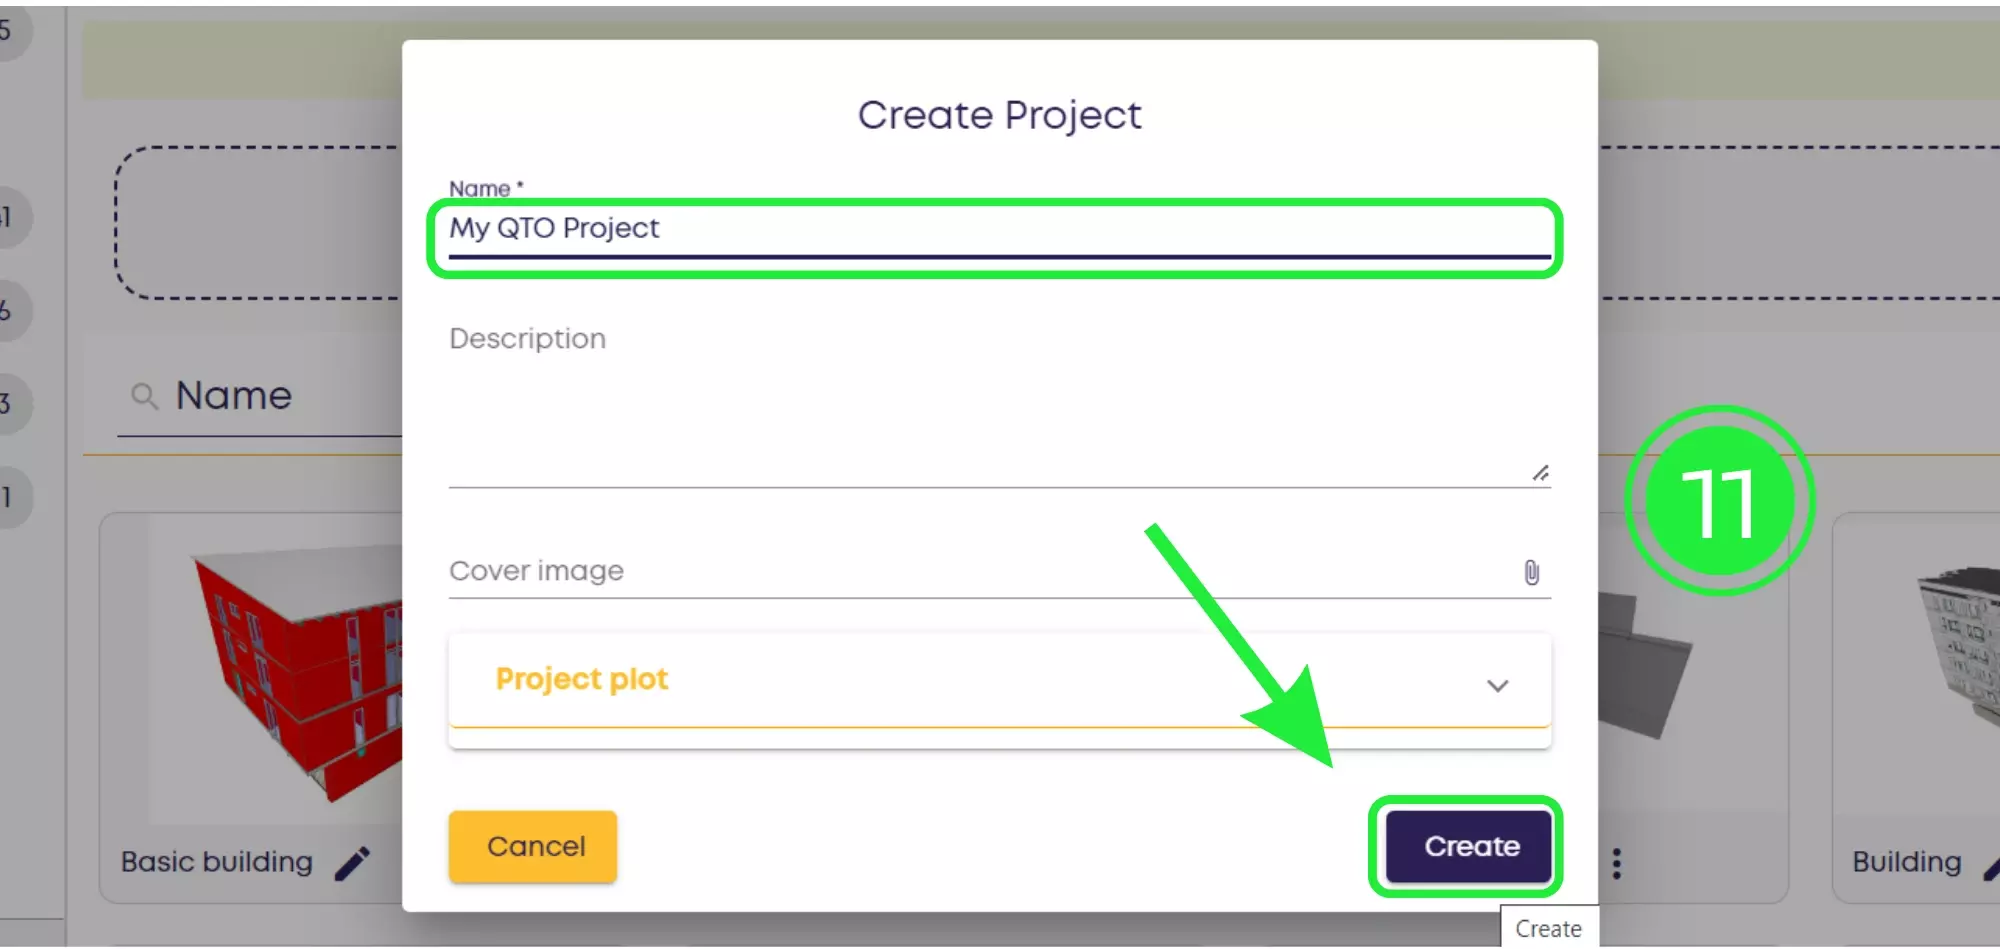
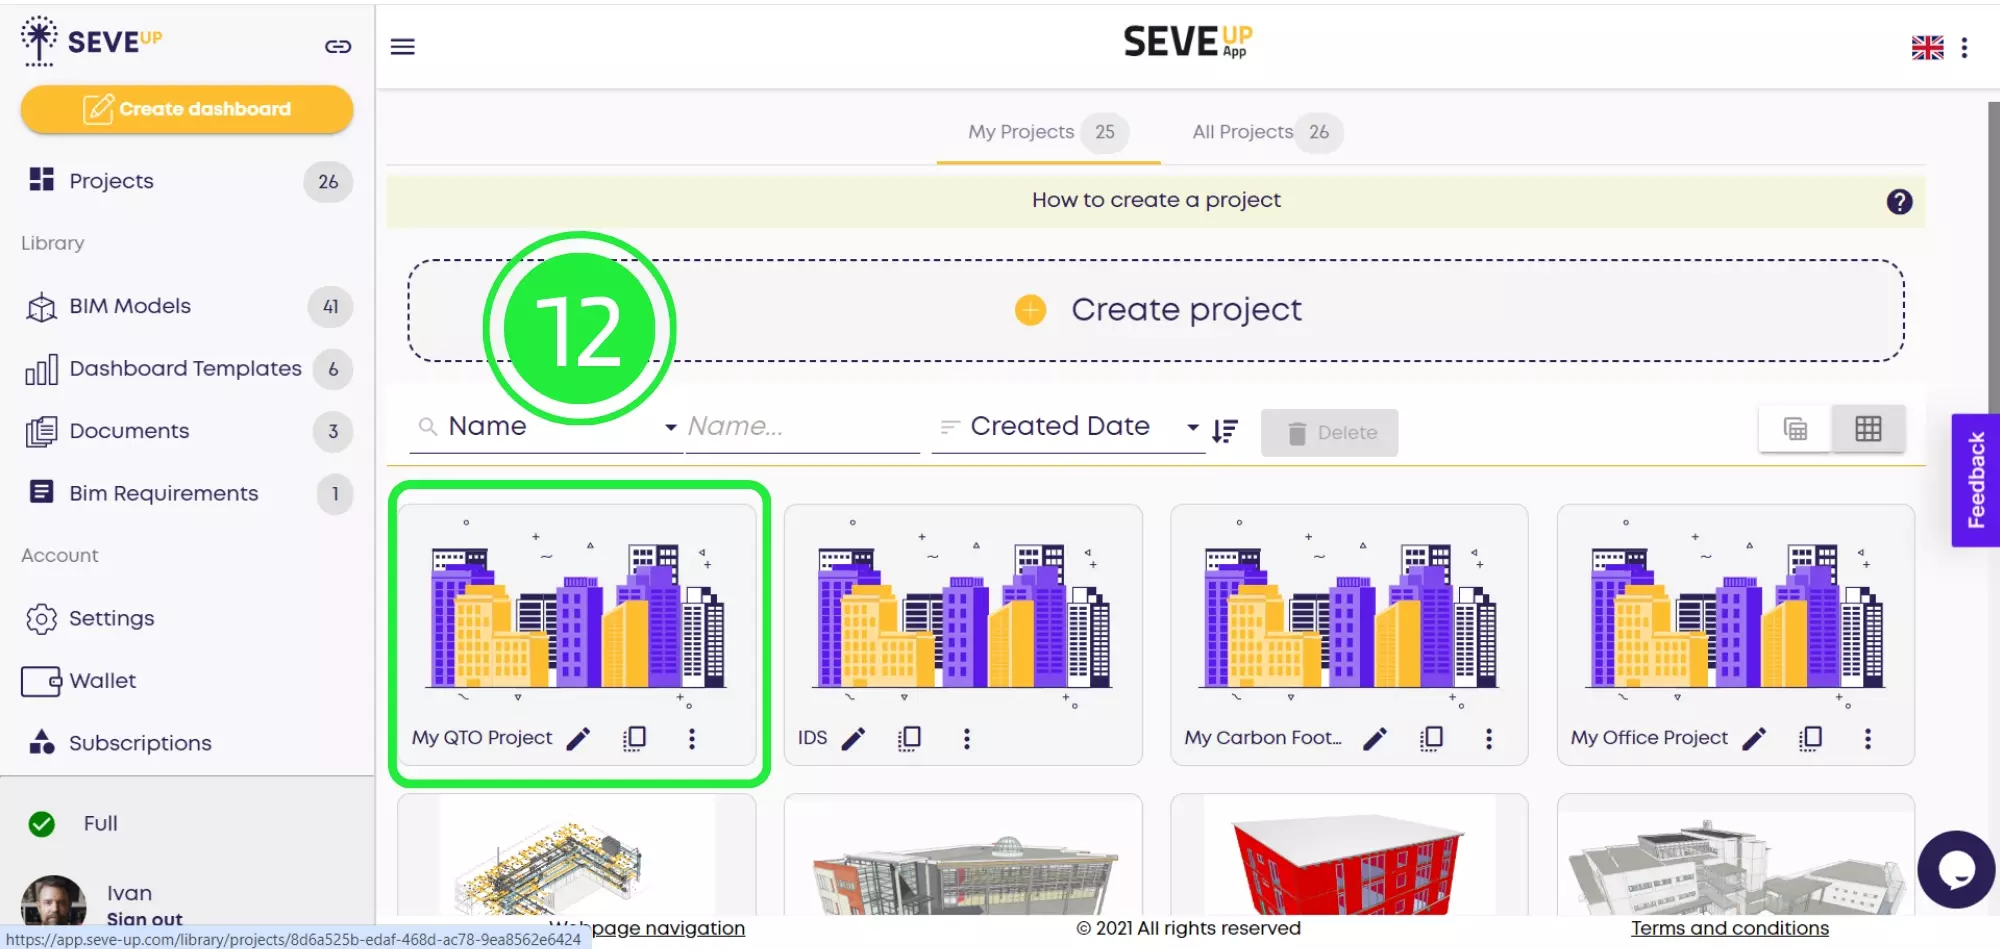
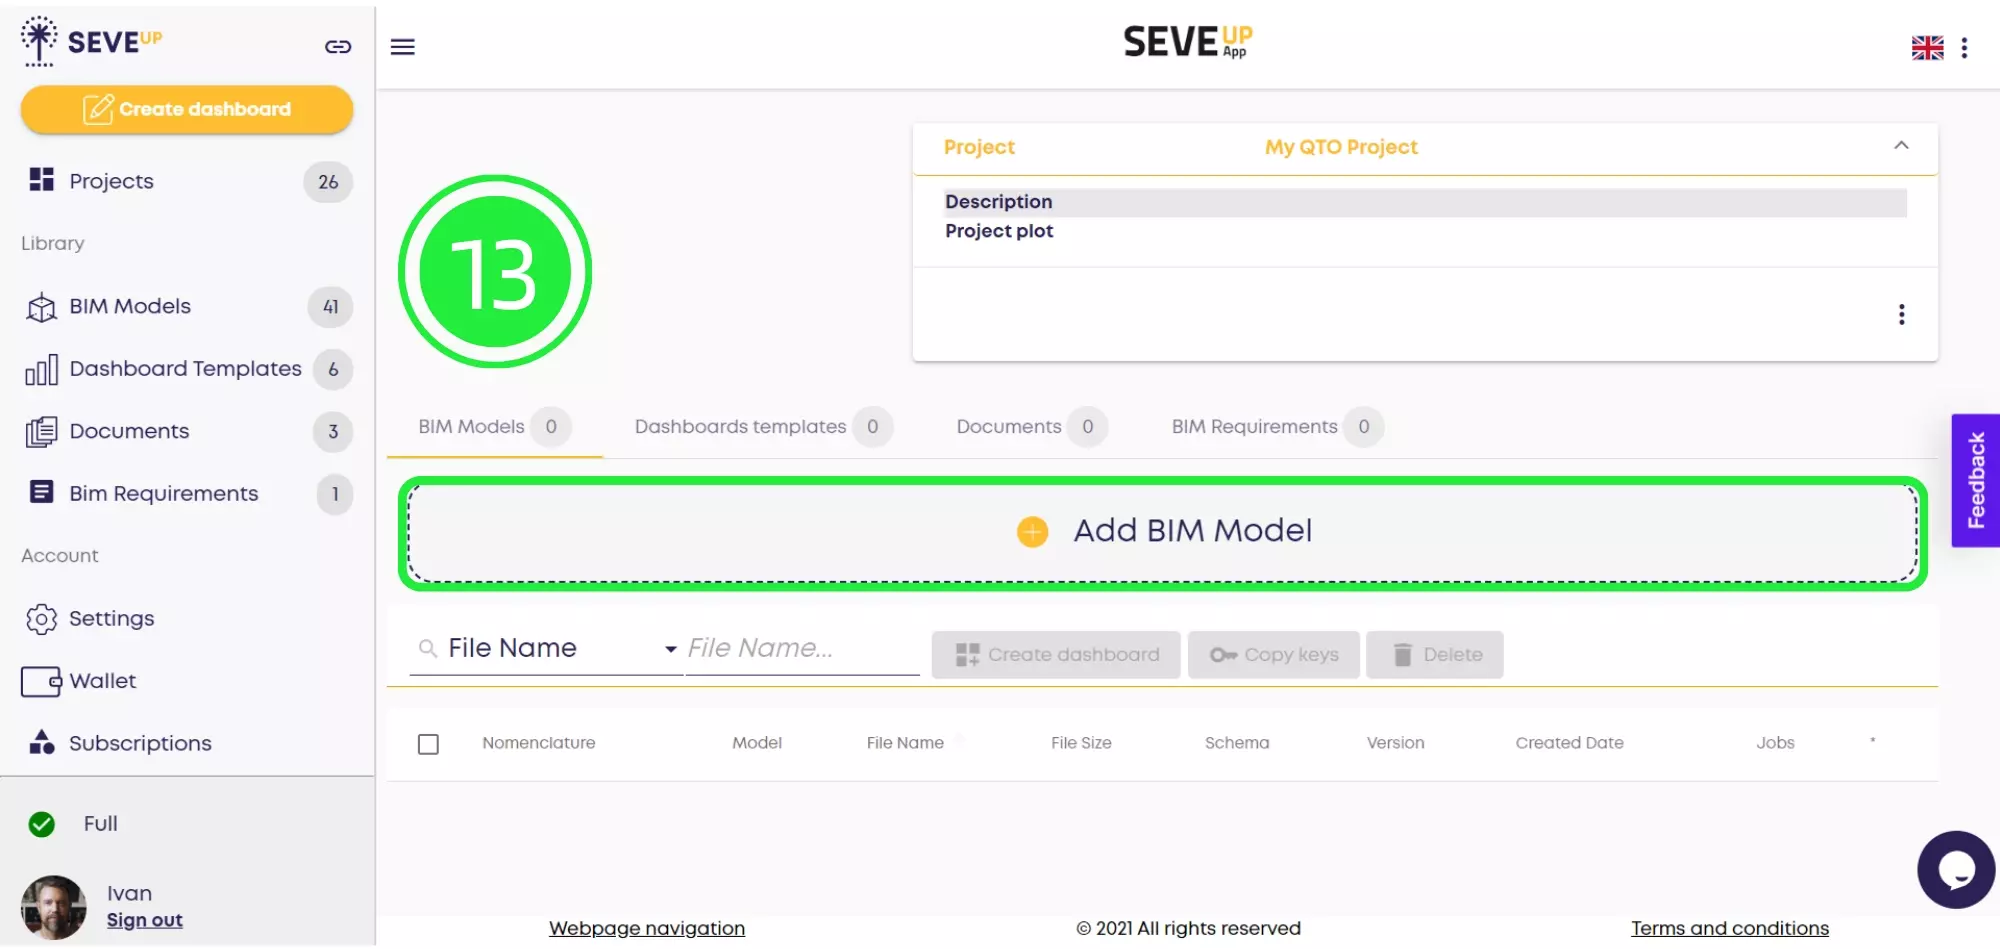
Begin your journey towards efficient construction project management by creating a free SeveUp account. This initial step is crucial for accessing the tools needed to develop a QTO Dashboard in Power BI, ensuring streamlined project analysis and decision-making.

Comprehensive Guide to Creating a QTO Dashboard in Power BI

How do I upload BIM Models on SeveUp App for QTO Dashboard Creation?

  • Firstly, open SeveUp to embark on your dashboard journey.

    Screenshot of the SeveUp App login page, the starting point for creating a dashboard.
  • Subsequently, navigate to “BIM Models” for crucial data integration.

    SeveUp App's homepage showcasing the 'BIM models' section, essential for dashboard development.
  • Thereafter, select “Upload BIM Model” for customizing your dashboard.

    The 'Upload BIM model' feature in SeveUp, crucial for creating a QTO Dashboard in Power BI.
  • Afterwards, utilize the “Attach File” feature for project-specific files.

    SeveUp's file attachment interface, showing the process for adding BIM models to a project.
  • Consequently, choose “Local Source” to ensure relevant data integration.

    Choosing 'Local Source' in SeveUp for project-specific data, a step towards an effective dashboard.
  • Additionally, select your BIM file for precise dashboard creation.

    The 'Open file' popup in SeveUp, highlighting file selection for dashboard integration.

How do I create a project on SeveUp App? The First Step to a Dynamic QTO Dashboard

  • Following this, begin project setup in SeveUp, laying the groundwork.

    Confirming the BIM model creation in SeveUp, a foundational step for a QTO Dashboard in Power BI.
  • Moreover, access the “Project” folder to manage dashboard elements.

    Accessing the 'Projects' folder in SeveUp, where dashboard creation begins.
  • Then, opt for “Create Project,” shaping your dashboard’s structure.

    Starting a new project in SeveUp, the initial phase of dashboard setup.
  • Afterwards, choose “New empty project” for a fresh start.

    Selecting 'New Empty Project' in SeveUp, preparing for QTO Dashboard in Power BI creation
  • Subsequently, finalize by clicking “Create,” a crucial step.

    SeveUp's 'Create Project' popup, where users begin crafting their dashboards.
  • Next, click on your new project, starting customization.

    Overview of a newly created project in SeveUp, ready for dashboard development.
  • Furthermore, add a BIM model to enhance your dashboard’s functionality.

    Adding a BIM model to a project in SeveUp, an essential step for dashboard accuracy
  • Thereafter, efficiently choose models “From the Library.”

    Selecting a BIM model 'From the Library' in SeveUp, crucial for detailed dashboards.
  • Besides, use the menu button in SeveUp for organization.

    SeveUp's 'Add BIM Model' popup menu, showcasing model selection for dashboards.
  • Not only…But also, utilize the “Sort” button for file management.

    Choosing sorting options in SeveUp, organizing BIM models for dashboard creation.
  • Including, select “Created Date” for the most recent files.

    Selecting 'Created Date' sorting in SeveUp for organizing BIM models.
  • Above all, choose your file, foundational for dashboard creation.

    The 'Pick Item' popup in SeveUp, confirming file selection for the QTO Dashboard in Power BI.
  • Subsequently, click “Create” to finalize your project setup.

    Finalizing BIM model addition in SeveUp, a critical step for dashboard creation.
  • After that, head to “Dashboard Templates” for layout selection.

    Accessing 'Dashboard Templates' in SeveUp, selecting layouts for effective dashboards.
  • Additionally, add a dashboard template to structure your analysis.

    The process of adding a dashboard template in SeveUp, crucial for visualizing data.
  • Importantly, select a template “From the Library” for professionalism.

    Choosing a dashboard template 'From the Library' in SeveUp, tailoring it for project needs.

How do I create my own dashboard? from the QTO template and my BIM data

  • Moreover, use the menu button for customizing your dashboard’s layout.

    SeveUp's 'Add Dashboard Template' popup menu, offering diverse layout options.
  • Specifically, choose “QTO Dashboard” for focused analysis.

    Confirming dashboard template selection in SeveUp, a step towards an insightful dashboard.
  • Lastly, confirm by clicking “Create,” finalizing your structure.

    Starting the dashboard creation process in SeveUp, building a custom visualization tool.
  • Not to mention, start the actual dashboard creation in SeveUp.

    Initiating the design process for a QTO Dashboard in Power BI in SeveUp.
  • Conclusively, begin your design process, tailoring it to your needs.

    Selecting a specific project for dashboard creation in SeveUp, aligning with project goals.
  • Furthermore, select the project for aligning with specific goals.

    Opting for 'Select Existing Project' in SeveUp, ensuring continuity in dashboard design.
  • Moreover, choose “Select Existing Project” for continuity.

    Utilizing 'Search filters' in SeveUp for efficient project selection.
  • Additionally, use “Search filters” for efficient project selection.

    Confirming project selection in SeveUp for dashboard creation, focusing on specific data.
  • Subsequently, pick the QTO project, centralizing your focus.

    Selecting a dashboard template in SeveUp, shaping the visual aspect of the data analysis.
  • Afterwards, click “Next” to progress in setup.

    Choosing a BIM model for the dashboard in SeveUp, ensuring data accuracy.
  • Then, select your dashboard template, shaping its visual aspect.

    Generating a dashboard in SeveUp, a key step in visualizing construction project data.
  • Also, pick your BIM model for detailed data representation.

    Saving progress in SeveUp, securing the development of a detailed dashboard.
  • Finally, click “Get your Dashboards!” to complete setup.

    Opening Power BI Desktop, a crucial tool for enhancing a QTO Dashboard in Power BI.
  • Thereafter, save your BIM dashboard, securing your development.

    Using Power BI's 'File' pane to browse and select the right dashboard file.

How do I open the file in Power BI Desktop?

  • Subsequently, launch Power BI Desktop for advanced analytics.

    Selecting the appropriate file type in Power BI for dashboard compatibility.
  • Afterward, use the “Browse” feature for file selection.

    Choosing the 'My New Project' file in Power BI, preparing for dashboard loading.
  • Furthermore, adjust the file type for Power BI format compatibility.

    Loading a QTO dashboard in Power BI, visualizing construction project analytics.
  • Next, select your dashboard file, bringing data into Power BI.

    Saving a newly created dashboard in Power BI, ensuring data preservation.
  • Then, load your dashboard, visualizing project data.
  • Additionally, access file options in Power BI for customization.

    Using Power BI's 'Save As' option to secure the QTO dashboard.
  • Subsequently, save your work as a new file, preserving progress.

    Publishing a QTO Dashboard in Power BI, sharing insights with team members.

How do I publish my Power BI dashboard online? Sharing Insights with Your Team

  • Lastly, prepare for dashboard publishing, making it accessible.

    Selecting a workspace in Power BI for dashboard publishing, ensuring right audience reach
  • Thereafter, make your selection for publishing, determining accessibility.

    Completing the dashboard publishing process in Power BI, making it accessible to stakeholders.
  • Subsequently, open your dashboard in Power BI for review.

    Exploring 'Embed report and Publish to web' options in Power BI for dashboard sharing.
  • Afterwards, access publishing options, setting up for sharing.

    Confirming web publishing of the dashboard in Power BI, expanding its accessibility.
  • Finally, continue to the publishing step, making it public.

    Sharing the QTO Dashboard in Power BI through the 'Copy' option for wider dissemination

How do you embed HTML code in Power BI?

  • Firstly, click on ‘File’, then select ‘Embed report and publish to web’ in Power BI.

    Viewing the finalized QTO Dashboard in Power BI Service, showcasing detailed project data.
  • Subsequently, ensure data will be public and click on ‘Continue’ to confirm.

    Analyzing 'Quantities' in the QTO Dashboard in Power BI, gaining insights into project metrics.
  • Next, click on ‘Publish’ to proceed with making your dashboard publicly accessible.
    Selecting 'Space' in the QTO Dashboard within Power BI for detailed area analysis.
  • Finally, copy the provided link and paste it into a new window of your favorite web browser to view.
    Conducting 'Level 2' analysis in the QTO Dashboard in Power BI, delving into detailed data.


  • Power BI Service showing an open SeveUp project, ready for QTO Dashboard in Power BI analysis.

Utilizing Your Dashboard for Quantitative Analysis

  • Firstly, click on “Quantities” to start analysis in Power BI.

    The 'Quantities' tab highlighted in Power BI with an open SeveUp project for QTO Dashboard in Power BI insights.
  • Subsequently, select “Space” for a detailed project area examination.

    Space' selection in Power BI with SeveUp project, a key feature of the QTO Dashboard in Power BI
  • Moreover, opt for “Level 2” for deeper data analysis.

    Display of 'Level 2' in Power BI with an open SeveUp project, enhancing the QTO Dashboard in Power BI.
  • Consequently, update your dashboard views for latest insights.

    The 'Update' button in Power BI for SeveUp projects, crucial for refreshing the QTO Dashboard in Power BI
  • Additionally, utilize the “Show All” feature for a complete overview.

    Show All' option in Power BI with SeveUp project, a comprehensive view feature of the QTO Dashboard in Power BI.
  • Finally, reset filters for unbiased data analysis in Power BI.

    The 'Brush' icon in Power BI for SeveUp projects, useful for customizing the QTO Dashboard in Power BI.

Advanced Property Analysis with Your Dashboard

  • Initially, click on “Properties” for a focused Power BI analysis.

    Properties' tab highlighted in Power BI with an open SeveUp project, integral to the QTO Dashboard in Power BI.
  • Subsequently, select “Light fixture” for detailed property review.

    Light Fixture' display in Power BI with SeveUp project, a detailed component of the QTO Dashboard in Power BI.
  • Moreover, explore “LightFixtureTypeCommon” for thorough assessment.

    Pset_Light_FixtureTypeCommon' with '+' sign in Power BI for SeveUp project, part of the QTO Dashboard in Power BI analysis
  • Additionally, click on “+” for expanded references and analysis.

    Reference' and '+' sign in Power BI for SeveUp project,
  • Consequently, update your dashboard for new insights.

    Update' button in Power BI for SeveUp project visual updates
  • Next, access “Tooltip” for enhanced data visibility.

    Tooltip' icon in Power BI for SeveUp project
  • Lastly, select specific assets for targeted Power BI analysis.

    Tooltip information in Power BI for SeveUp project, crucial for asset details in the QTO Dashboard in Power BI

Conclusion : Enhance Your Dashboard Experience with SeveUp

Conclude by creating a SeveUp account. It enhances your Power BI dashboard experience. This step ensures access to advanced features for project management.

You will also like …

SeveUp App Tutorials 8 July 2024

How to quickly organise your measures in Power BI

🎓 Free BIM Checker Training Learn how to automate your BIM model checks and get certified. Register for Free Click

Learn More
SeveUp App Tutorials 1 July 2024

How to Easily and Quickly Merge Multiple IFC Files

🎓 Free BIM Checker Training Learn how to automate your BIM model checks and get certified. Register for Free Click

Learn More
SeveUp App Tutorials 24 June 2024

Download Data from IFC Fast

🎓 Free BIM Checker Training Learn how to automate your BIM model checks and get certified. Register for Free Choose

Learn More