Trusted by companies
all over the world:
In this tutorial, we'll be focusing on a powerful feature: Optimize Your BIM Workflow with Custom Level Selection, which will illuminate the intricate relationships between different classes.
Selecting an asset within your BIM model not only highlights that specific asset but also reveals all assets on the same storey and those with spatial relationships. This is the essence of partitioning, a concept that brings clarity and depth to your BIM viewing experience.
Through the Spatial tree and Technical tree relationships, SeveUp empowers users to create partition views effortlessly. By leveraging this feature, you gain a comprehensive understanding of asset relationships, ultimately streamlining your BIM process.
By the end of this tutorial you’ll be able to unravel the complexities of BIM visualization and discover how partitioning with SeveUp in Power BI can revolutionize your workflow.
Learn how to automate your BIM model checks and get certified.
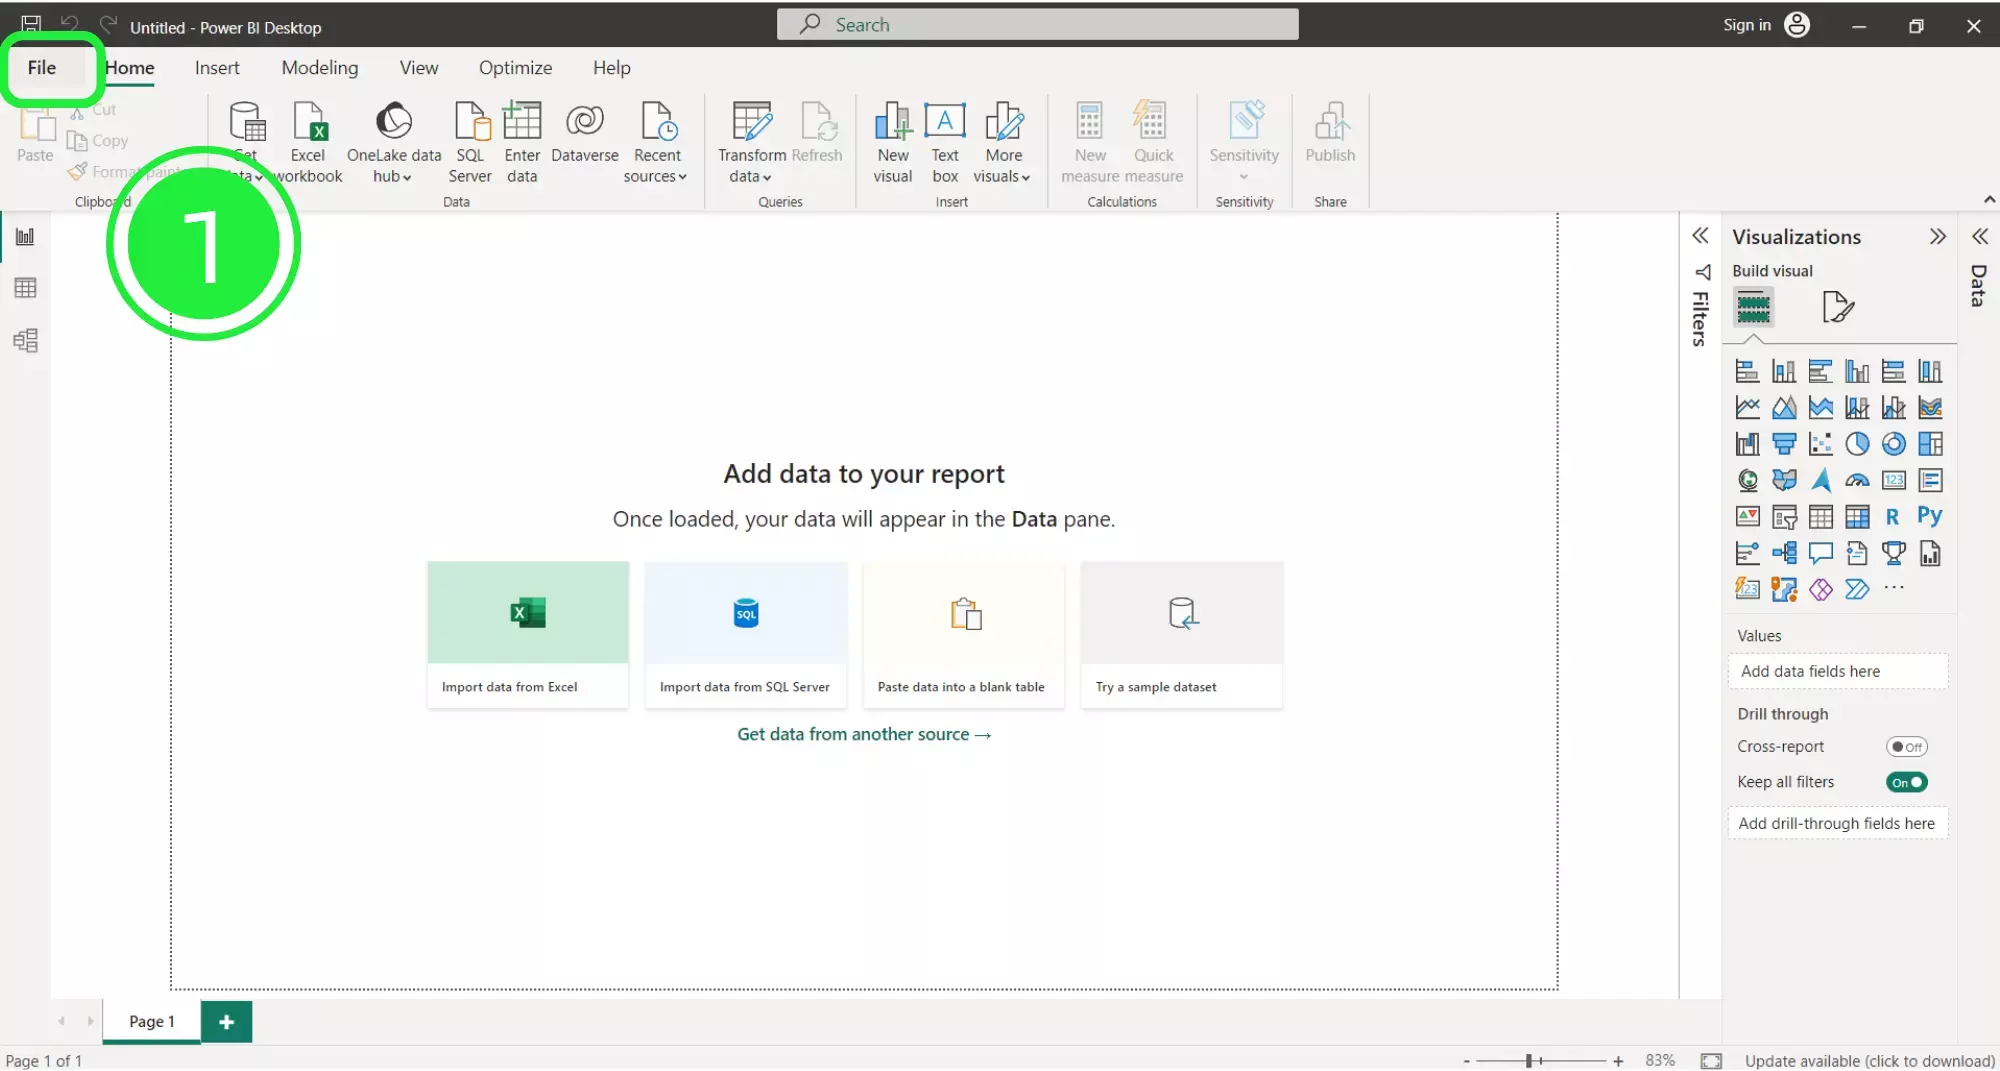
The first step to optimize your BIM workflow with custom Level Selection is to open up Microsoft Power BI and click on “File” on the top left of the page.
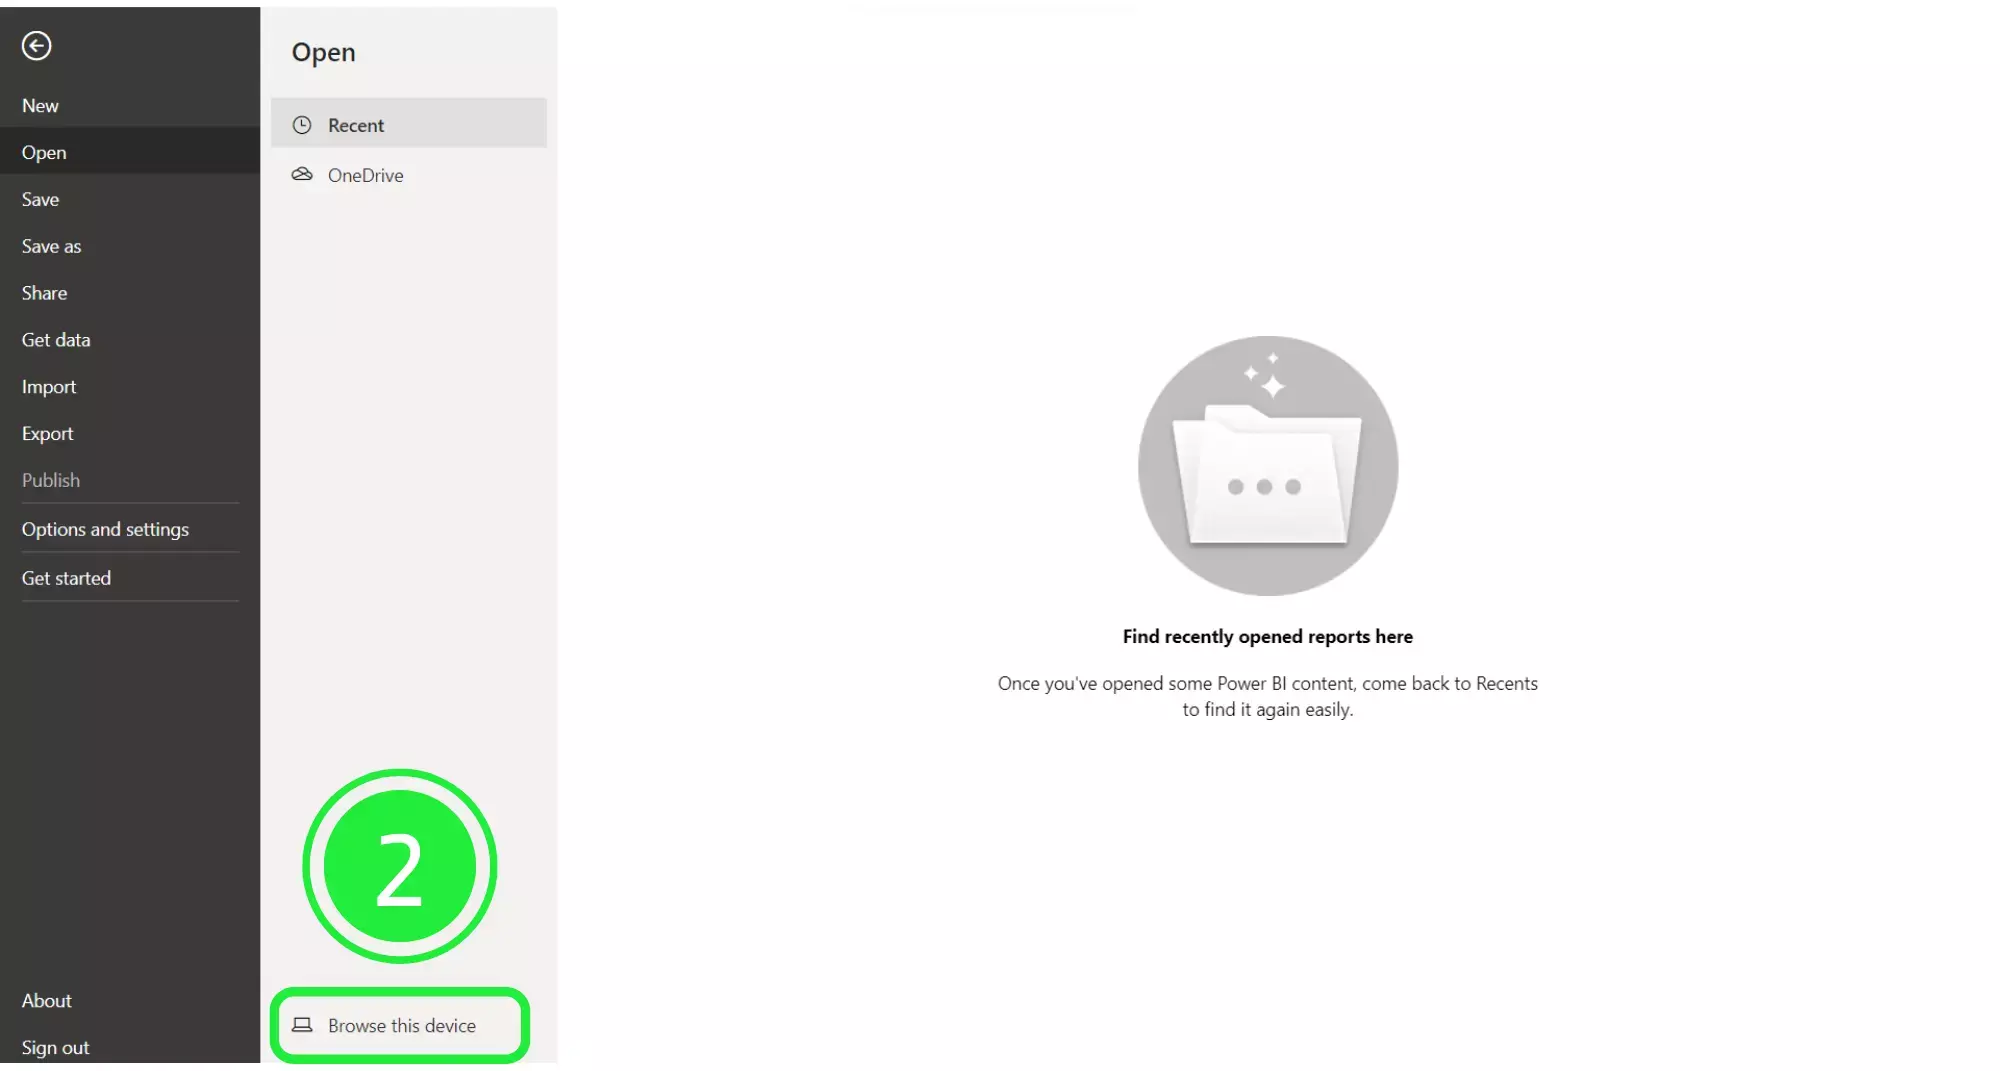
,A menu will open up. Subsequently, press the “Browse this device” button at the bottom of the screen to search for your newly downloaded dashboard.
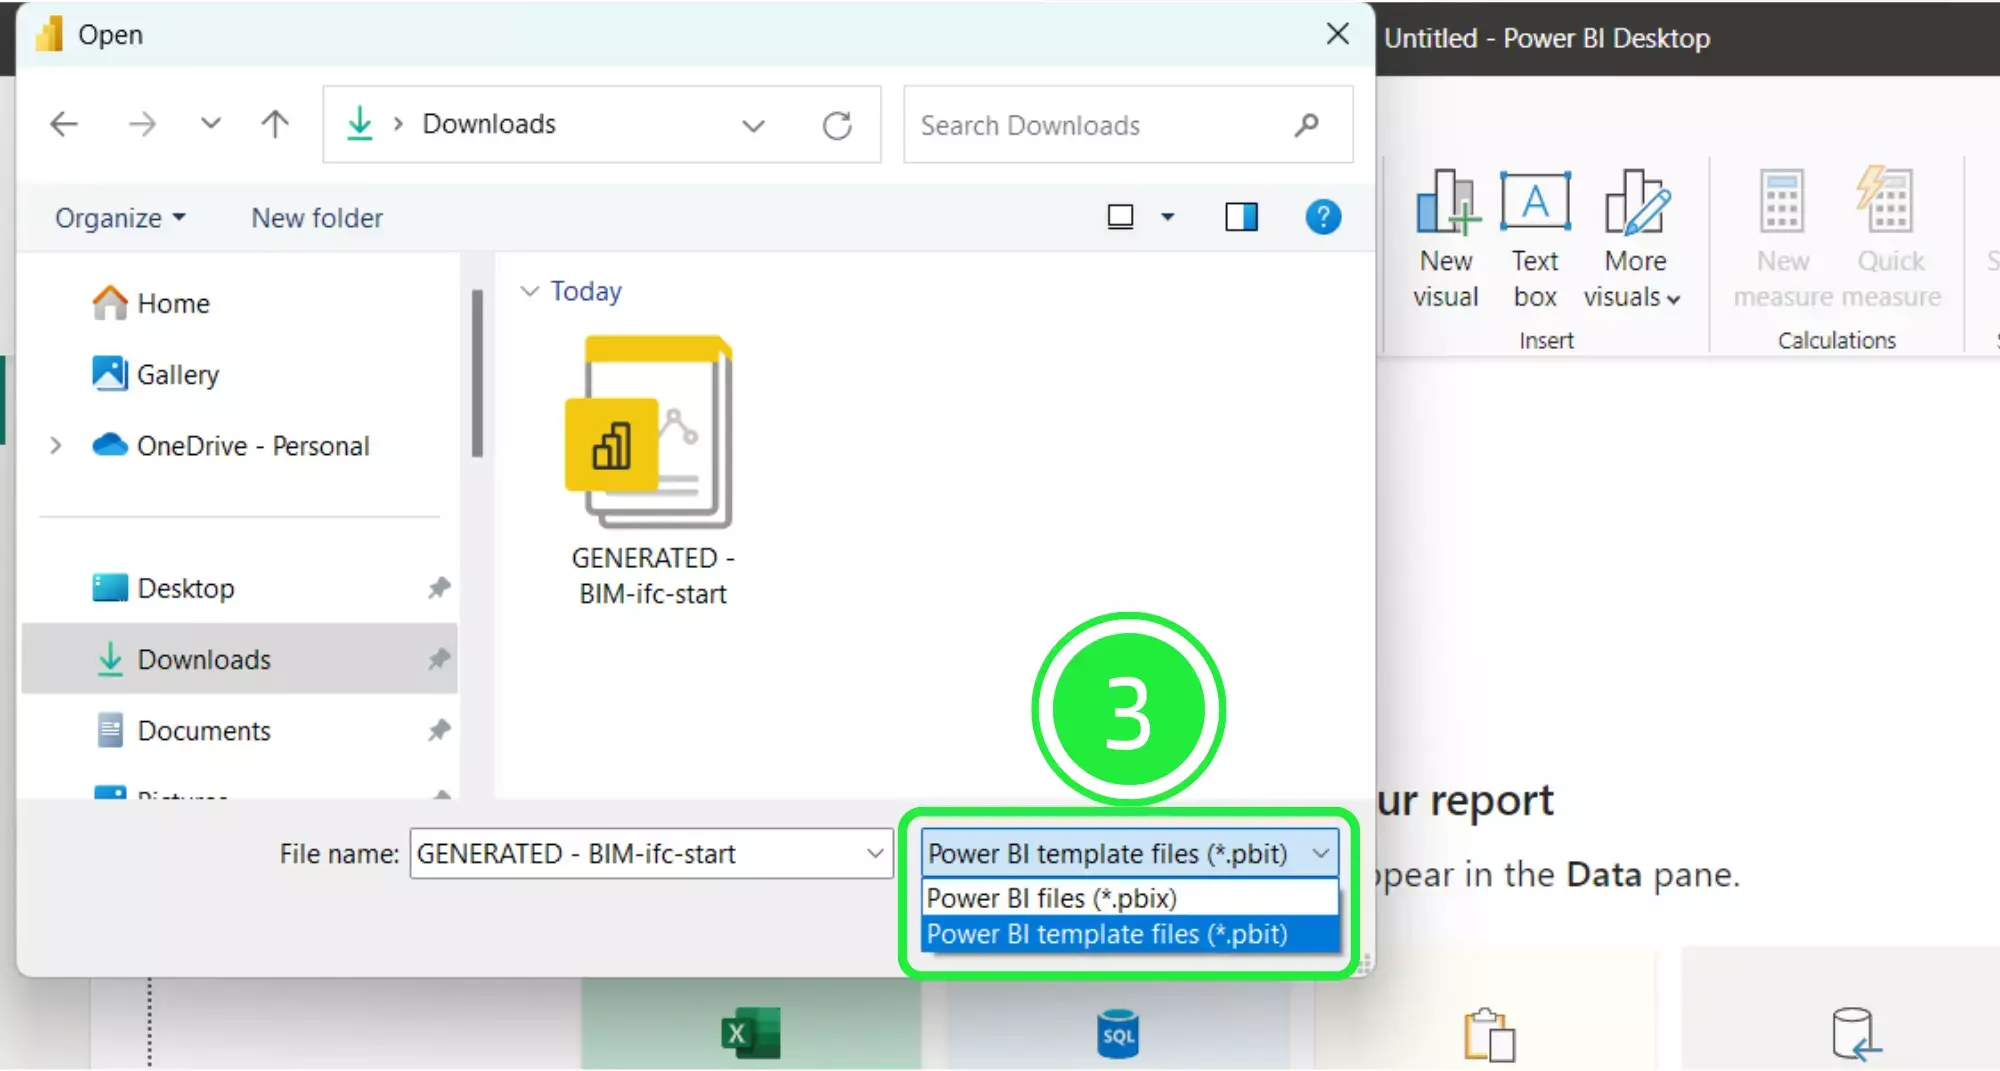
Navigate to the bottom right and choose the correct file extension. Select “Power BI Template Files (*pbit), so that any files of this type will now show in the window.
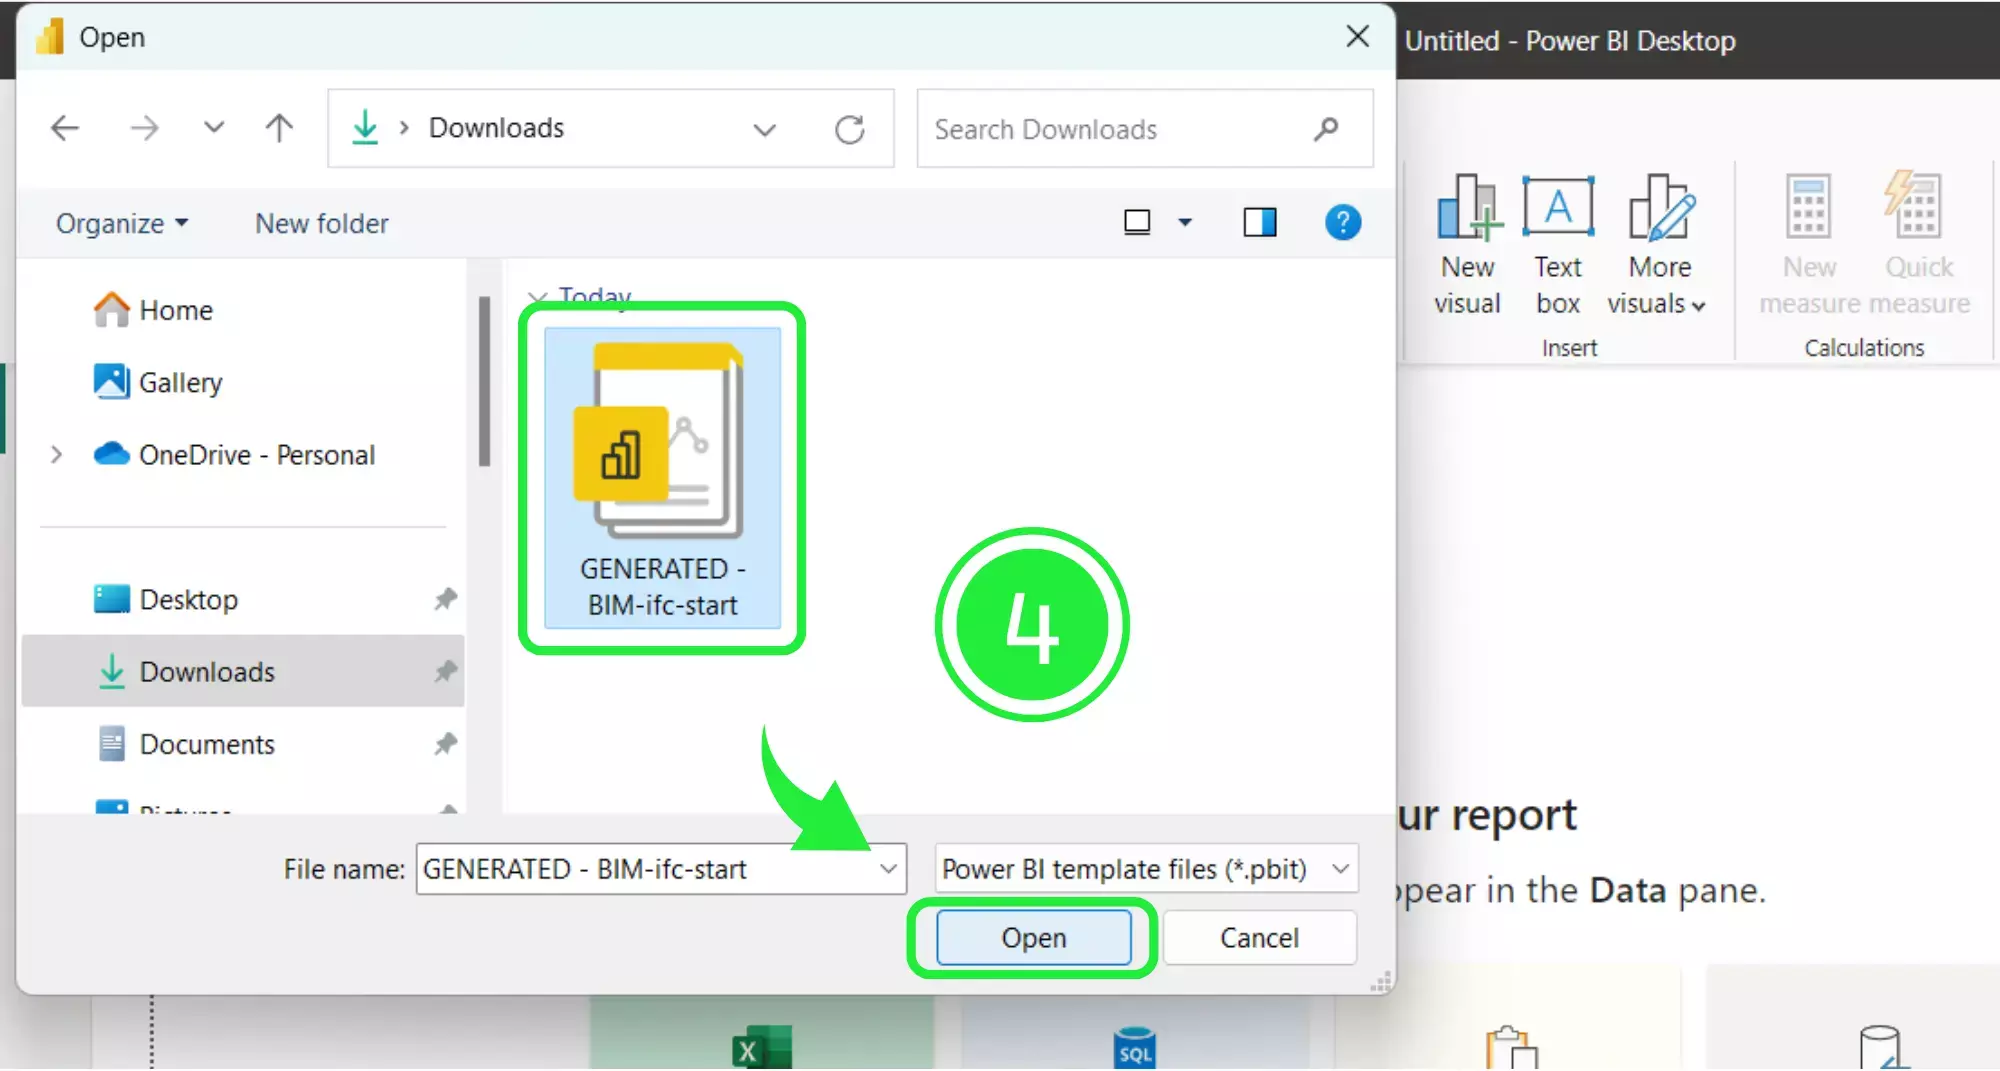
Select your newly downloaded template file and then activate “Open”.
To finish this first step: a pop-up will appear showing the file details. Access “Load” and your Dashboard Template file will start to load in Microsoft Power BI.
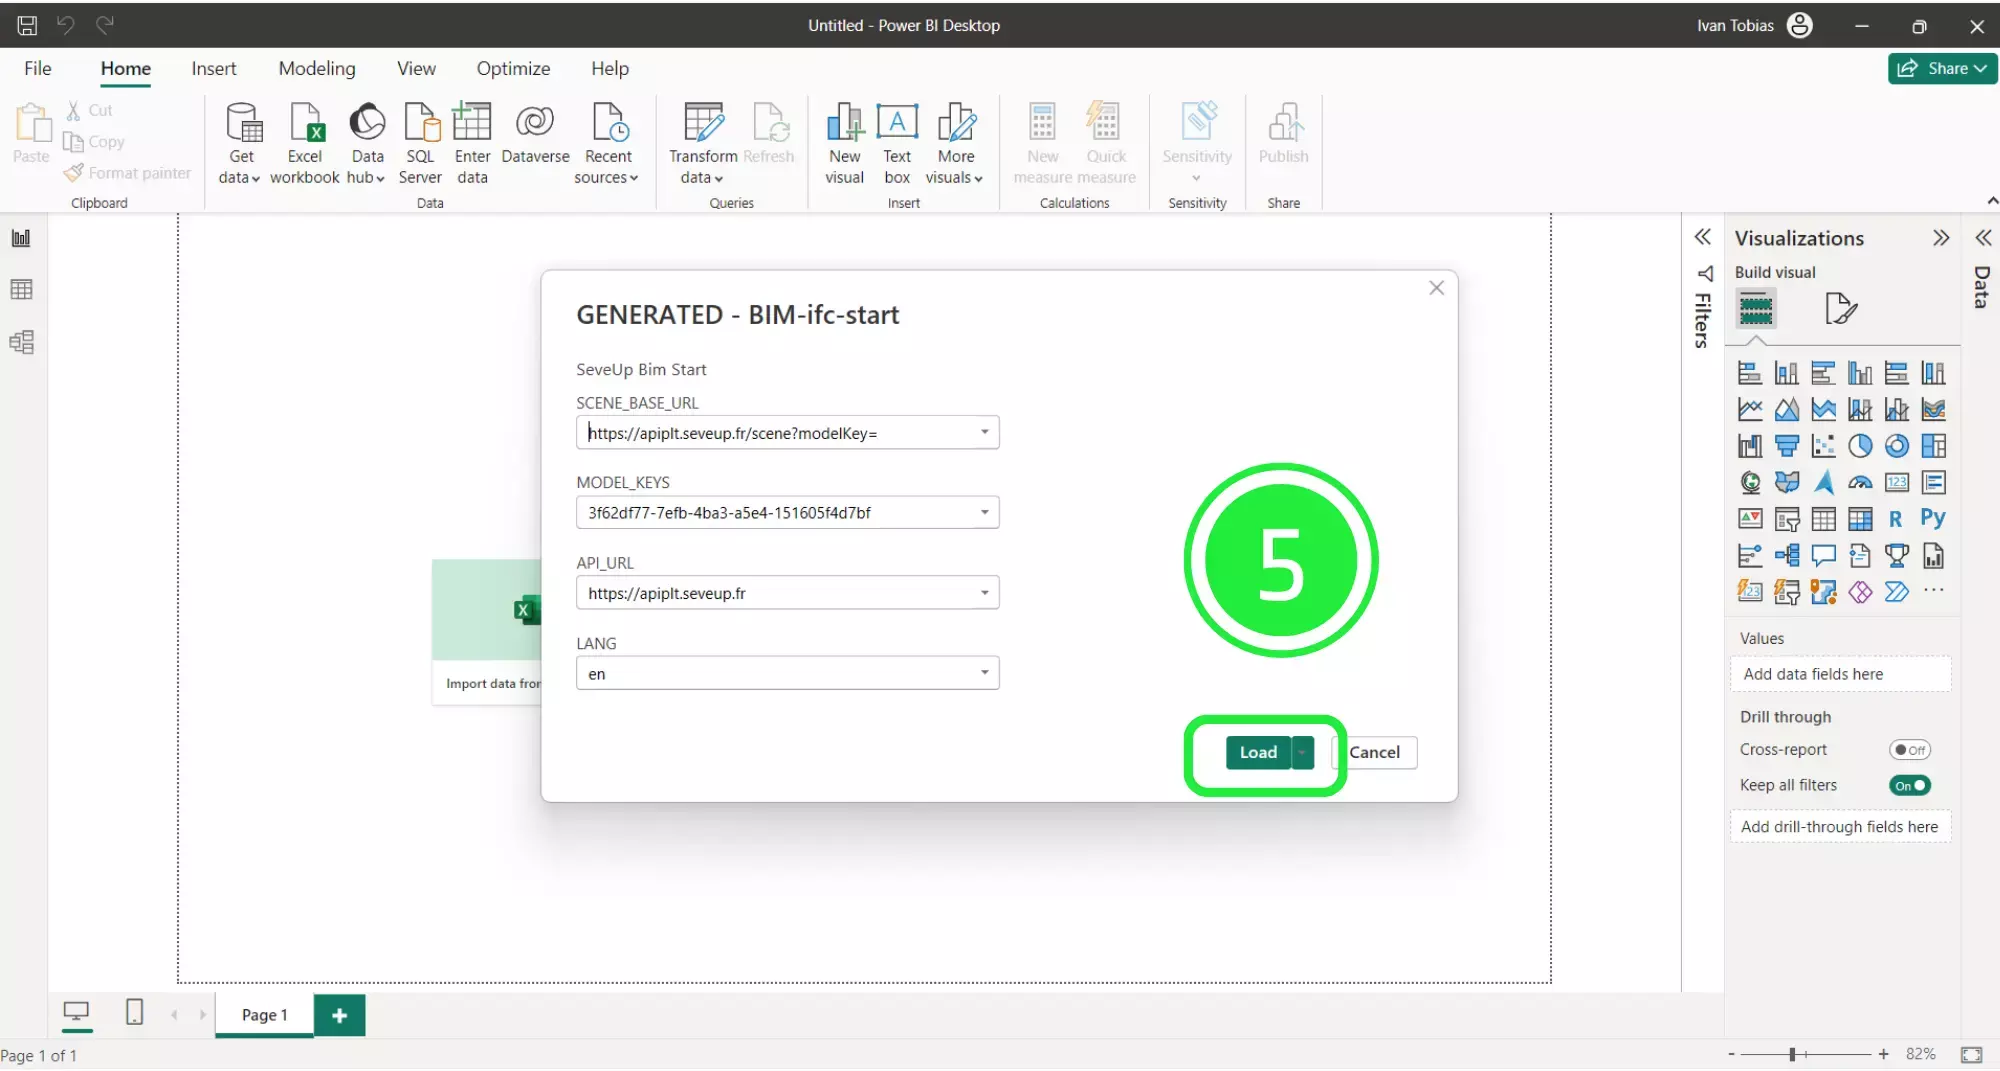
Once your new dashboard template has loaded, it will populate the Power BI interface with all of the BIM data that was in the files you added.
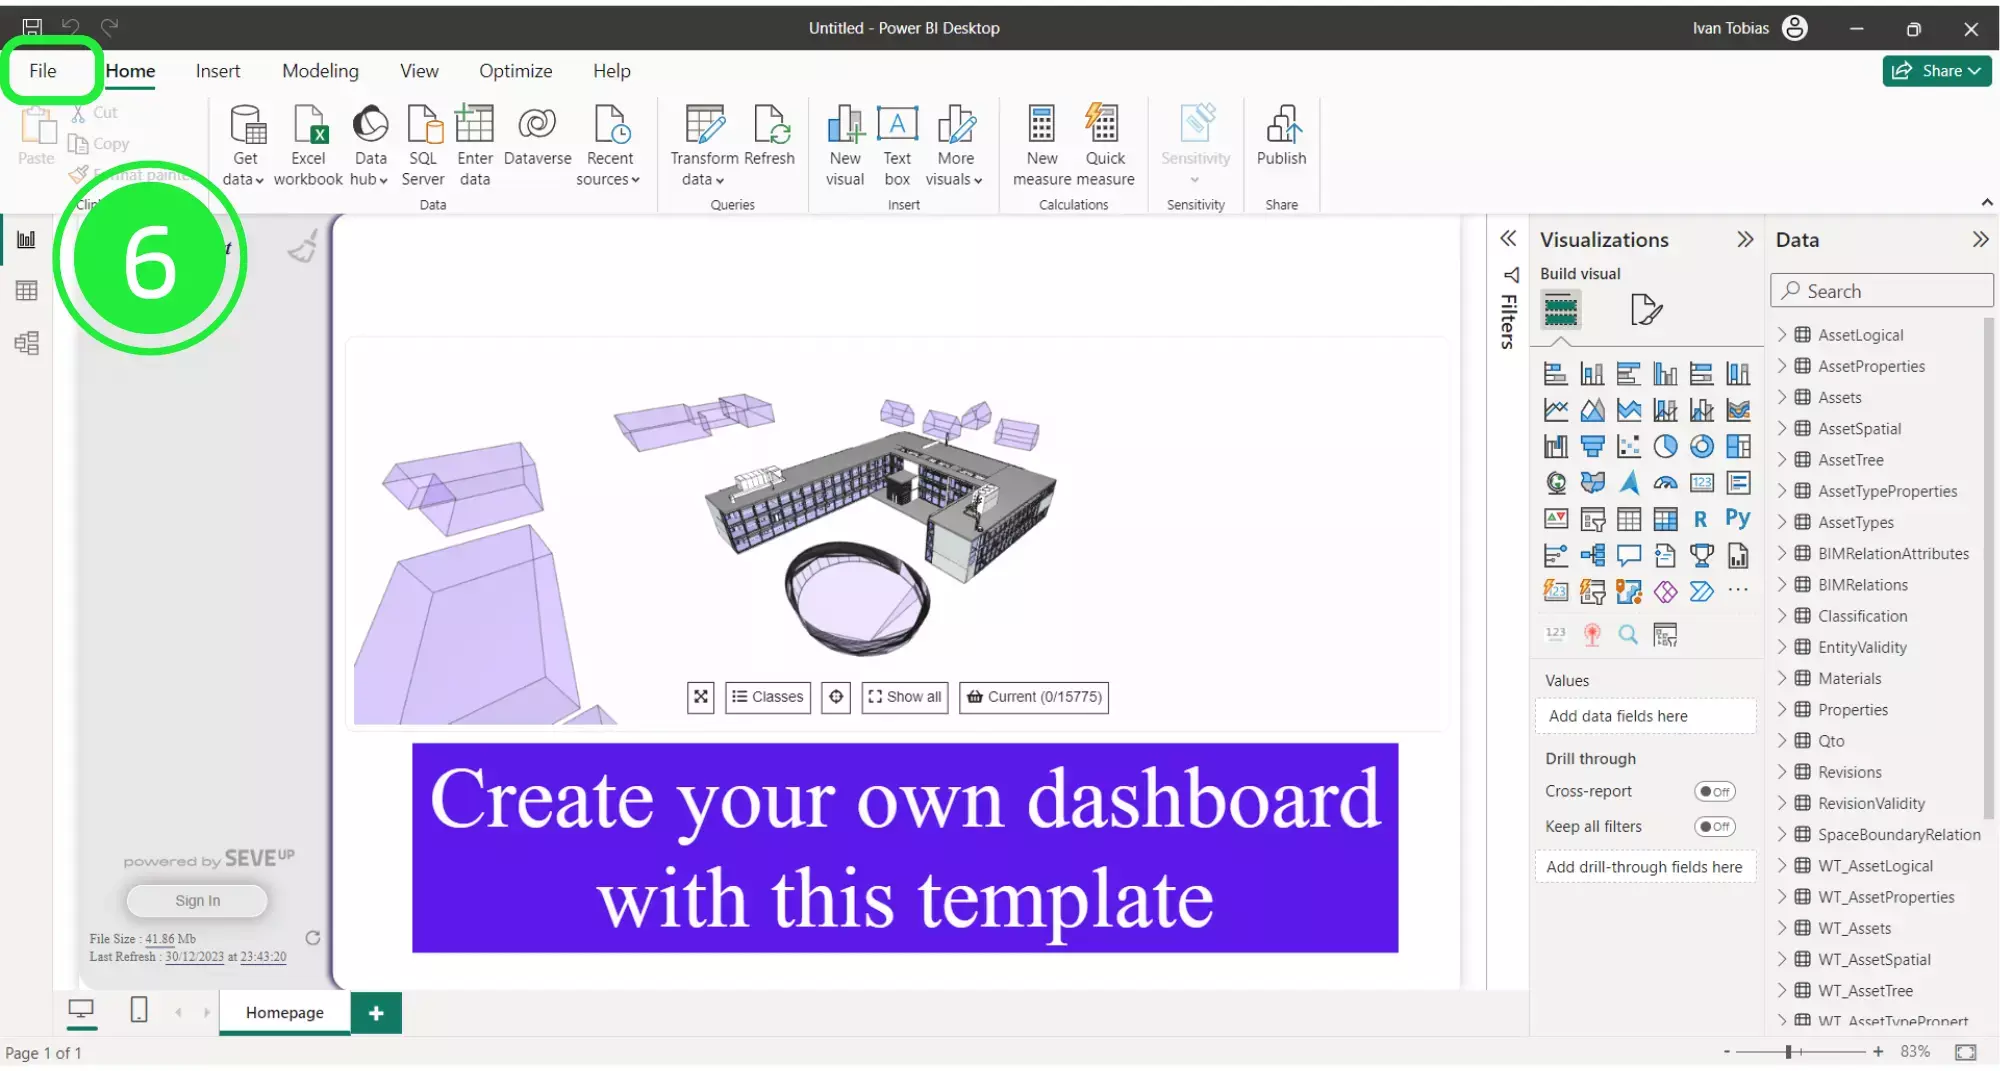
Next, in order to build the template in Power BI, first save it as a Power BI file (.pbix). To do this click on “File” in the top left corner of the page.
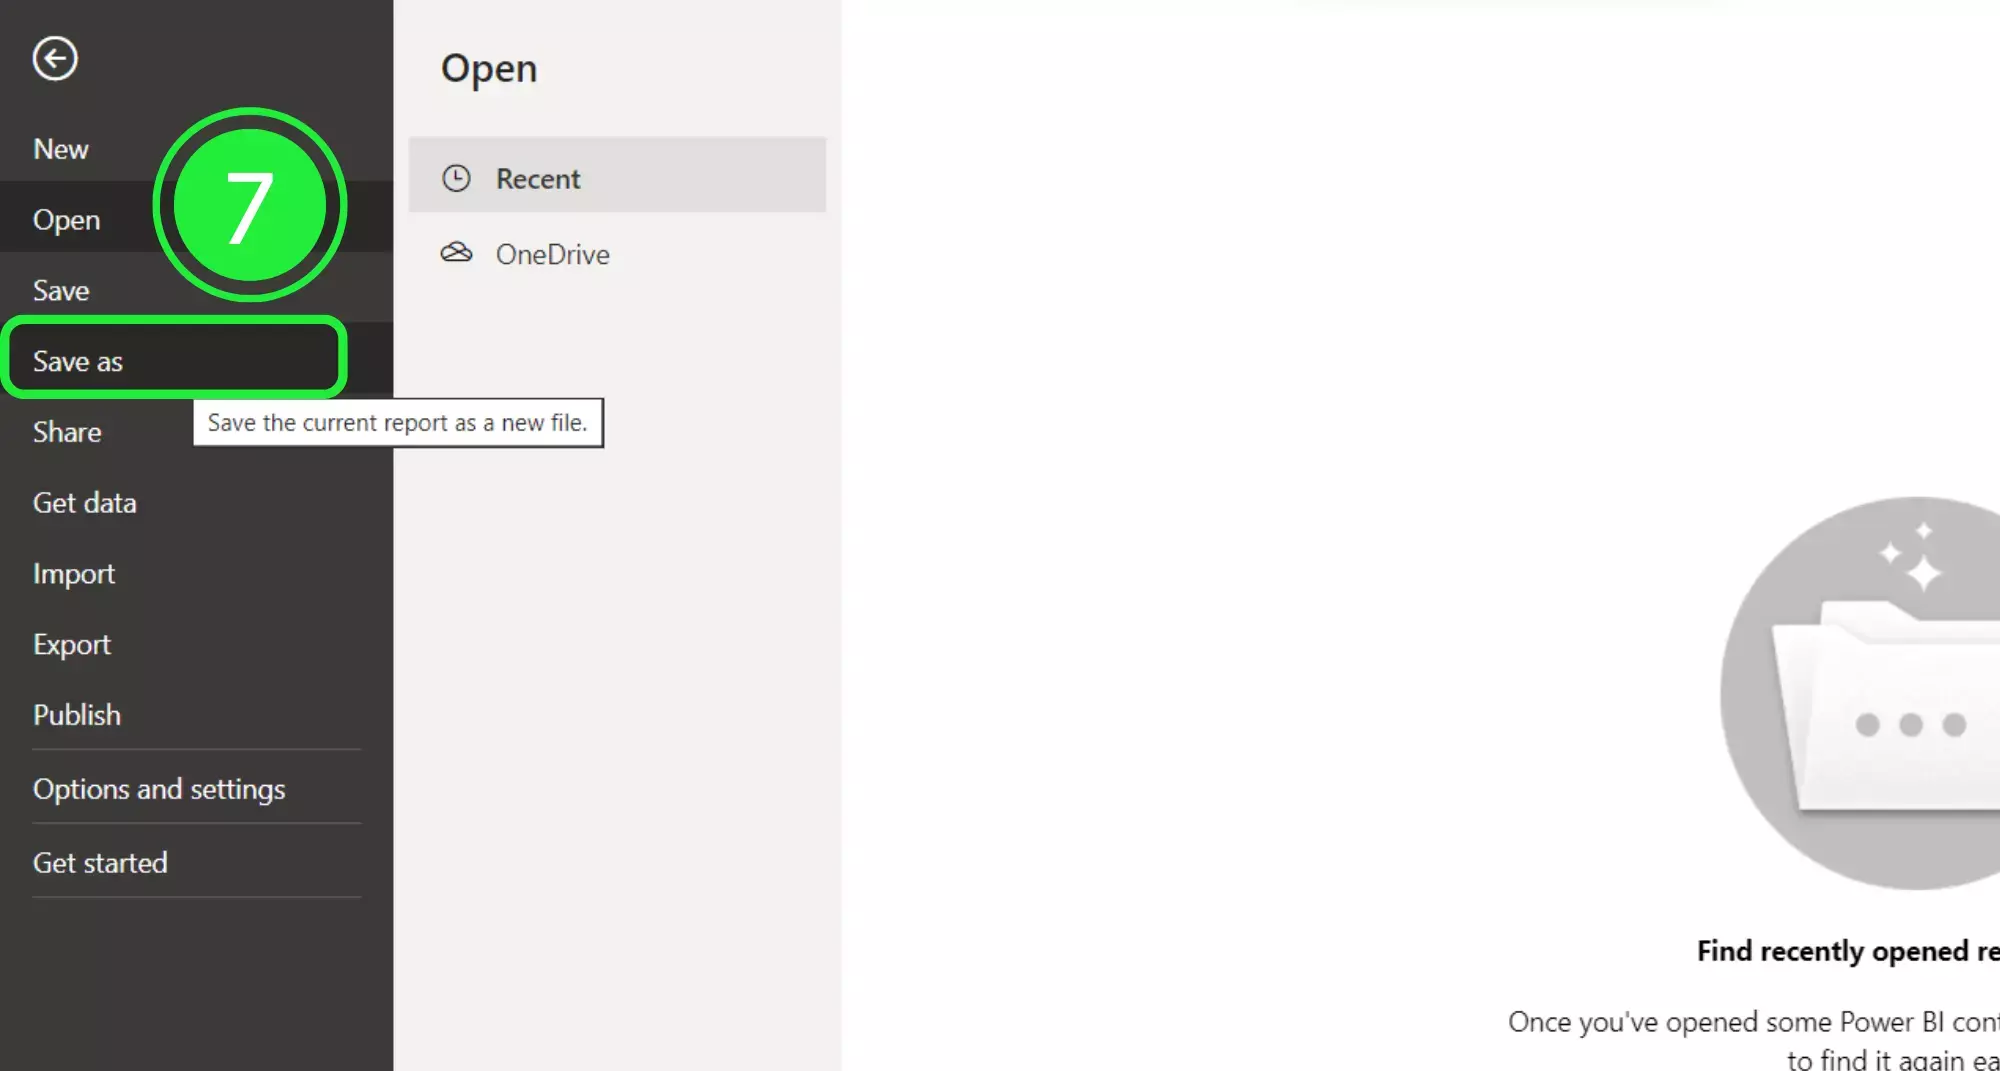
Next, select “Save As” in order to save your file.
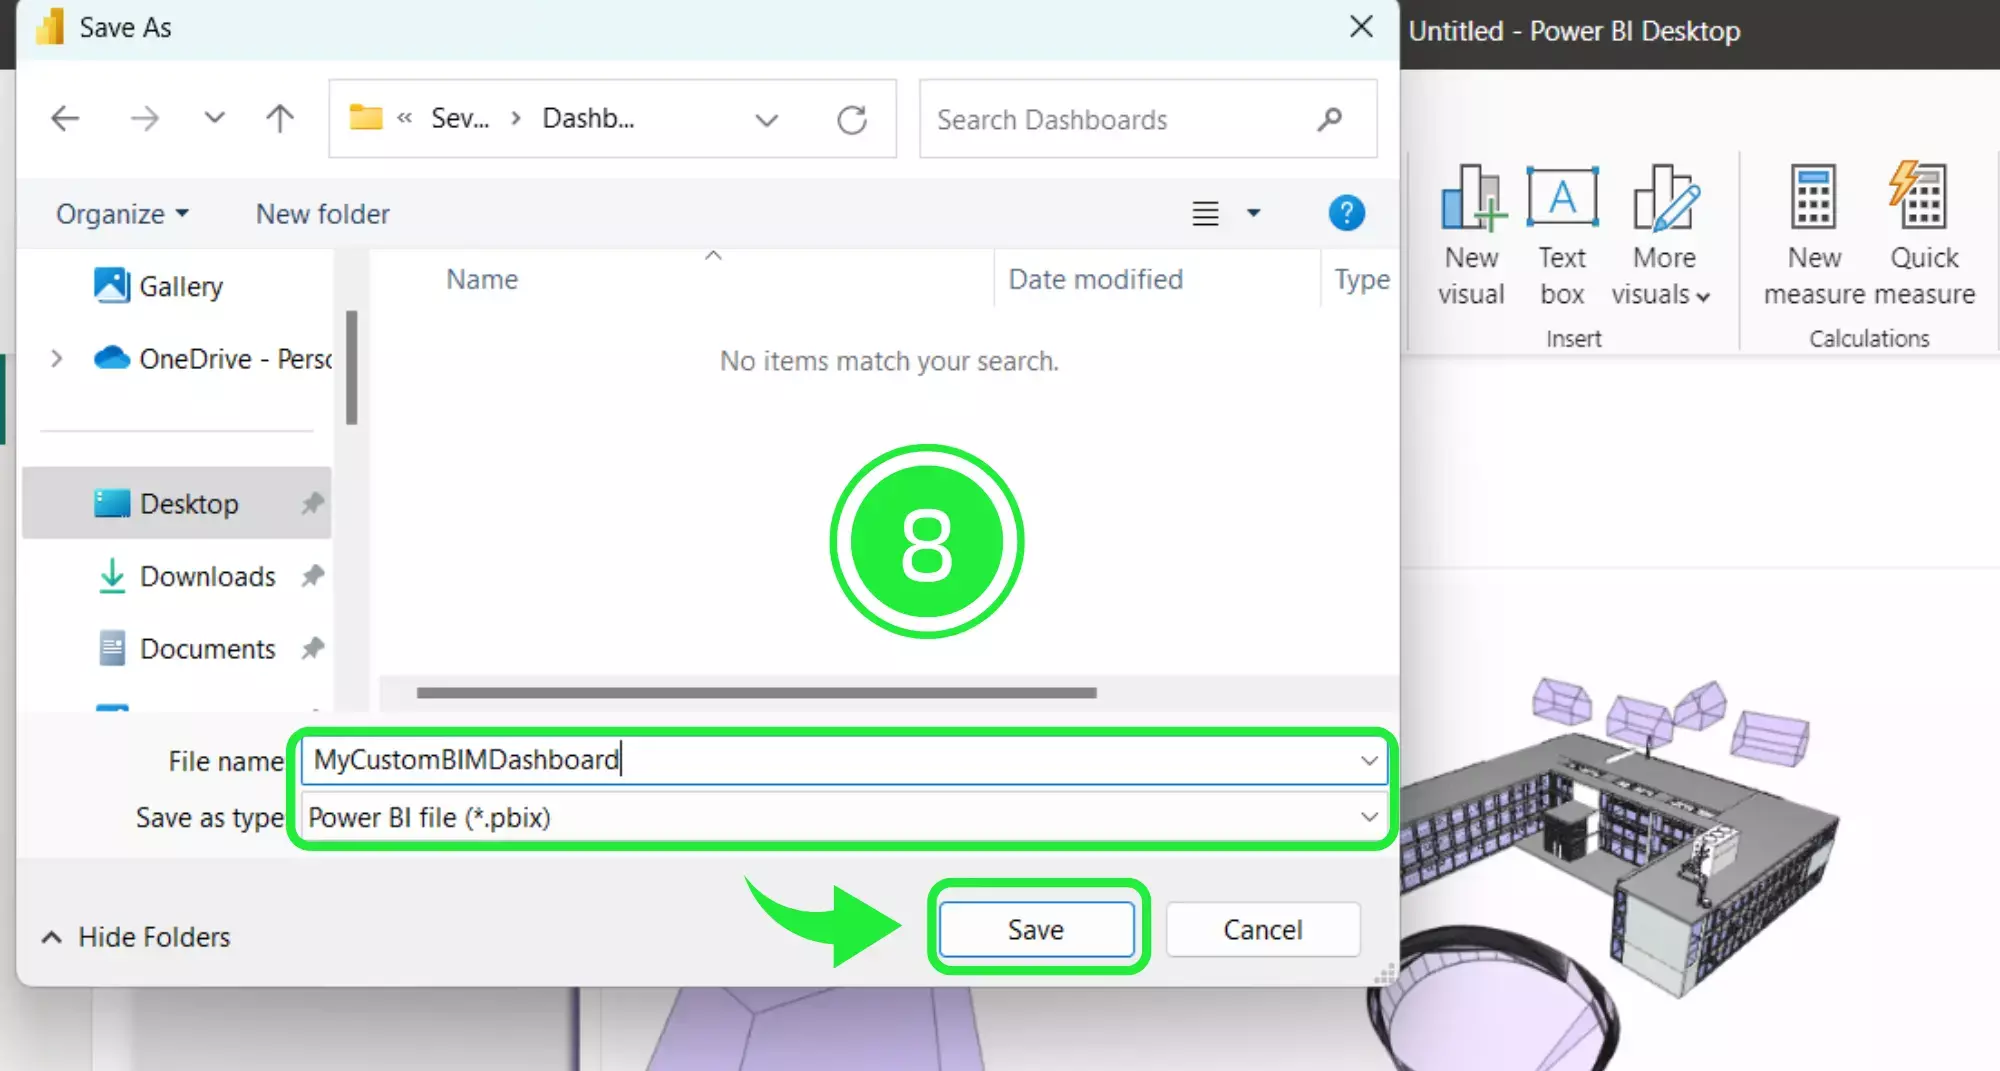
Additionally, choose an appropriate name for your file and then engage the “Save” button.
In the centre of the report you’ll find the SeveUp 3D BIM viewer. This is an interactive and responsive BIM Viewer that allows you to explore your project in depth.
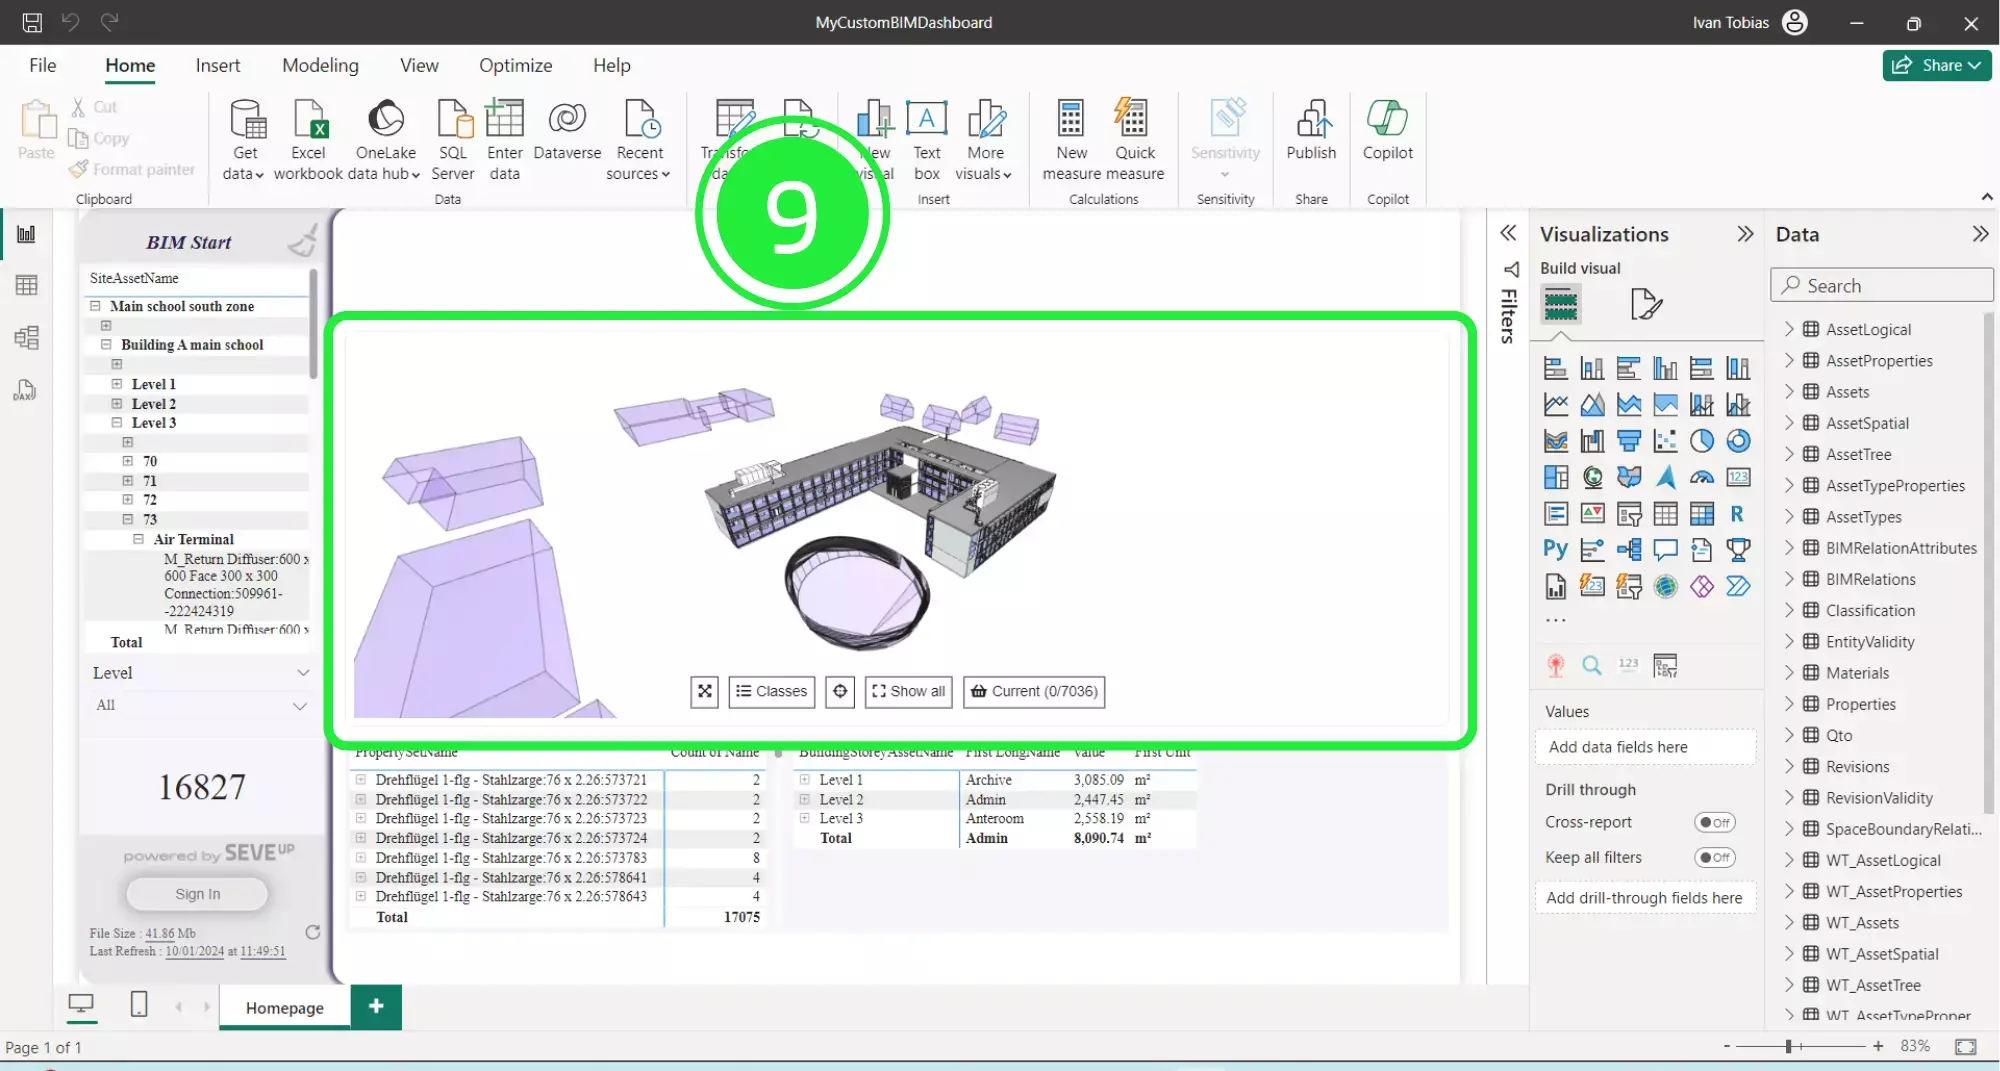
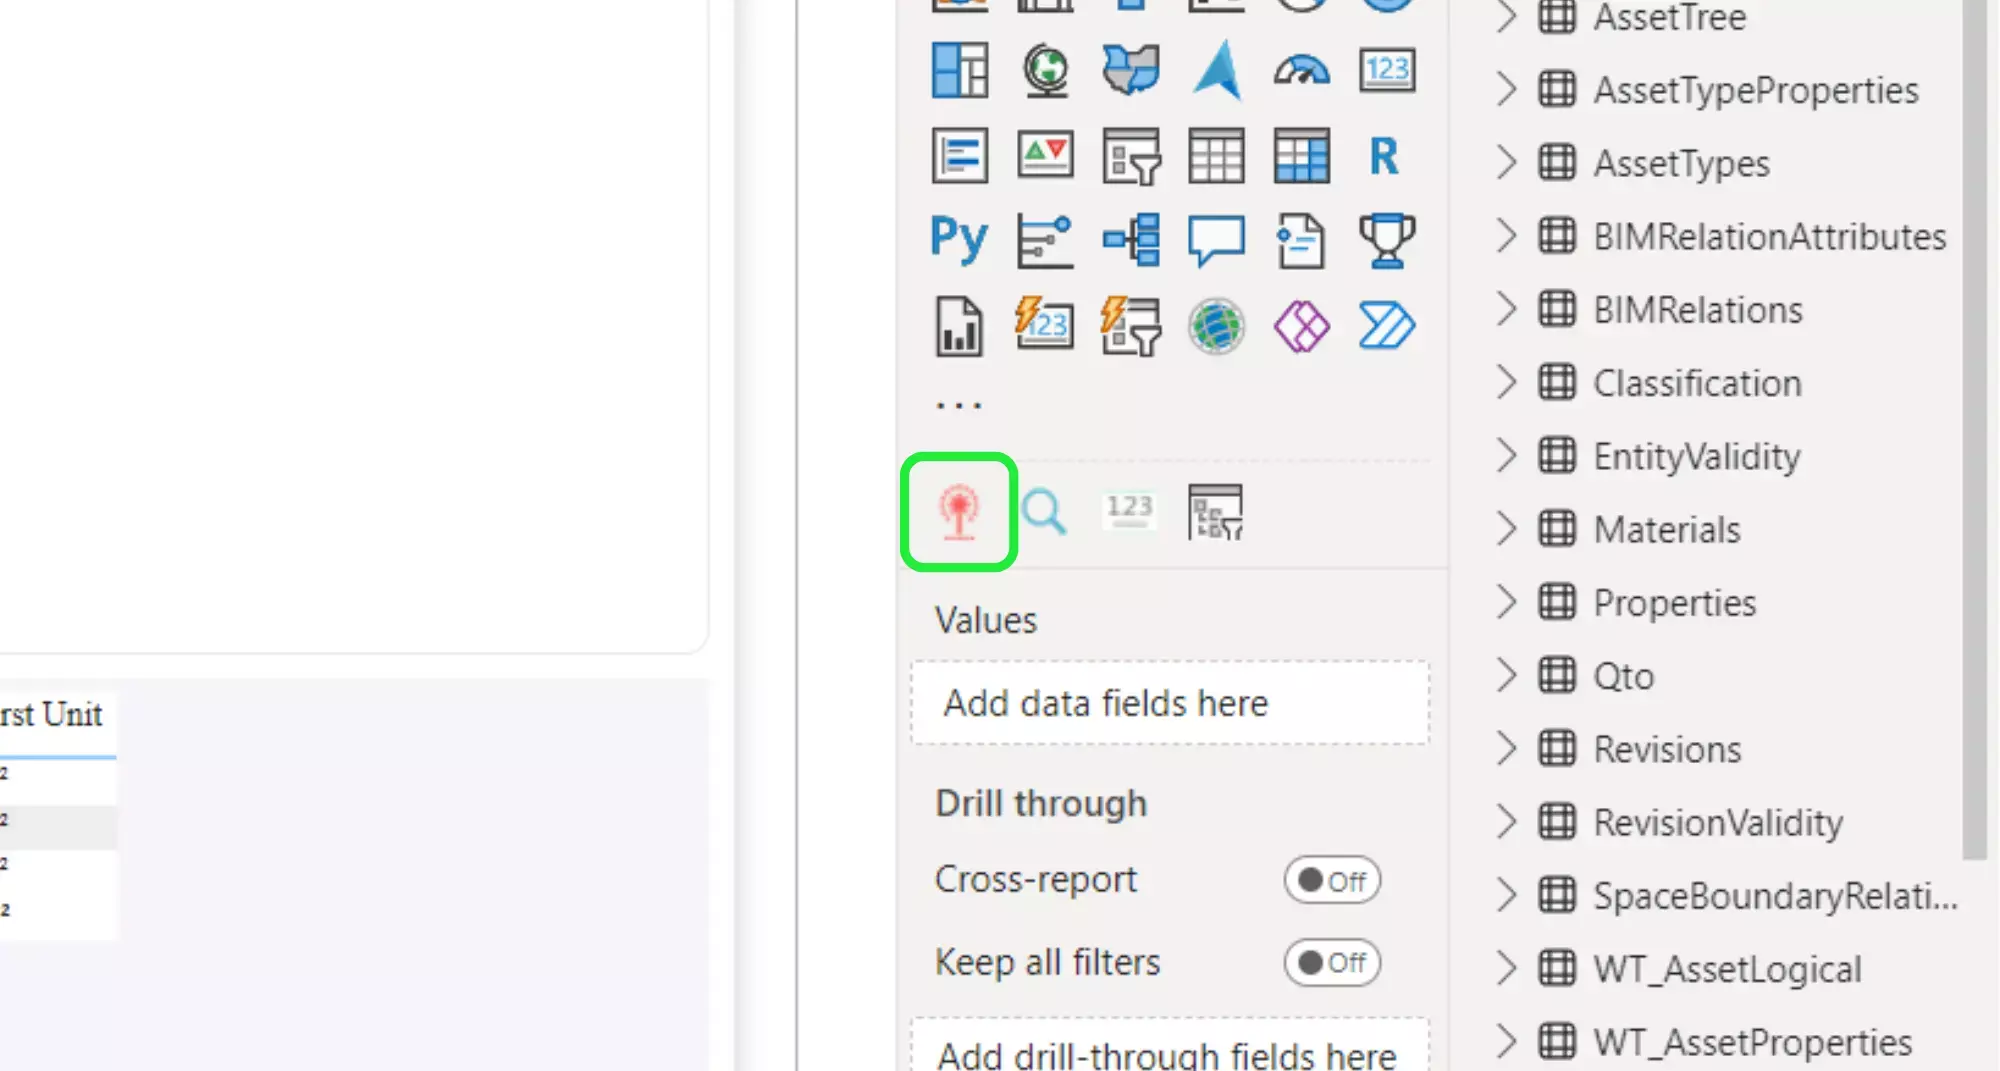
SeveUp has designed several custom visuals for use in the dashboards. These have already been inserted and pre-configured as standard for all of our dashboards. The 3D BIM viewer visual button is the red SeveUp icon as shown below.
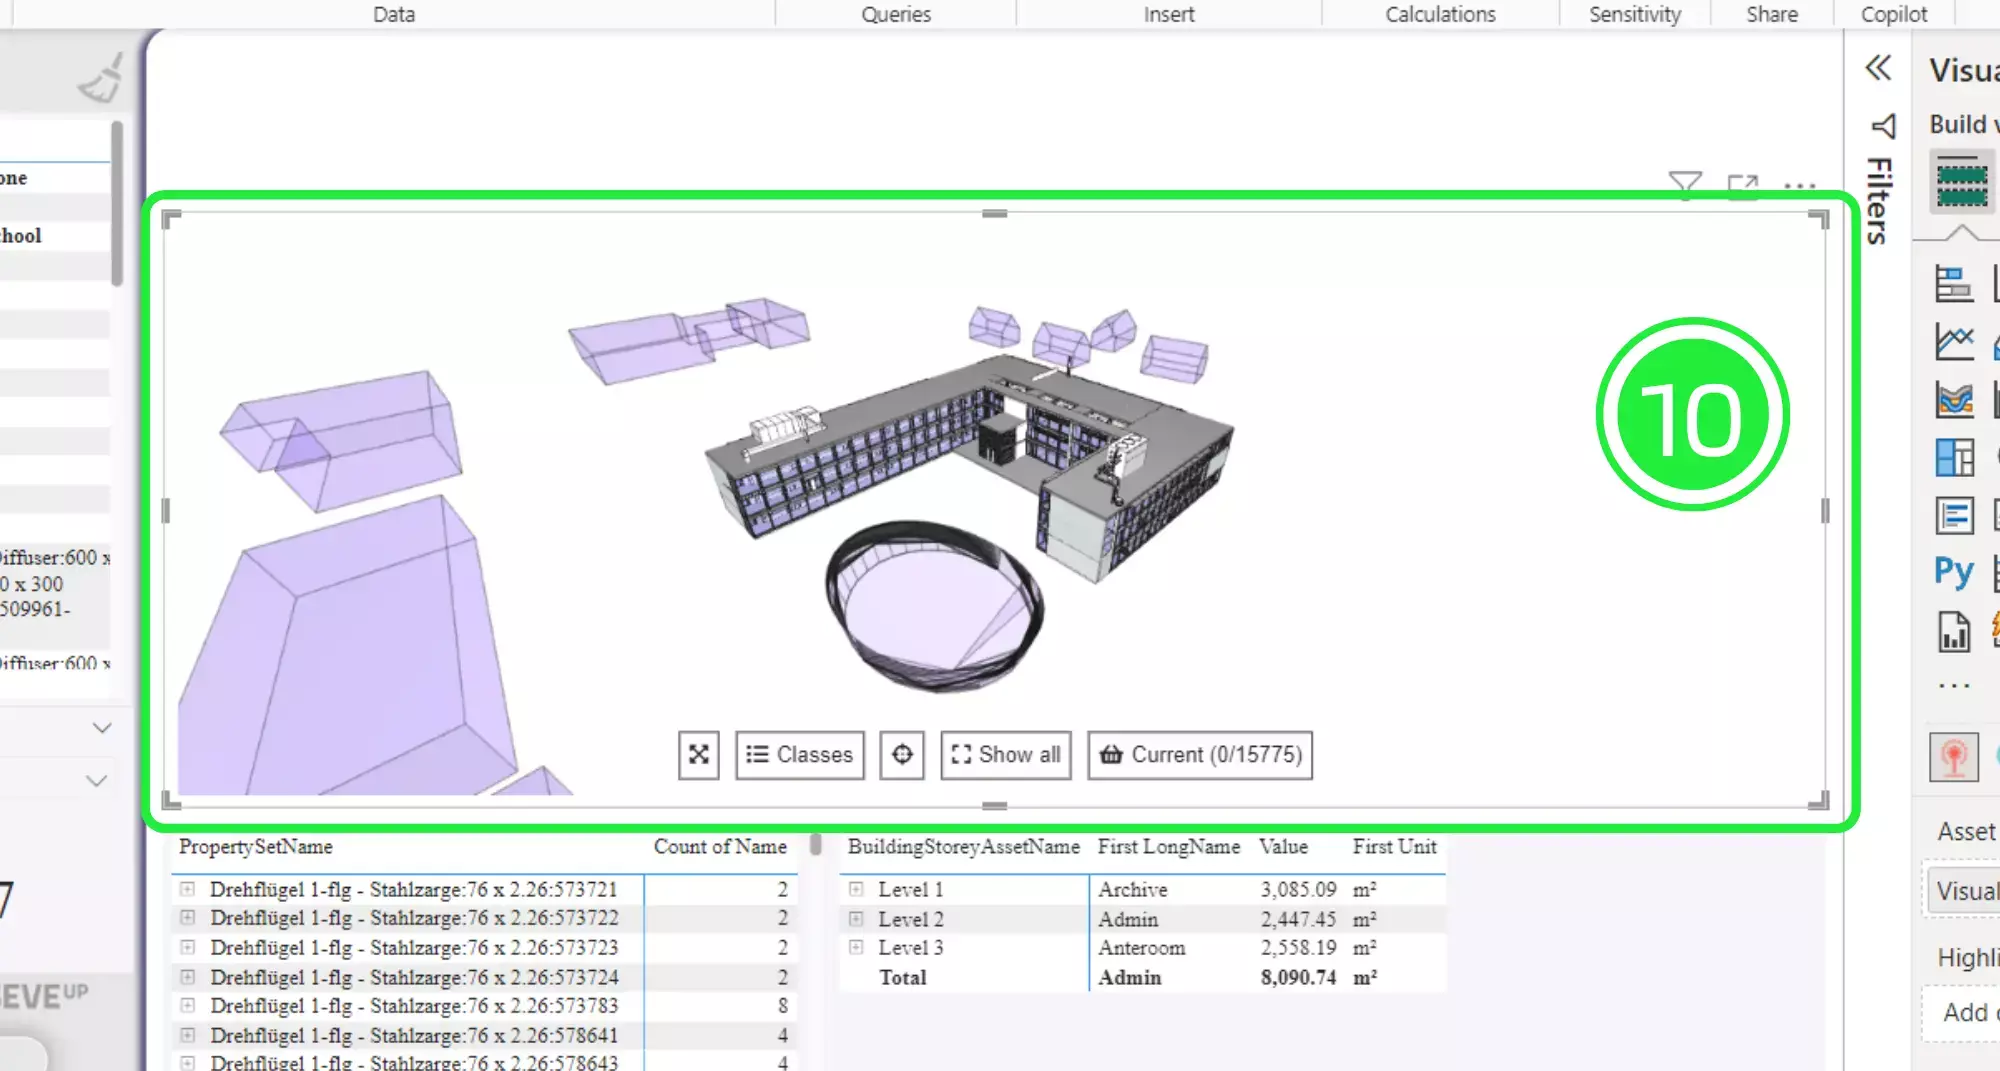
Moreover, activate the SeveUp 3D BIM Viewer by choosing it in order to change any of its settings. A resizing border will appear around it when it’s selected.
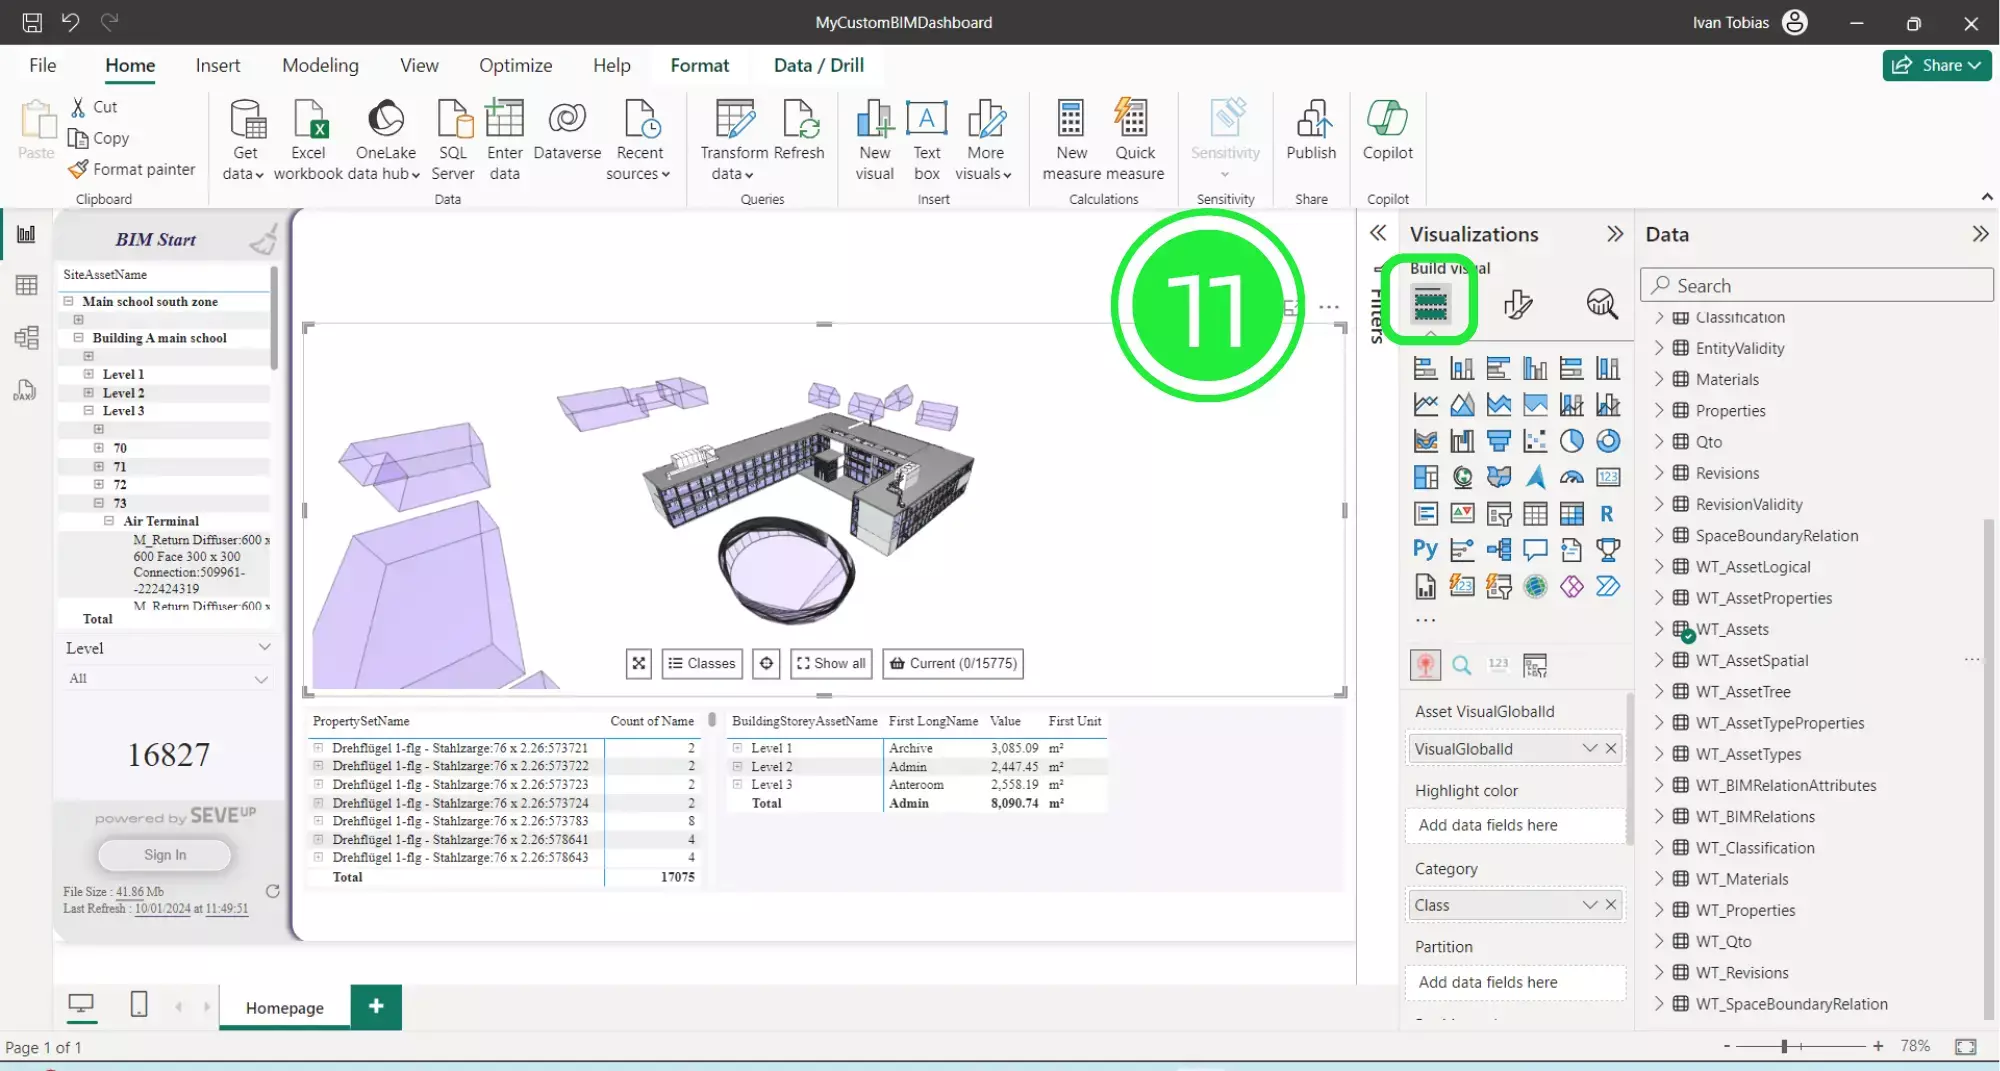
Next, move to the “Visualisations” pane on the right hand side and push “Build Visual”.
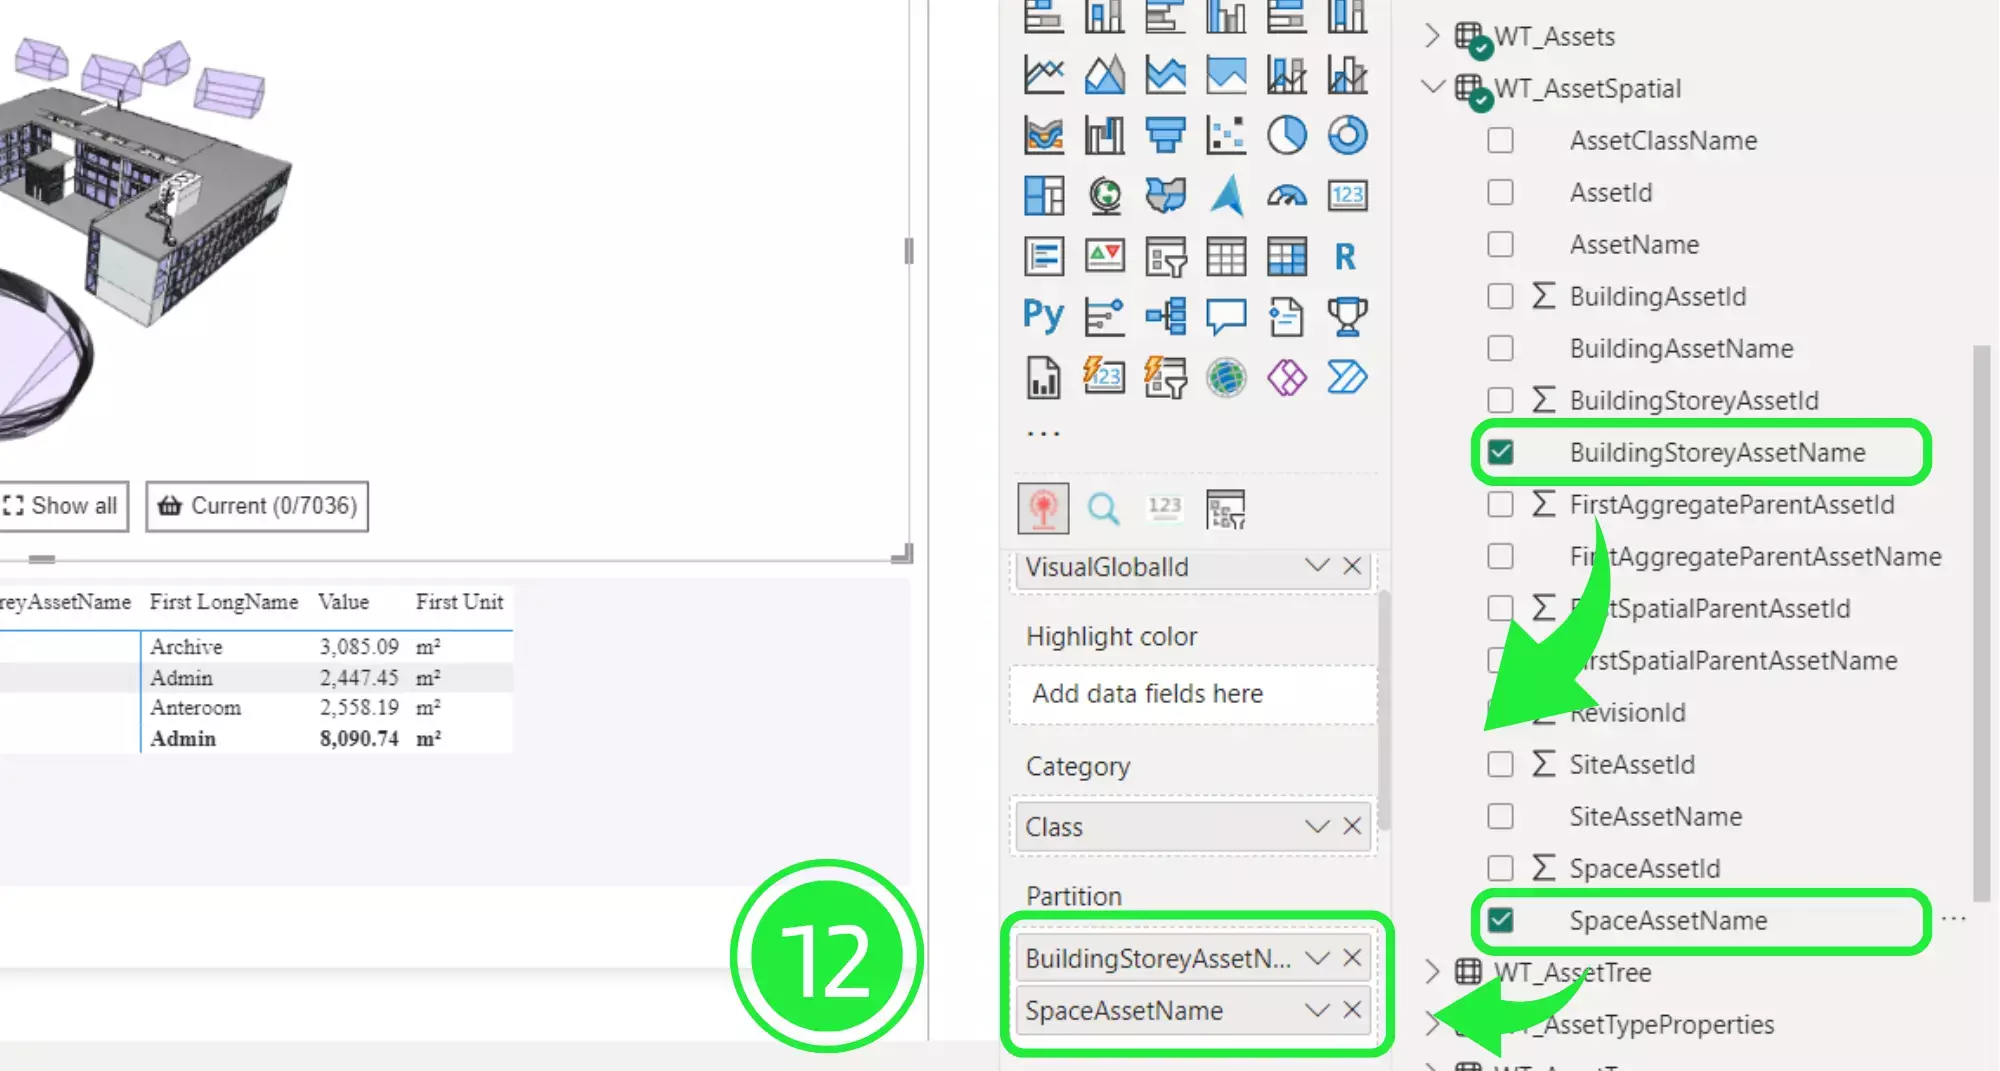
Scroll down to the “Partition” box. Then drop down the arrow on “WT_AssetSpatial” and drag and drop “BuildingStoreyAssetName” and “SpaceAssetName” to the “Partition” box.
The order you layer the data in is important. So ensure that “BuildingStoreyAssetName” is above “SpaceAssetName”. “BuildingStoreyAssetName” will be used for the first level of selection and “SpaceAssetName” will be for the next level.
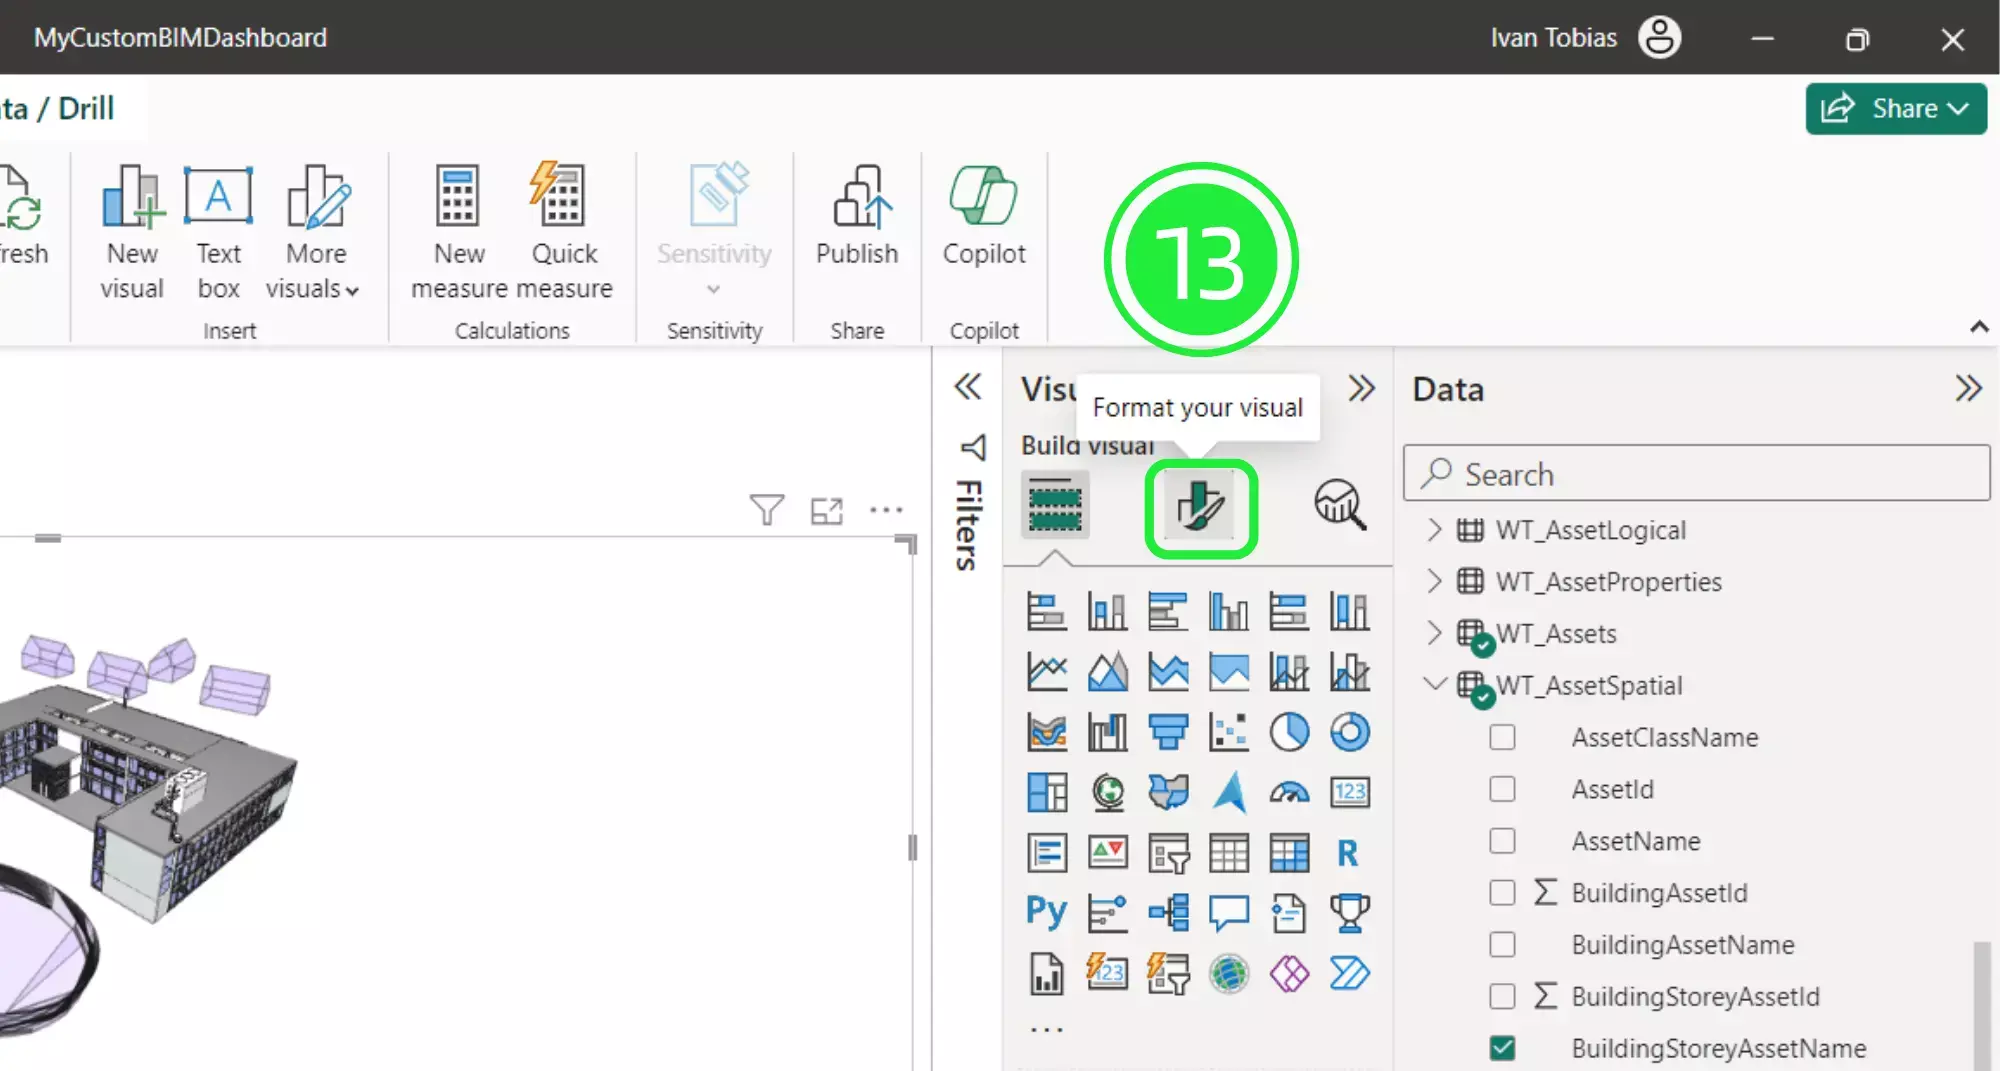
Subsequently, switch to the “Visualisations” pane again and press “Format your Visual”.
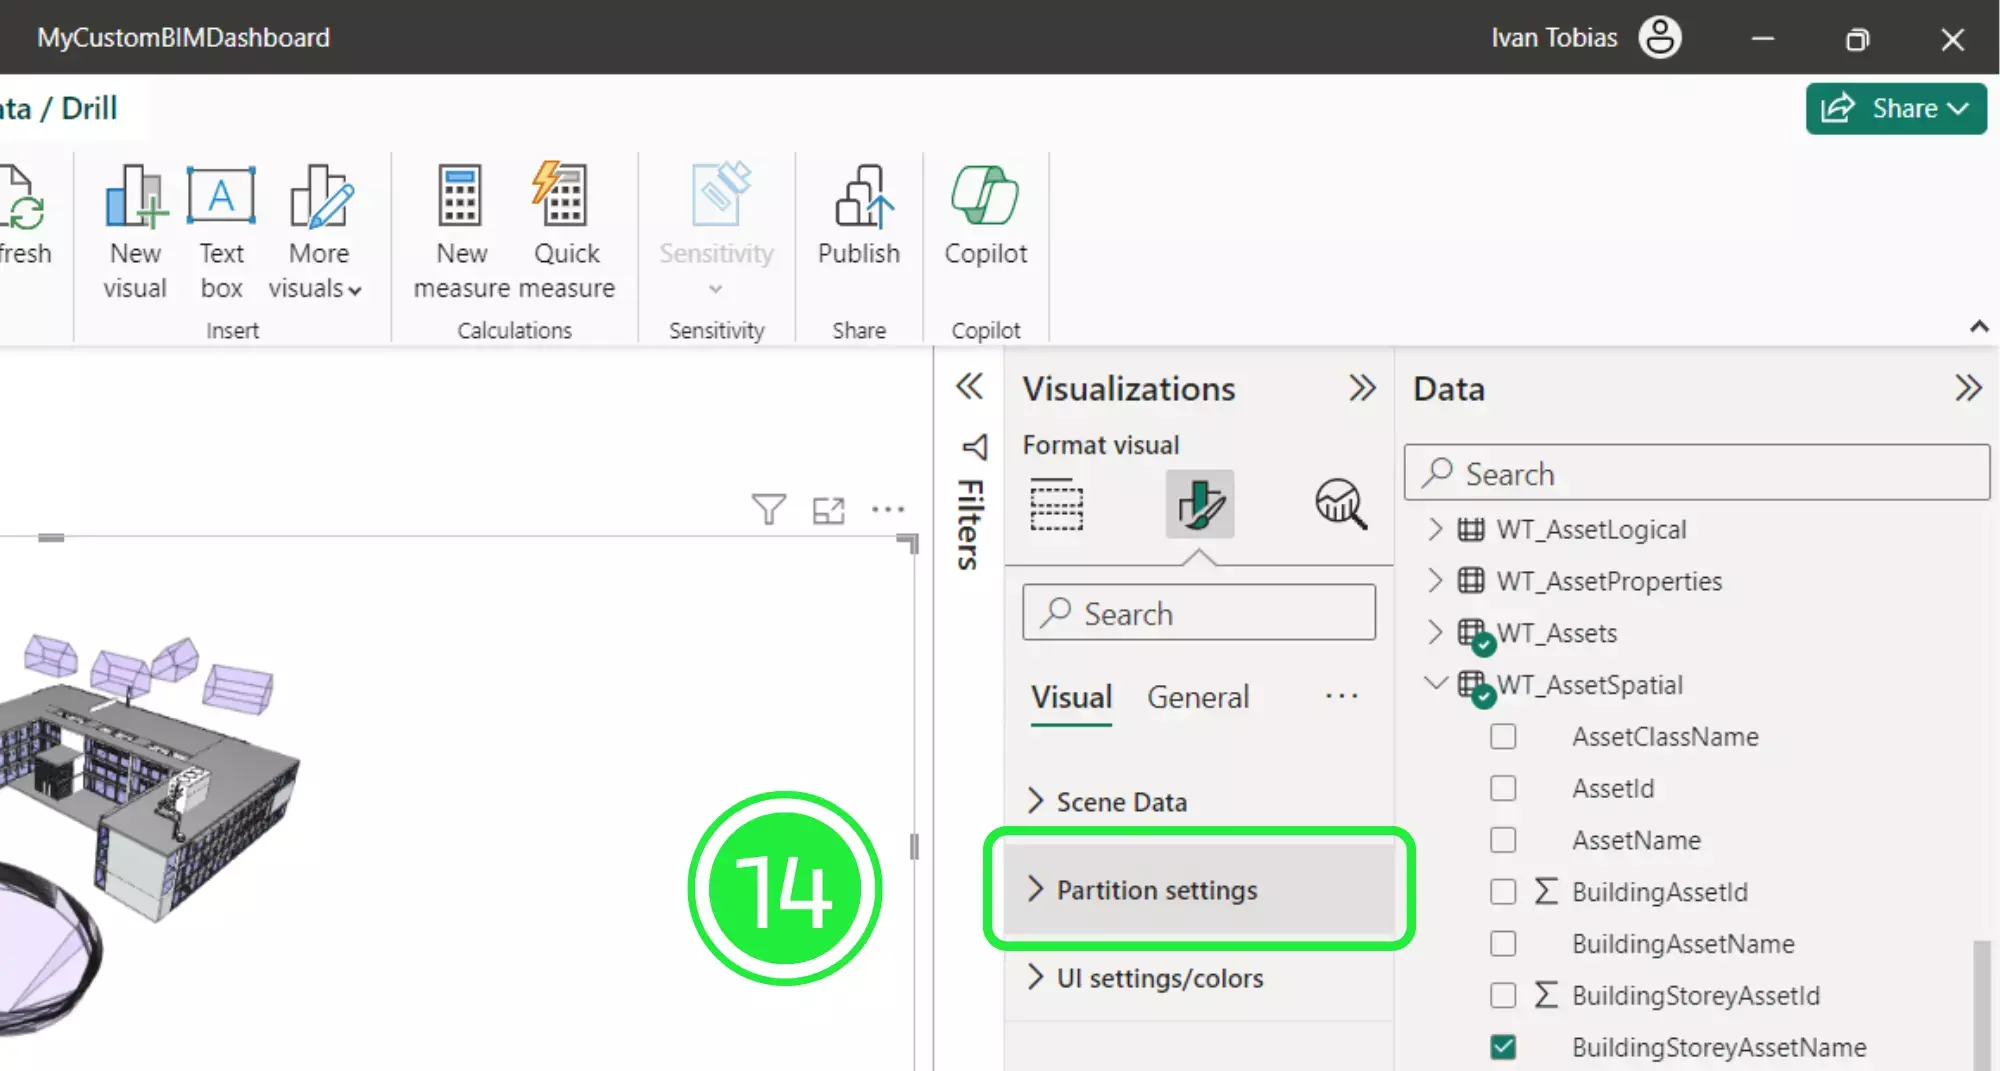
Specifically, under the “Visual” tab there are three more tabs. Hit “Partition settings” to open up the colour and opacity settings for the partition levels.
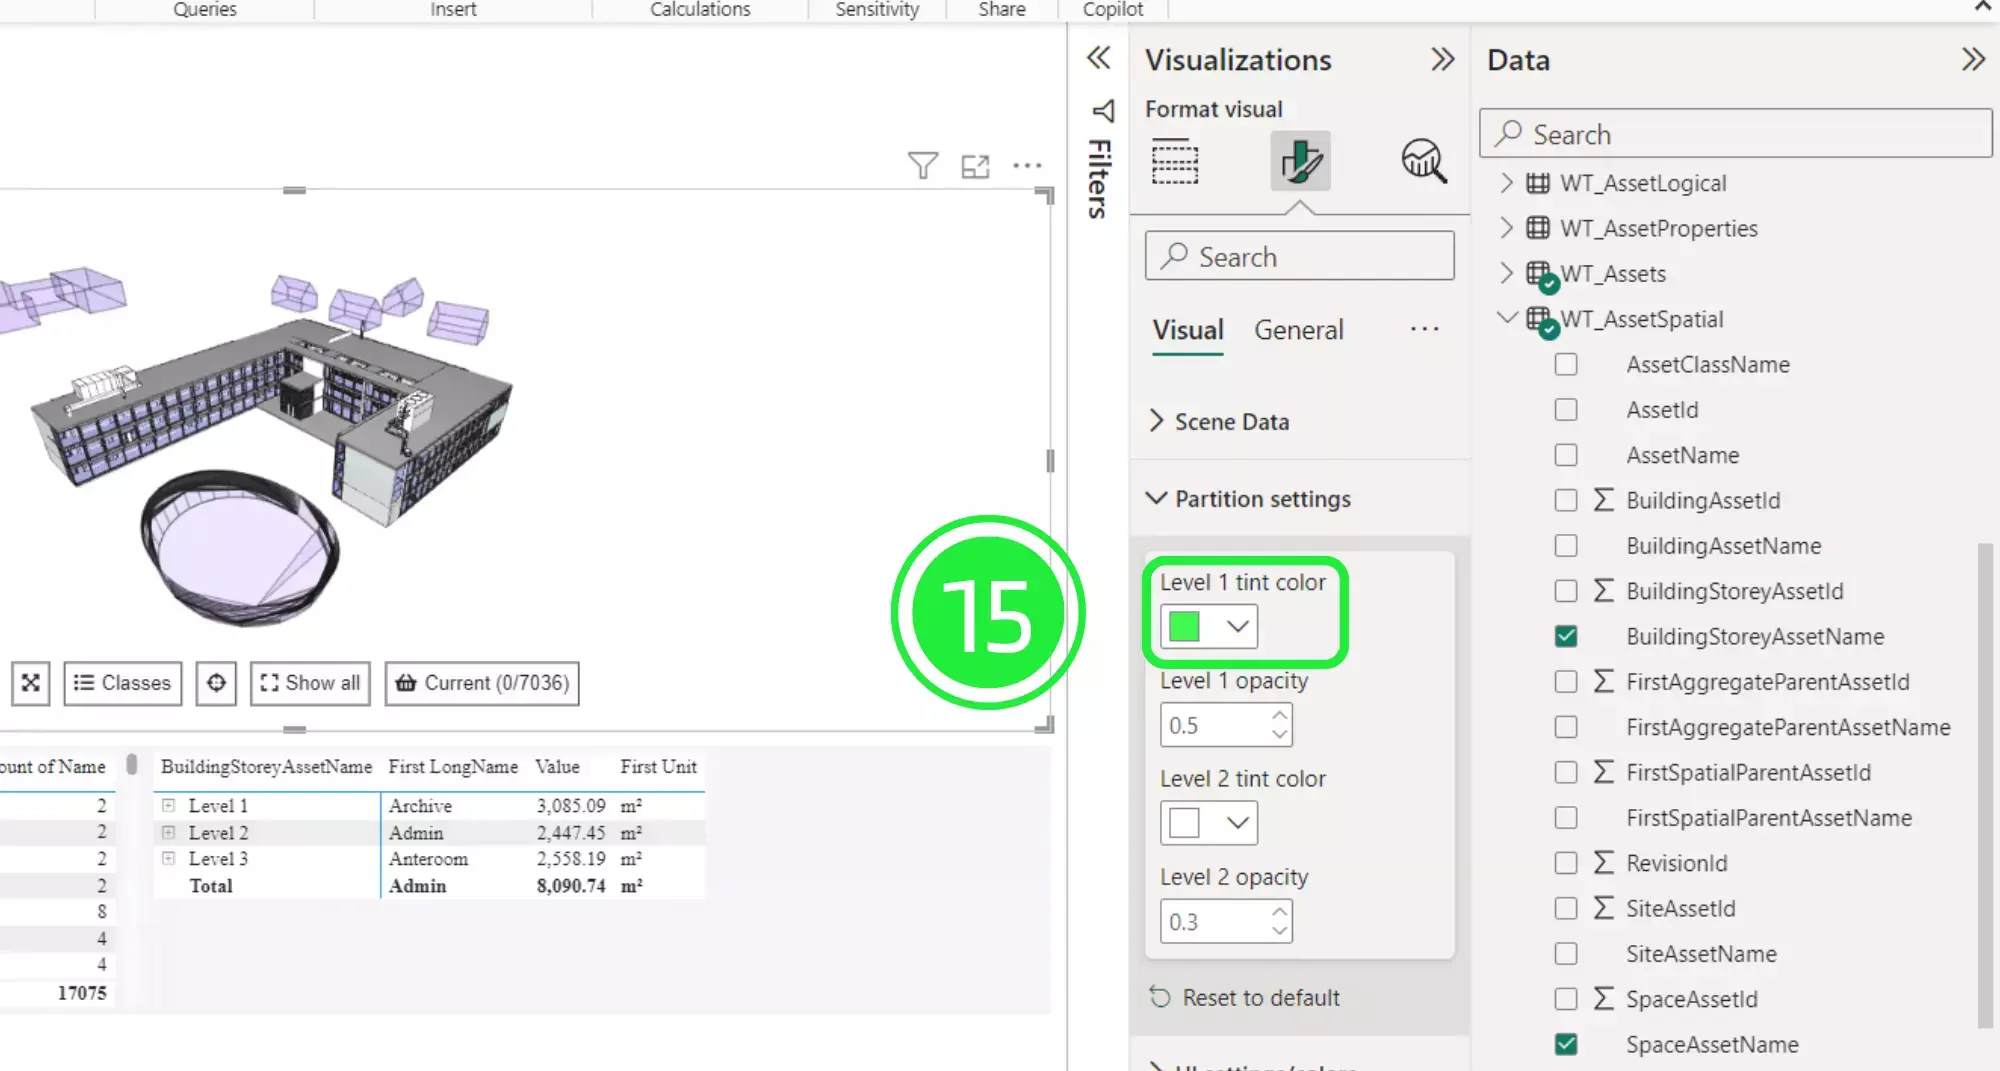
Likewise, hit “Level 1 tint colour” to open up the colour choices.
A palette of colours will appear for you to choose from. If you want to select different colours then choose “More Colours”.
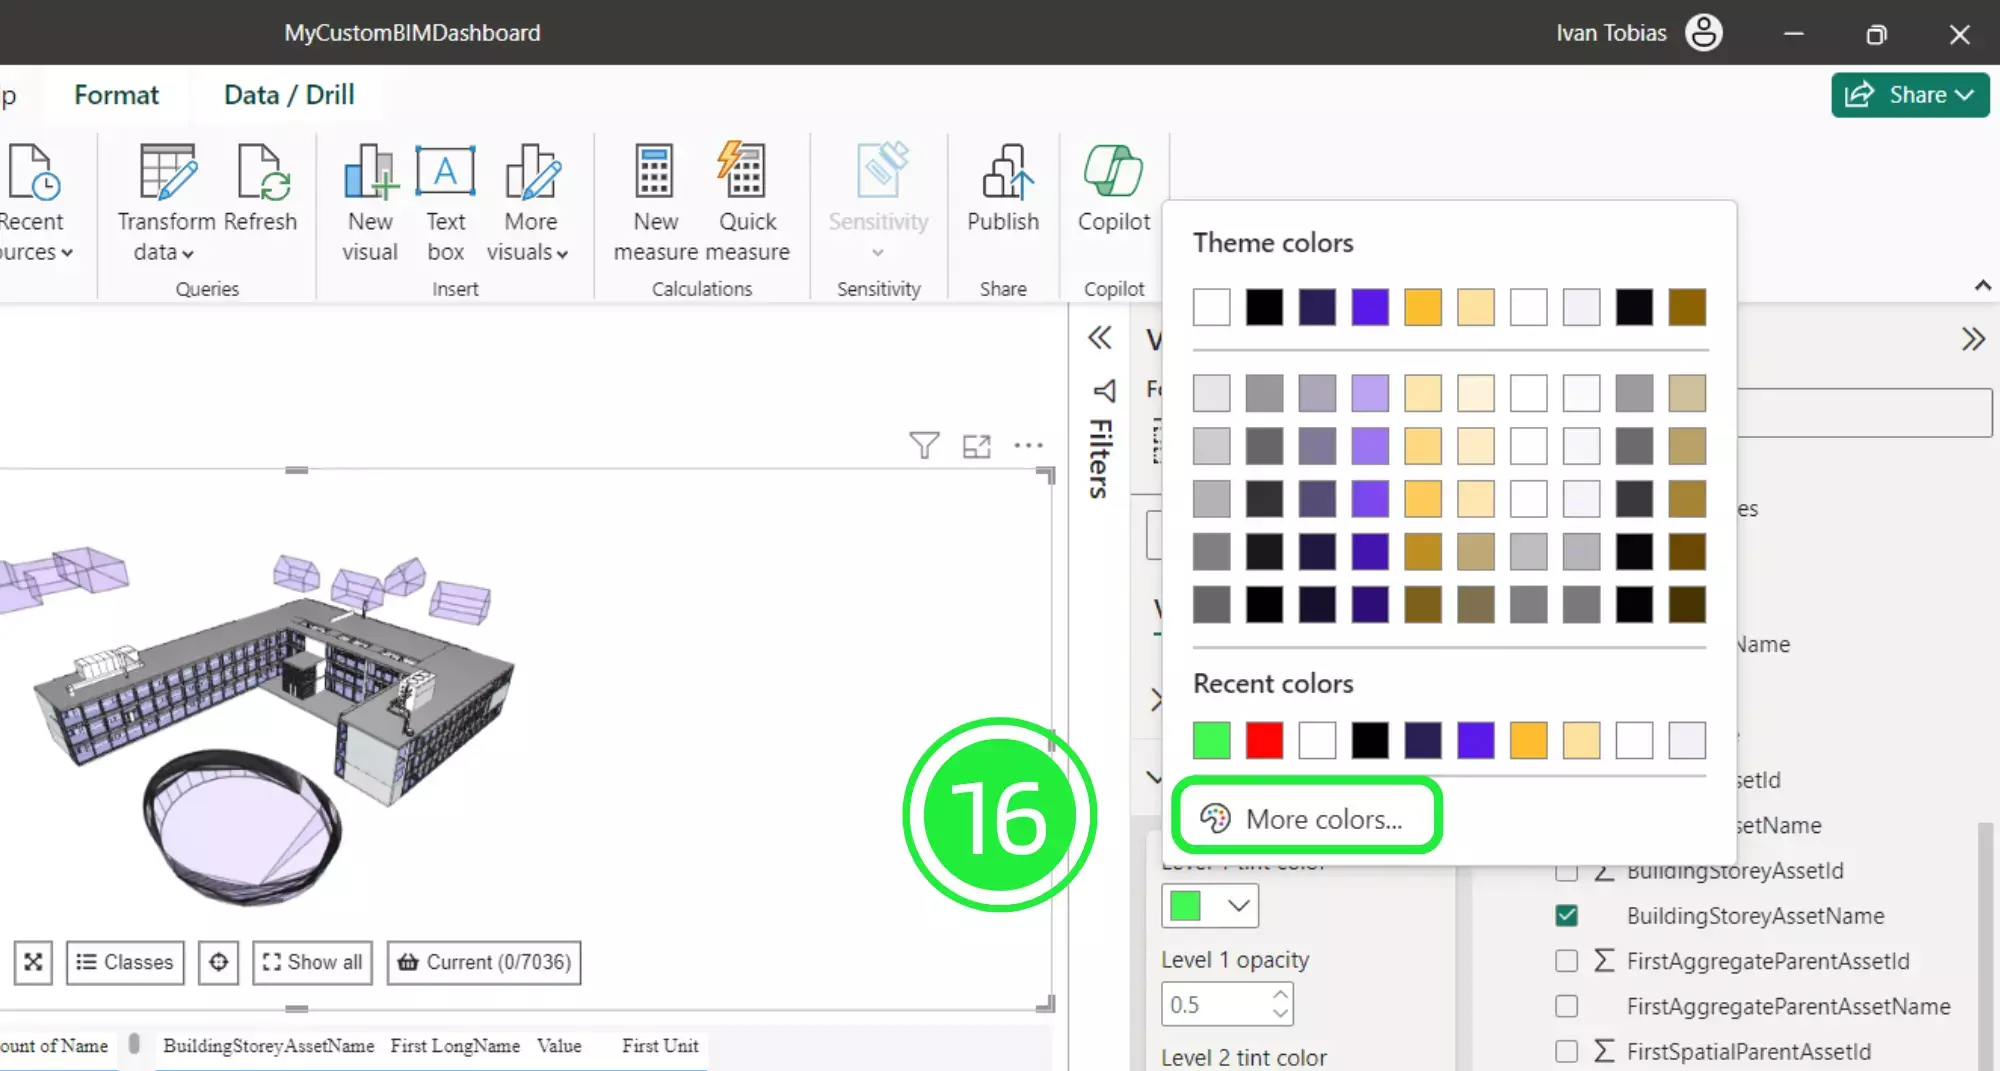
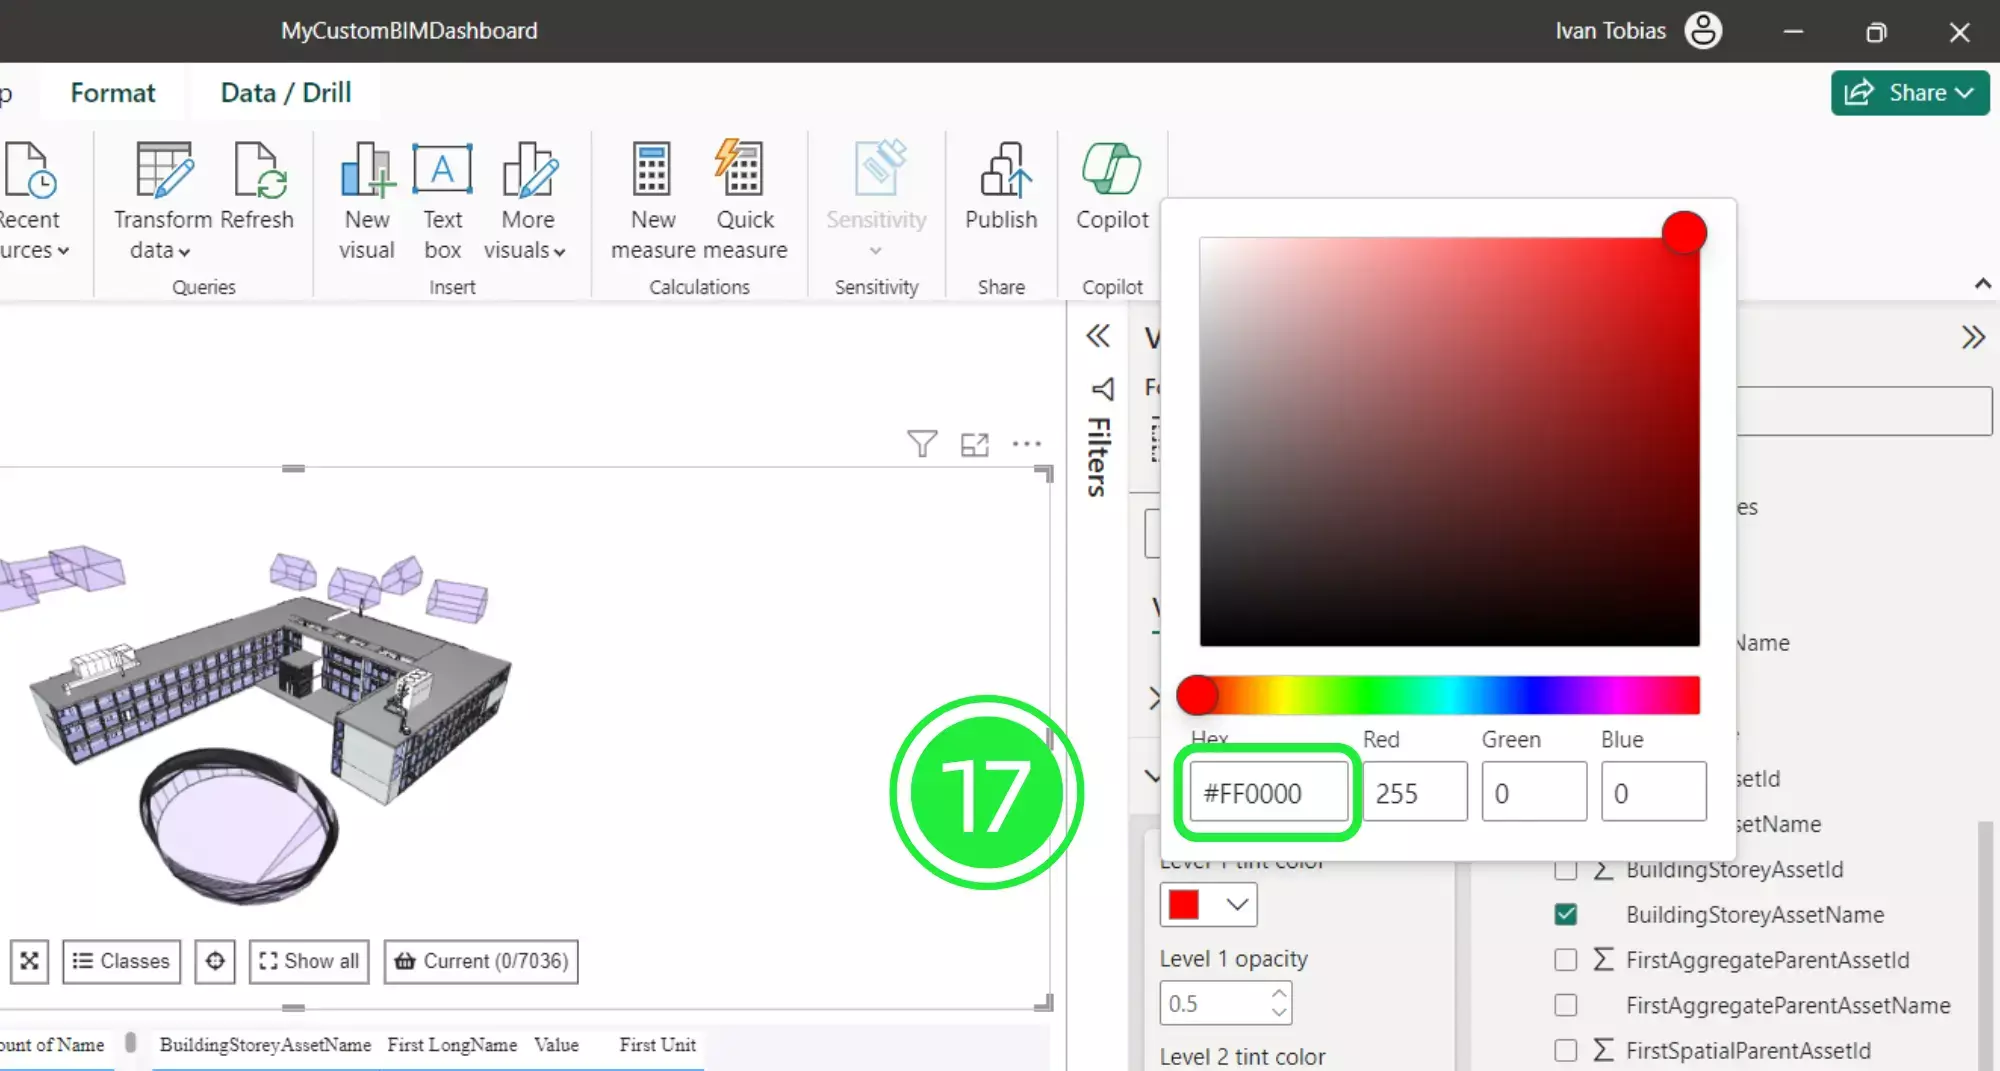
Now you can either choose from the spectrum or input your own colour code. This is especially useful if you would like to create visually appealing dashboards that align with your brand identity and brand colour palette.
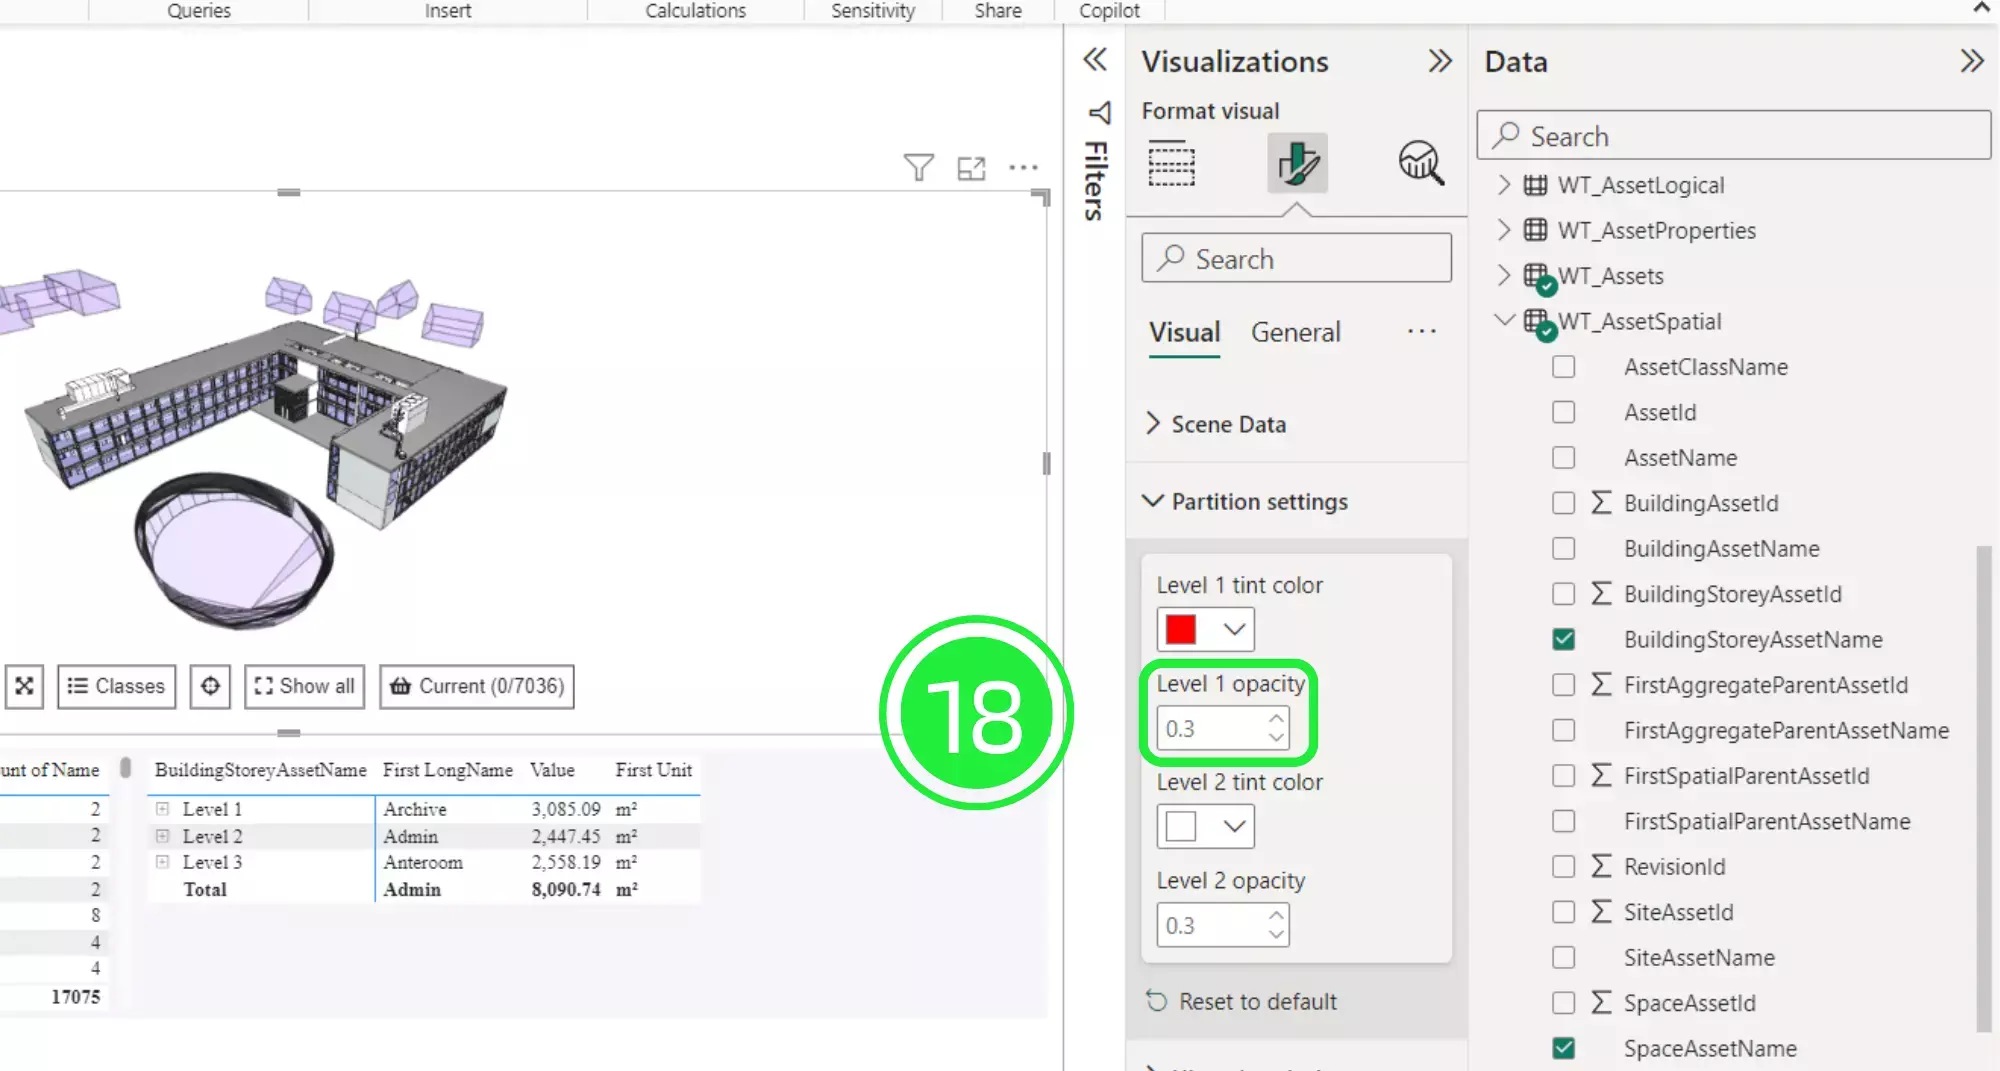
Finally, you can select the opacity of the Level 1 partition selection within the BIM viewer by changing the setting in “Level 1 opacity”. The range is from 0 to 1 but to keep the BIM model transparent the highest recommended is 0.5. The best setting for the partition selection is at 0.3 opacity.
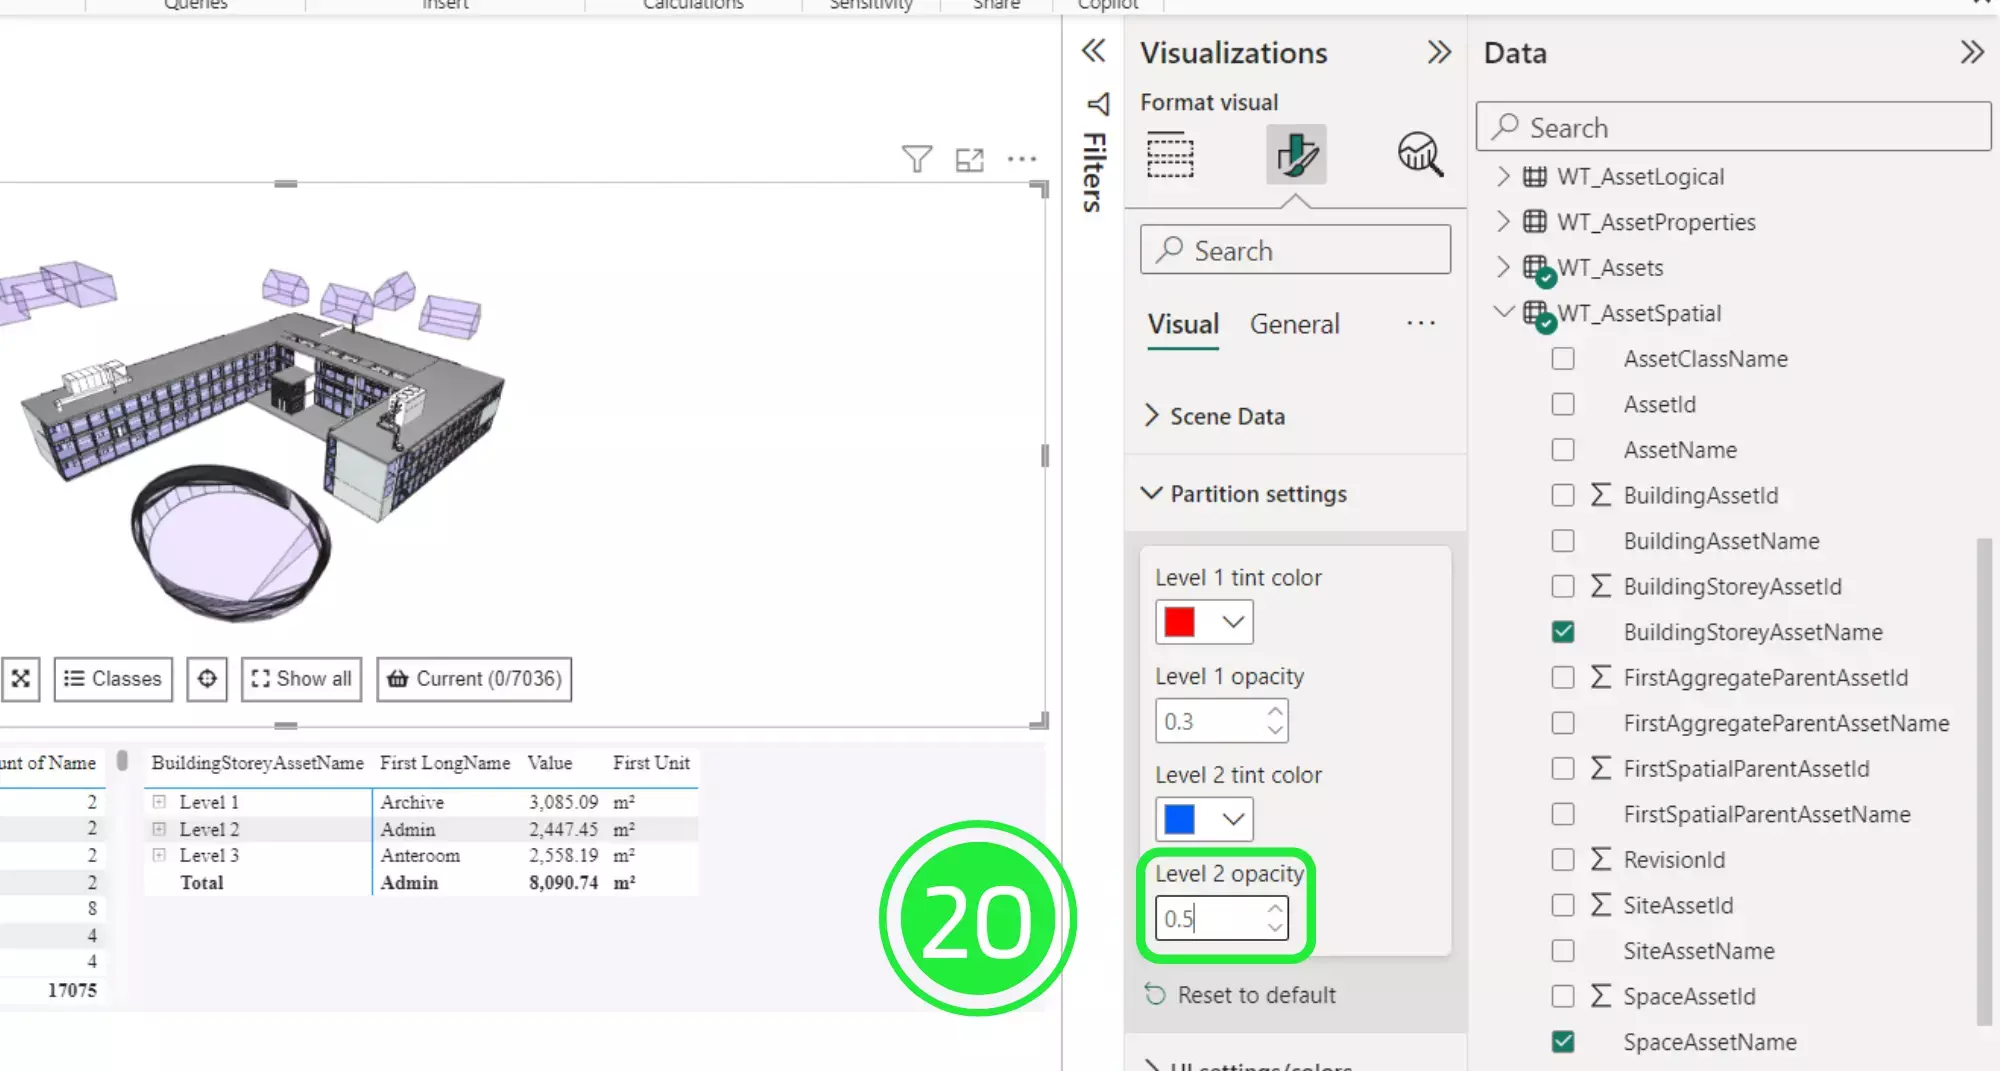
Now change the colour or input a colour code for the Level 2 tint colour.
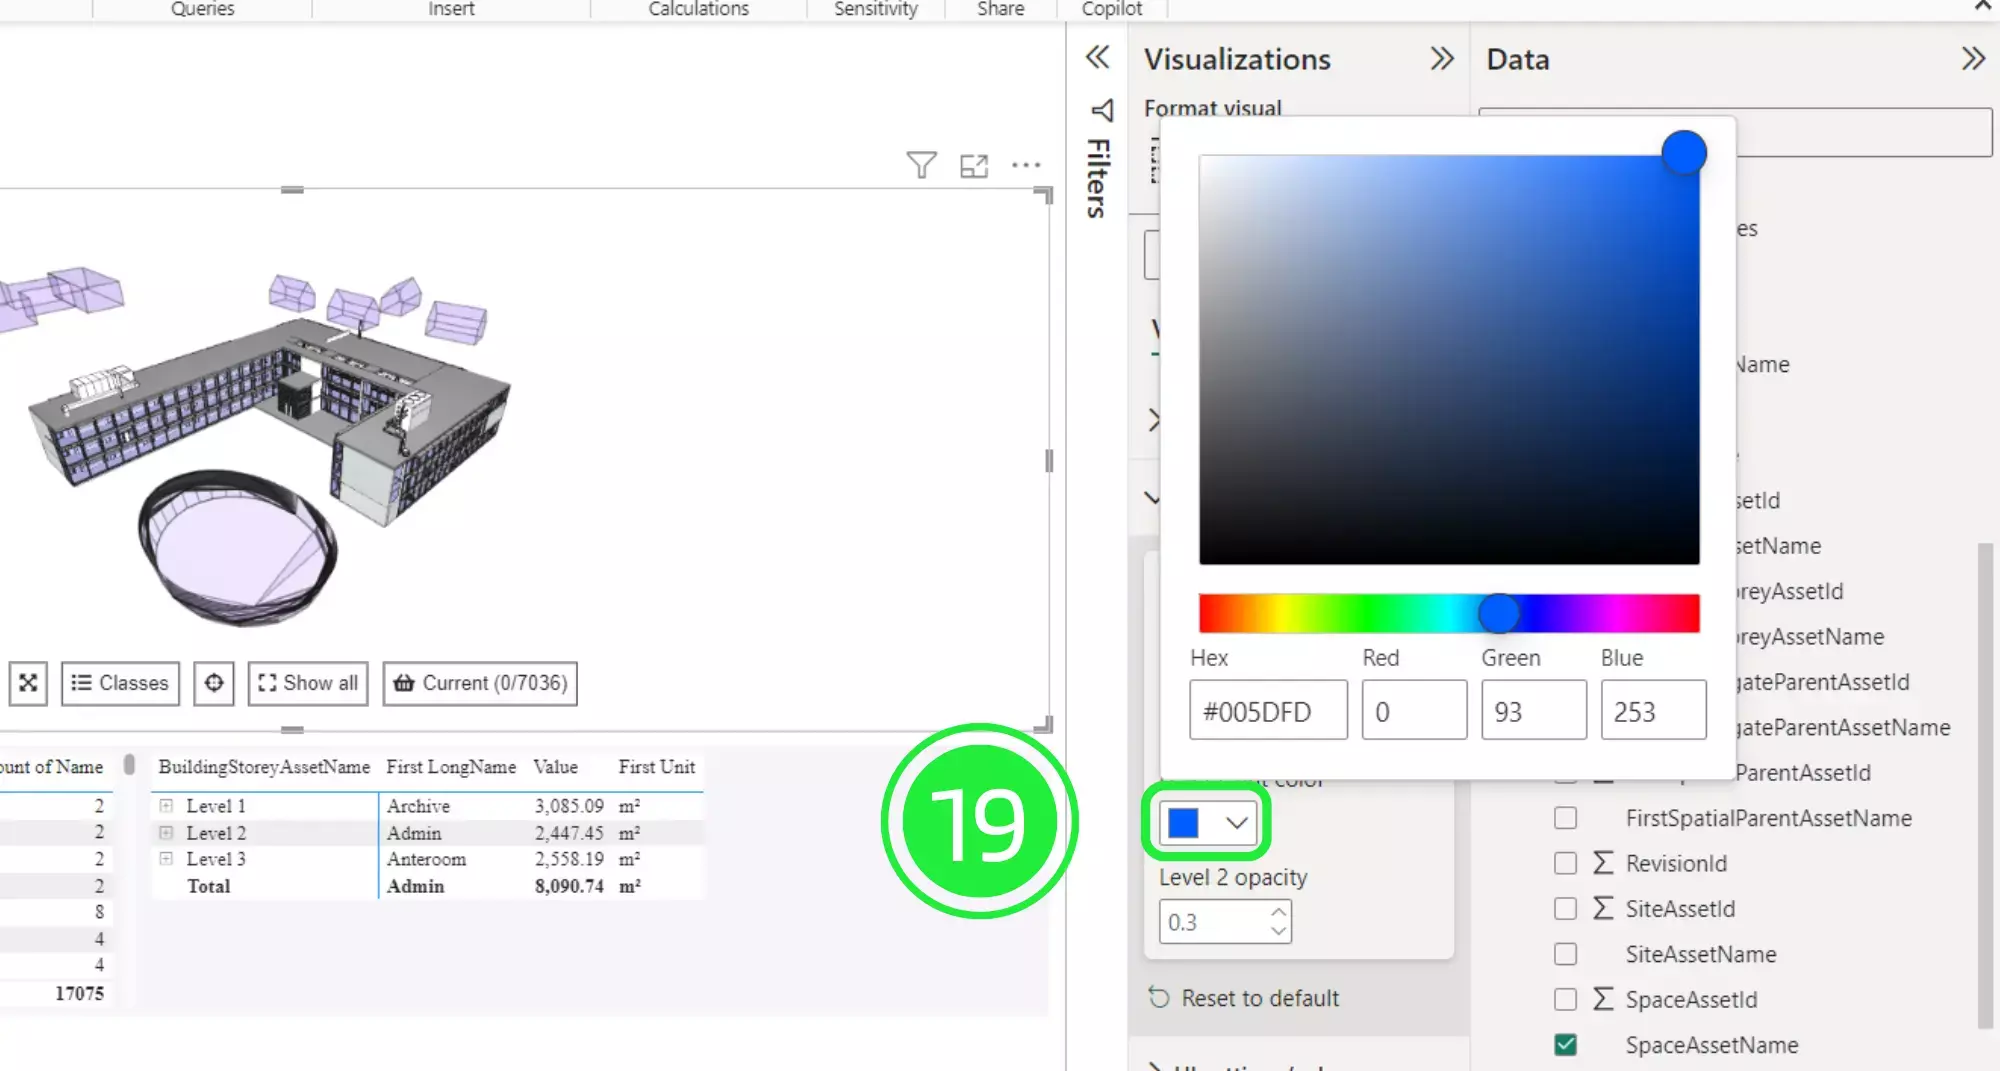
You can transform the opacity of the Level 2 selected assets within the BIM viewer by changing the setting in “Level 2 opacity”.
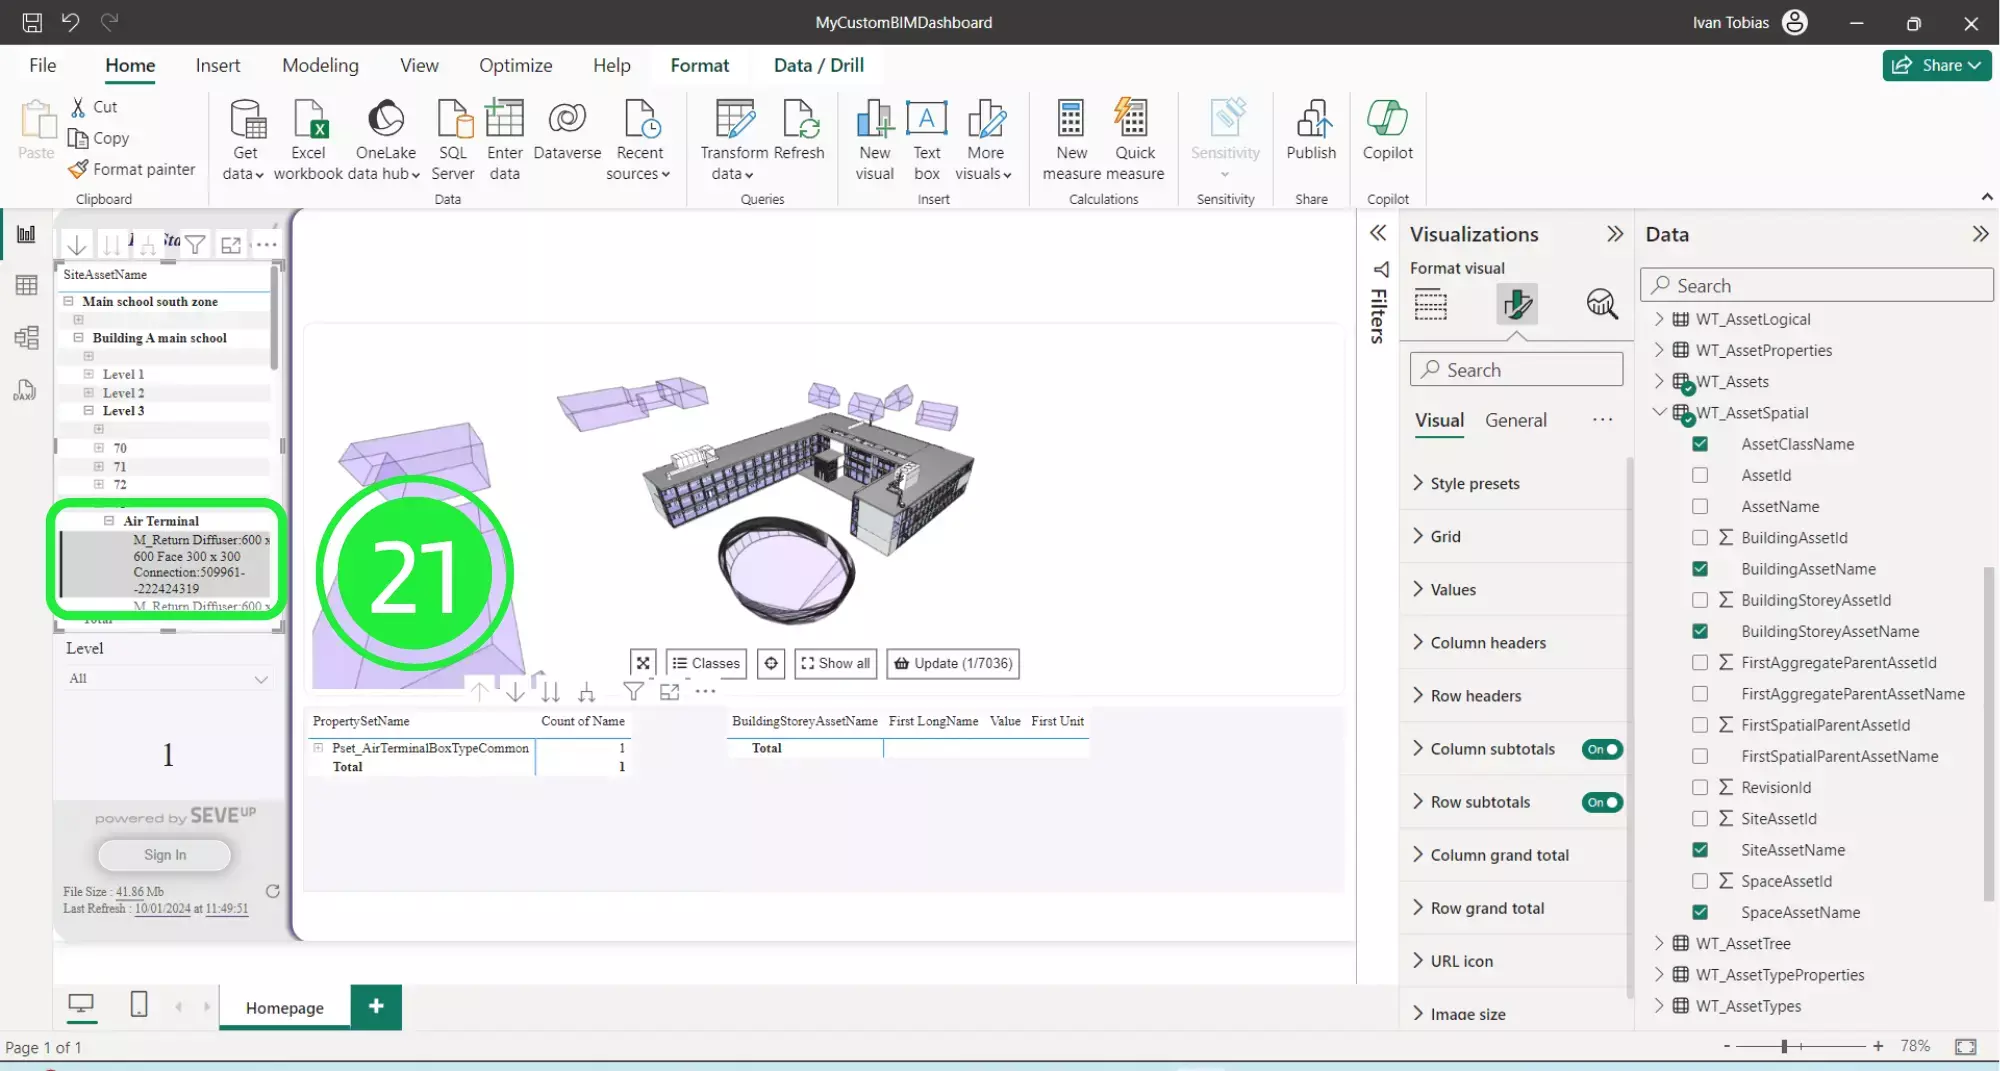
Select an asset within your BIM model by using one of the other visuals such as the Matrix table on the left.
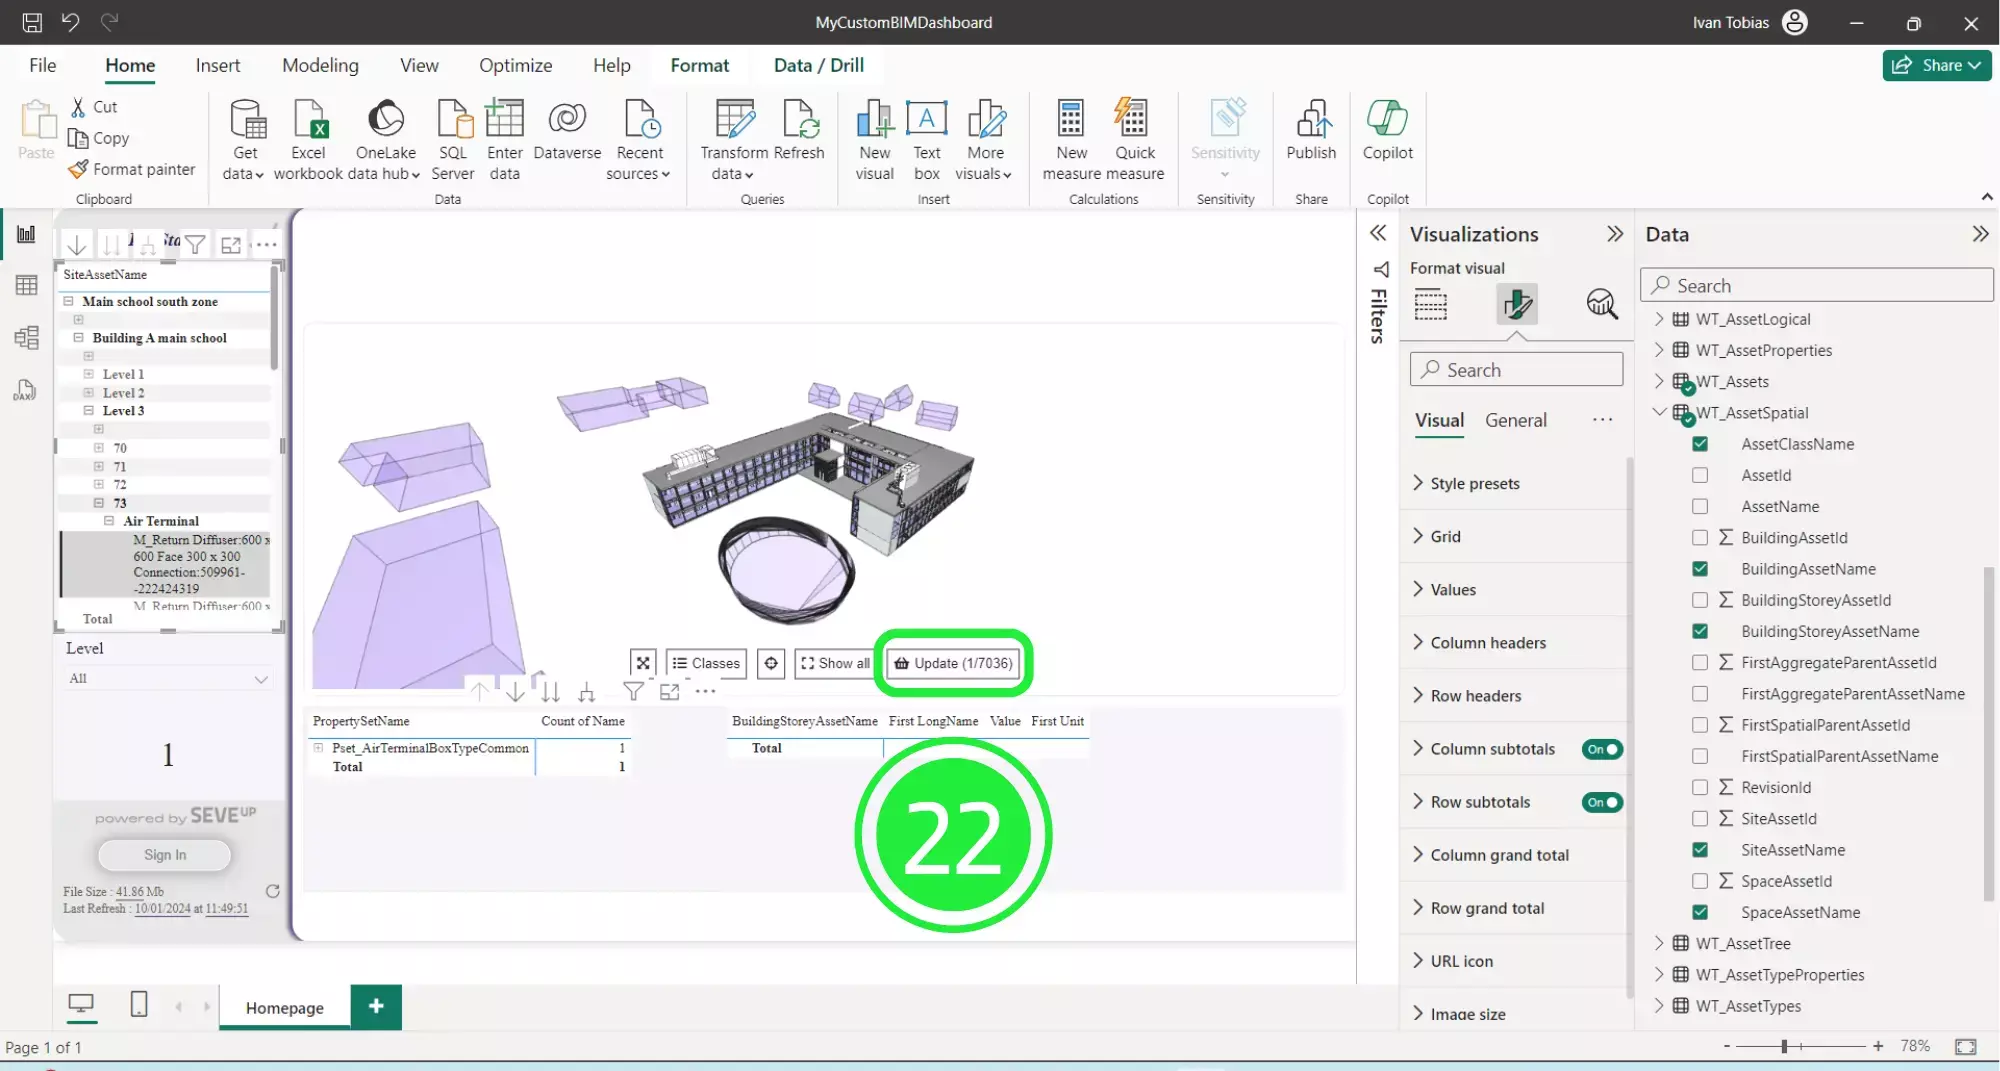
Moreover, engage the “Update” button within the SeveUp 3D BIM viewer to show the selected asset.
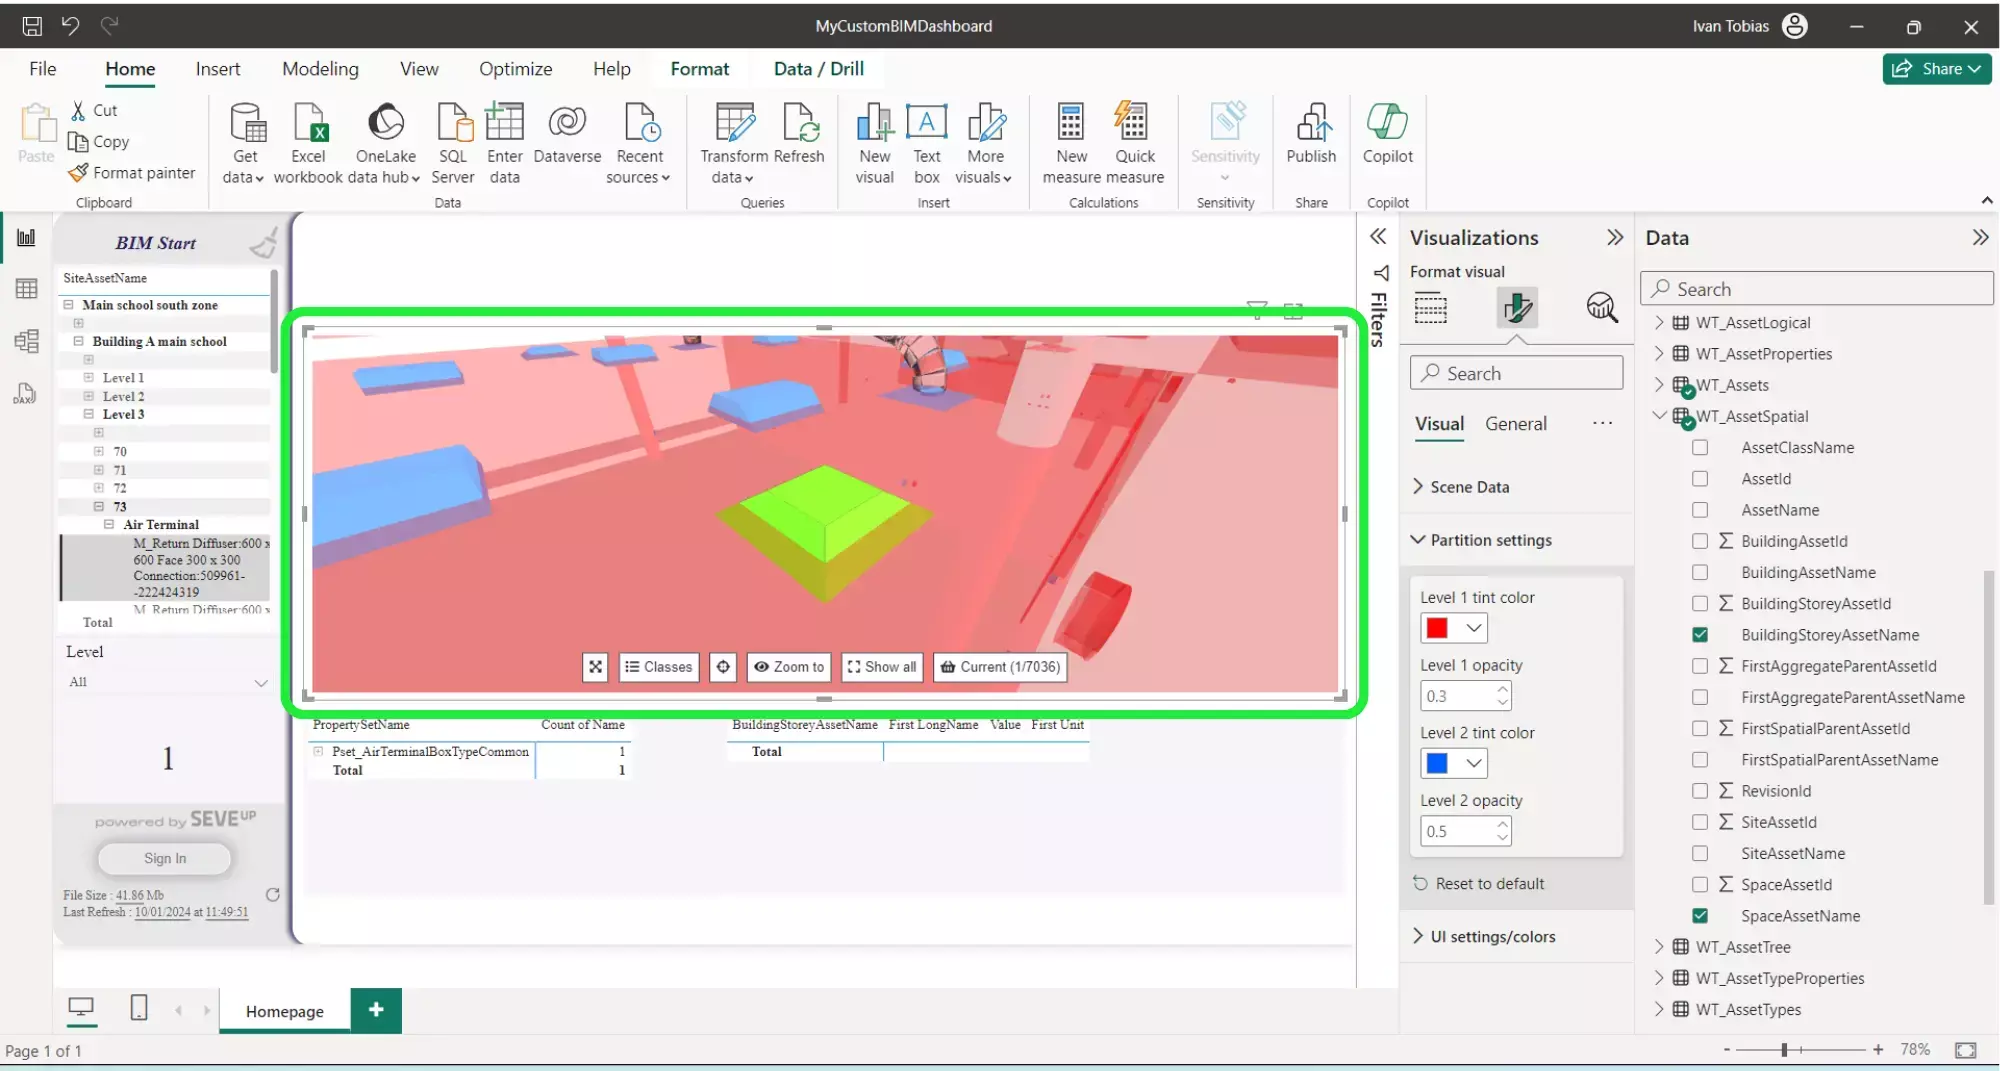
Ultimately, the 3D BIM viewer will autofocus onto the selected asset and highlight it in green by default. The Level 1 and Level 2 partitioned selections are now shown in the chosen colours. This makes it very easy to see the relationships between assets within the BIM model and therefore streamline your BIM process.
By customising your SeveUp 3D BIM viewer you can create a look that fits with your company and your brand identity. The options are limitless.
Next step : Want to get started with your very own BIM project? You’ll be surprised by just how easy it is. Create your own free account is SeveUp today and give it a try.
Learn how to automate your BIM model checks and get certified.


🎓 Free BIM Checker Training Learn how to automate your BIM model checks and get certified. Register for Free Click
Learn More🎓 Free BIM Checker Training Learn how to automate your BIM model checks and get certified. Register for Free Click
Learn More🎓 Free BIM Checker Training Learn how to automate your BIM model checks and get certified. Register for Free Choose
Learn More